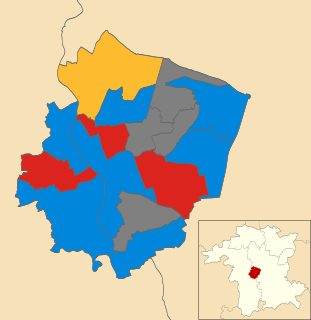
The 2004 Worcester City Council election took place on 10 June 2004 to elect members of Worcester District Council in Worcestershire, England. The whole council was up for election with boundary changes since the last election in 2003 reducing the number of seats by one. [1] The Conservative party stayed in overall control of the council. [2]
Worcester is a city in Worcestershire, England, 31 miles (50 km) southwest of Birmingham, 101 miles (163 km) west-northwest of London, 27 miles (43 km) north of Gloucester and 23 miles (37 km) northeast of Hereford. The population is approximately 100,000. The River Severn flanks the western side of the city centre, which is overlooked by Worcester Cathedral.
Non-metropolitan districts, or colloquially "shire districts", are a type of local government district in England. As created, they are sub-divisions of non-metropolitan counties in a two-tier arrangement.
Worcestershire is a county in the West Midlands of England. Between 1974 and 1998, it was merged with the neighbouring county of Herefordshire as Hereford and Worcester.
Before the election the council was composed of 18 Conservatives, 10 Labour, 4 independents, 2 Liberal Democrats, 1 independent Conservative and 1 vacant seat. [3] Boundary changes saw the number of seats reduced from 36 to 35 for the 2004 election, [4] meaning that the whole council would be up for election for the first time since 1976. [5] This also meant that the number of wards was increased from 12 to 15, with new wards including Cathedral and Rainbow Hill. [6]
The Labour Party is a centre-left political party in the United Kingdom which has been described as an alliance of social democrats, democratic socialists and trade unionists. The party's platform emphasises greater state intervention, social justice and strengthening workers' rights. Labour is a full member of the Party of European Socialists and Progressive Alliance, and holds observer status in the Socialist International. As of 2017, the party was considered the "largest party in Western Europe" in terms of party membership, with more than half a million members.
The Liberal Democrats are a liberal, centrist political party in the United Kingdom. They presently have 11 Members of Parliament in the House of Commons, 96 members of the House of Lords, and one member of the European Parliament. They also have five Members of the Scottish Parliament and a member each in the Welsh Assembly and London Assembly. The party reached the height of its influence in the early 2010s, forming a junior partner in a coalition government from 2010 to 2015. It is presently led by Vince Cable.
All parties were hoping to make gains with the Conservatives defending their record in control of the council, which they said included having a balanced budget and keeping the council tax rise down to 2.5%. [6] Other issues raised in the election included recycling, improving public transport, dealing with traffic congestion and keeping the streets clean. [6]
Recycling is the process of converting waste materials into new materials and objects. It is an alternative to "conventional" waste disposal that can save material and help lower greenhouse gas emissions. Recycling can prevent the waste of potentially useful materials and reduce the consumption of fresh raw materials, thereby reducing: energy usage, air pollution, and water pollution.
Public transport is transport of passengers by group travel systems available for use by the general public, typically managed on a schedule, operated on established routes, and that charge a posted fee for each trip. Examples of public transport include city buses, trolleybuses, trams and passenger trains, rapid transit and ferries. Public transport between cities is dominated by airlines, coaches, and intercity rail. High-speed rail networks are being developed in many parts of the world.
The results saw the Conservatives achieve a majority on the council after winning 18 of the 35 seats. [4] Labour remained on 10 seats while the Liberal Democrats gained 1 to hold 3 seats. [4]
Party | Seats | Gains | Losses | Net gain/loss | Seats % | Votes % | Votes | +/− | |
---|---|---|---|---|---|---|---|---|---|
Conservative | 18 | -1 | 51.4 | 45.6 | 24,729 | +4.3% | |||
Labour | 10 | 0 | 28.6 | 28.8 | 15,576 | -7.1% | |||
Independent | 4 | -1 | 11.4 | 8.6 | 4,653 | -0.9% | |||
Liberal Democrat | 3 | +1 | 8.6 | 15.4 | 8,346 | +4.6% | |||
BNP | 0 | 0 | 0 | 1.6 | 871 | +0.4% |
Party | Candidate | Votes | % | ± | |
---|---|---|---|---|---|
Labour | Robert Peachey | 694 | |||
Labour | Richard Bird | 693 | |||
Conservative | Jonathon Cunningham | 656 | |||
Conservative | Haris Saleem | 524 | |||
Liberal Democrat | Oliver Orr | 471 | |||
Turnout | 3,038 | 41 |
Party | Candidate | Votes | % | ± | |
---|---|---|---|---|---|
Conservative | Robert Rowden | 906 | |||
Conservative | David Tibbutt | 833 | |||
Liberal Democrat | Louis Stephen | 456 | |||
Labour | Andrew Watson | 411 | |||
Liberal Democrat | Paul Griffiths | 399 | |||
Labour | Christopher Winwood | 344 | |||
Turnout | 3,349 | 44 |
Party | Candidate | Votes | % | ± | |
---|---|---|---|---|---|
Conservative | Derek Prodger | 1,313 | |||
Conservative | David Clark | 1,112 | |||
Conservative | Barry Mackenzie-Williams | 935 | |||
Liberal Democrat | Vaughan Hencher | 690 | |||
Labour | Gary Kibblewhite | 689 | |||
BNP | Mark Heaton | 410 | |||
Turnout | 5,149 | 40 |
Party | Candidate | Votes | % | ± | |
---|---|---|---|---|---|
Conservative | Francis Lankester | 1,302 | |||
Conservative | Allah Ditta | 1,168 | |||
Conservative | Mohammed Riaz | 1,071 | |||
Labour | Ali Asghar | 780 | |||
Labour | Simon Cronin | 777 | |||
Labour | Patricia Agar | 771 | |||
Liberal Democrat | Iain Macbriar | 658 | |||
Turnout | 6,527 | 41 |
Party | Candidate | Votes | % | ± | |
---|---|---|---|---|---|
Liberal Democrat | Susan Askin | 1,709 | |||
Liberal Democrat | Ruth Smith | 1,581 | |||
Liberal Democrat | Alexander Kear | 1,399 | |||
Conservative | William Elsy | 1,228 | |||
Conservative | Nicola Lynas | 1,165 | |||
Conservative | Robert Campbell | 1,138 | |||
Labour | Clive Andrews | 535 | |||
Turnout | 8,755 | 51 |
Party | Candidate | Votes | % | ± | |
---|---|---|---|---|---|
Labour | Roger Berry | 709 | |||
Labour | Geoffrey Williams | 601 | |||
BNP | Martin Roberts | 461 | |||
Conservative | Gordon Hazelton | 321 | |||
Turnout | 2,092 | 34 |
Party | Candidate | Votes | % | ± | |
---|---|---|---|---|---|
Independent | Michael Layland | 1,233 | |||
Independent | Keith Burton | 951 | |||
Independent | Stanley Knowles | 747 | |||
Labour | Nicholas Balsdon | 701 | |||
Labour | Christopher Taylor | 604 | |||
Conservative | James Maguire | 482 | |||
Turnout | 4,718 | 37 |
Party | Candidate | Votes | % | ± | |
---|---|---|---|---|---|
Labour | Adrian Gregson | 641 | |||
Labour | Paul Denham | 570 | |||
Conservative | Nicholas Turner | 344 | |||
Conservative | Sajeeda Begum | 275 | |||
Turnout | 1,830 | 26 |
Party | Candidate | Votes | % | ± | |
---|---|---|---|---|---|
Conservative | Simon Geraghty | 940 | |||
Conservative | Ian Imray | 734 | |||
Labour | Allyson Craigan | 503 | |||
Independent | Brian Chadd | 435 | |||
Independent | Paul Coveney | 373 | |||
Turnout | 2,985 | 39 |
Party | Candidate | Votes | % | ± | |
---|---|---|---|---|---|
Independent | Margaret Layland | 914 | |||
Labour | David Candler | 822 | |||
Labour | Samuel Arnold | 795 | |||
Labour | Matthew Lamb | 764 | |||
Conservative | Alastair Little | 584 | |||
Conservative | Stephen Hall | 538 | |||
Turnout | 4,417 | 33 |
Party | Candidate | Votes | % | ± | |
---|---|---|---|---|---|
Conservative | Roger Knight | 1,047 | |||
Conservative | Frank Tarbuck | 790 | |||
Labour | Reginald Price | 423 | |||
Turnout | 2,260 | 35 |
Party | Candidate | Votes | % | ± | |
---|---|---|---|---|---|
Conservative | Stephen Inamn | 832 | |||
Conservative | Gareth Jones | 816 | |||
Liberal Democrat | Hilary Craig | 349 | |||
Liberal Democrat | Celia Foulger | 323 | |||
Labour | George Squires | 311 | |||
Turnout | 2,631 | 37 |
Party | Candidate | Votes | % | ± | |
---|---|---|---|---|---|
Labour | Pamela Clayton | 670 | |||
Labour | Josephine Hodges | 586 | |||
Conservative | Colin Bruton | 307 | |||
Conservative | Martin Hudson | 281 | |||
Turnout | 1,844 | 26 |
Party | Candidate | Votes | % | ± | |
---|---|---|---|---|---|
Conservative | Martin Clarke | 667 | |||
Conservative | Stephen Hudgson | 592 | |||
Labour | John Buckley | 518 | |||
Liberal Democrat | Edward Hartley | 311 | |||
Labour | Colin Layland | 292 | |||
Turnout | 2,380 | 34 |
Party | Candidate | Votes | % | ± | |
---|---|---|---|---|---|
Conservative | Lucy Hodgson | 933 | |||
Conservative | Rodney Staines | 895 | |||
Labour | Richard Udall | 372 | |||
Turnout | 2,200 | 34 |
Bromsgrove District Council in Worcestershire, England is elected every four years. The elections take place on the first Thursday of May and elect 39 councillors from 23 wards. By-elections are held for any seats which become vacant between the four yearly elections.
The 2002 Redditch Borough Council election of 2 May 2002 elected members of Redditch Borough Council in the West Midlands region, England. One third of the council stood for re-election and the Labour party lost overall control of the council to no overall control for the first time in many years.
The 2003 Gateshead Council election was held on 10 June 2004 to elect members of Gateshead Council in Tyne and Wear, England. The whole council was up for election with boundary changes since the last election in 2003. The Labour party stayed in overall control of the council.
The 2002 Wyre Forest District Council election took place on 2 May 2002 to elect members of Wyre Forest District Council in Worcestershire, England. One third of the council was up for election and the Independent Kidderminster Hospital and Health Concern party gained overall control of the council from no overall control.
The 2003 Wyre Forest District Council election took place on 1 May 2003 to elect members of Wyre Forest District Council in Worcestershire, England. One third of the council was up for election and the council stayed under no overall control.
The 2004 Wyre Forest District Council election took place on 10 June 2004 to elect members of Wyre Forest District Council in Worcestershire, England. The whole council was up for election with boundary changes since the last election in 2003. The council stayed under no overall control, but with the Conservatives taking over as the largest party on the council from the Health Concern party.
The 2006 Wyre Forest District Council election took place on 4 May 2006 to elect members of Wyre Forest District Council in Worcestershire, England. One third of the council was up for election and the council stayed under no overall control.
The 2007 Wyre Forest District Council election took place on 3 May 2007 to elect members of Wyre Forest District Council in Worcestershire, England. One third of the council was up for election and the council stayed under no overall control.
The 2008 Wyre Forest District Council election took place on 1 May 2008 to elect members of Wyre Forest District Council in Worcestershire, England. One third of the council was up for election and the Conservative party gained overall control of the council from no overall control.
The 1998 Worcester City Council election took place on 7 May 1998 to elect members of Worcester District Council in Worcestershire, England. One third of the council was up for election and the Labour party stayed in overall control of the council.
The 2000 Worcester City Council election took place on 4 May 2000 to elect members of Worcester District Council in Worcestershire, England. One third of the council was up for election and the Labour party lost overall control of the council to no overall control.
The 2002 Worcester City Council election took place on 2 May 2002 to elect members of Worcester District Council in Worcestershire, England. One third of the council was up for election and the council stayed under no overall control.
The 2003 Worcester City Council election took place on 1 May 2003 to elect members of Worcester District Council in Worcestershire, England. One third of the council was up for election and the Conservative party gained overall control of the council from no overall control.
The 2006 Worcester City Council election took place on 4 May 2006 to elect members of Worcester District Council in Worcestershire, England. One third of the council was up for election and the Conservative party stayed in overall control of the council.
The 2007 Worcester City Council election took place on 3 May 2007 to elect members of Worcester District Council in Worcestershire, England. One third of the council was up for election and the Conservative party stayed in overall control of the council.
The 2008 Worcester City Council election took place on 1 May 2008 to elect members of Worcester District Council in Worcestershire, England. One third of the council was up for election and the council stayed under no overall control.
The 2004 South Tyneside Metropolitan Borough Council election took place on 10 June 2004 to elect members of South Tyneside Metropolitan Borough Council in Tyne and Wear, England. The whole council was up for election with boundary changes since the last election in 2003 reducing the number of seats by 6. The Labour party stayed in overall control of the council.
The 1999 Solihull Metropolitan Borough Council election took place on 6 May 1999 to elect members of Solihull Metropolitan Borough Council in the West Midlands, England. One third of the council was up for election and the council stayed under no overall control.
The 2004 Solihull Metropolitan Borough Council election took place on 10 June 2004 to elect members of Solihull Metropolitan Borough Council in the West Midlands, England. The whole council was up for election with boundary changes since the last election in 2003. The Conservative party stayed in overall control of the council.
The 2006 Solihull Metropolitan Borough Council election took place on 4 May 2006 to elect members of Solihull Metropolitan Borough Council in the West Midlands, England. One third of the council was up for election and the Conservative party stayed in overall control of the council.