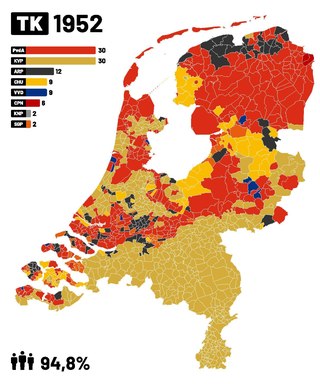
General elections were held in the Netherlands on 25 June 1952. The Catholic People's Party and the Labour Party both won 30 of the 100 seats in the House of Representatives. It was the first time since 1913 that the Catholic People's Party and its predecessors had not received a plurality of the vote.
The Greens of Andorra is a green political party in Andorra.

Federal elections were held in Germany on 21 February 1887. The National Liberal Party became the largest party in the Reichstag by winning 98 of the 397 seats, whilst the Centre Party, formerly the largest party, was reduced to 98 seats. Voter turnout was 77.5%.

Federal elections were held in Germany on 28 October 1884. The Centre Party remained the largest party in the Reichstag, with 99 of the 397 seats. Voter turnout was 60.5%.

Federal elections were held in Germany on 27 October 1881. The Centre Party became the largest party in the Reichstag, with 100 of the 397 seats, whilst the National Liberal Party, which had previously been the largest party, was reduced to 45 seats. Voter turnout was 56.3%.

Federal elections were held in Germany on 30 July 1878. The National Liberal Party remained the largest party in the Reichstag with 97 of the 397 seats, despite the Centre Party receiving more votes. Voter turnout was 63.4%.
The Democratic Party is a centre-right political party in Bulgaria led by Alexander Pramatarski. The party was a member of the European People's Party (EPP).

Federal elections were held in Germany on 16 June 1903. Despite the Social Democratic Party (SPD) receiving a clear plurality of votes, the Centre Party remained the largest party in the Reichstag after winning 100 of the 397 seats, whilst the SPD won only 81. Voter turnout was 76.1%.

General elections were held in Sweden on 20 September 1964. The Swedish Social Democratic Party remained the largest party, winning 113 of the 233 seats in the Andra kammaren of the Riksdag. Tage Erlander's Social Democratic government was returned to power.

Folketing elections were held in Denmark on 28 October 1947, except in the Faroe Islands where they were held on 18 February 1948. The Social Democratic Party remained the largest in the Folketing, with 57 of the 150 seats. Voter turnout was 86% in Denmark proper and 60% in the Faroes.

Parliamentary elections were held in Russia on 12 December 1993. They were the first parliamentary elections in post-Soviet Russia and the only time to the Federation Council, with future members appointed by provincial legislatures and governors.
Parliamentary elections were held in Iceland on 25 April 1987. The Independence Party remained the largest party in the Lower House of the Althing, winning 12 of the 42 seats.

General elections were held in Belgium on 26 March 1961. The result was a victory for the Christian Social Party, which won 96 of the 212 seats in the Chamber of Representatives and 47 of the 106 seats in the Senate. Voter turnout was 92.3%. Elections for the nine provincial councils were also held.
Federal elections were held in Switzerland on 23 October 1983. The Free Democratic Party emerged as the largest party in the National Council, winning 54 of the 200 seats. It was the first time the Social Democratic Party had not received the most votes in a federal election since 1925.
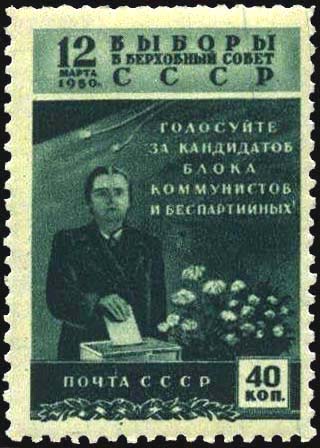
Supreme Soviet elections were held in the Soviet Union on 12 March 1950.

General elections were held in Portugal on 28 April 1918, following a coup by Sidónio Pais in December 1917. The elections were boycotted by the Democratic Party, the Evolutionist Party and the Republican Union, who had won over 90% of the seats in the 1915 elections.

Parliamentary elections were held in Portugal on 16 December 1934, the first following the establishment of the one-party state known as the Estado Novo. The National Union was the only party to contest the elections, and no opposition candidates were allowed to run. It subsequently won all seats in the National Assembly, three of which were taken by women.
Parliamentary elections were held in Portugal on 30 October 1938. The country was a one-party state at the time and the National Union was the only party to contest the elections, with no opposition candidates allowed to run.
Parliamentary elections were held in Portugal on 1 November 1942. The country was a one-party state at the time and the National Union was the only party to contest the elections, with no opposition candidates allowed to run.

The People's Party was a political party in Bulgaria between 1894 and 1920.