1976 Portuguese local elections

Last updated

1976 Portuguese local elections
Flag of Portugal (official).svg
12 December 1976 1979  

All 304 Portuguese municipalities and 4,260 Portuguese Parishes
All 1,908 local government councils
Turnout64.7%
 First partySecond party
 
Mario Soares 1975b (cropped).jpg
Francisco Sa Carneiro.jpg
Leader Mário Soares Francisco Sá Carneiro
Party PS PSD
Popular vote1,377,6841,014,092
Percentage33.0%24.3%
Mayors115115
Councillors691624

 Third partyFourth party
 
Alvaro Cunhal 1980 (cropped).jpg
Professor Doutor Diogo Freitas do Amaral.png
Leader Álvaro Cunhal Diogo Freitas do Amaral
Party PCP CDS
Alliance FEPU
Popular vote720,499693,766
Percentage17.3%16.6%
Mayors3736
Councillors268317

Local elections were held in Portugal on Sunday, 12 December 1976. [1] They were the first local elections in Portugal. The democratic revolution of 1974 introduced the concept of democratic local power, that should be exerted by the citizens in their towns and cities. These elections ended a cycle of three elections in 1976, after the 1976 legislative election in April [2] and the 1976 Presidential election in June. [3]

Contents

The elections were meant to elect for the first time the administration of the about 300 municipalities of the country and of the about 4000 parishes that composed those 300 municipalities. They consisted of three elections in each of the municipalities; the election for the municipal chamber, the election for the municipal assembly and the lower-level election for the parish assembly, whose winner is also automatically elected as President. [4]

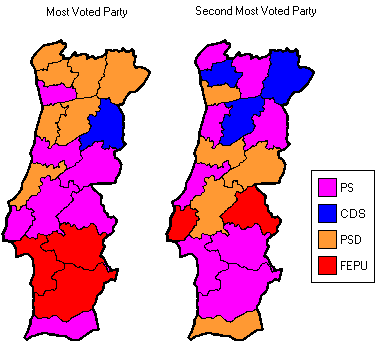
The Socialist Party gathered the majority of the voting and mandates, beating the Social Democratic Party, although both parties tied in number of elected mayors, 115. The Communists led coalition, the Electoral Front United People, dominated the election in the South of the country, with more than 17 percent of the votes and elected 37 mayors. The right-wing Democratic Social Center, following their strong showing in the 1976 April legislative election, achieved its best result ever in local elections, almost 17 percent of the votes and 36 mayors. [5]

Turnout in these elections was quite low, as 64.7% of the electorate cast a ballot, compared with the 83.5% turnout rate of the 1976 general elections in April.

Electoral system

All 304 municipalities are allocated a certain number of councilors to elect corresponding to the number of registered voters in a given municipality. Each party or coalition must present a list of candidates. The winner of the most voted list for the municipal council is automatically elected mayor, similar to first-past-the-post (FPTP). The lists are closed and the seats in each municipality are apportioned according to the D'Hondt method. [6]

Parties

The main political forces involved in the election:

Results

Municipal Councils

National summary of votes and seats

Summary of the 12 December 1976 Municipal Councils elections results
PartiesVotes%CandidaciesCouncillorsMayors
TotalTotal
Socialist 1,377,68433.01691115
Social Democratic 1,014,09224.30624115
Electoral Front United People 720,49917.2626837
Democratic and Social Centre 693,76616.6231736
GDUPs 103,7842.4950
Portuguese Workers' Communist 27,5050.5900
PCP(m-l) 15,2670.3700
People's Monarchist 7,5280.1831
Internationalist Communist League 3,4640.0800
Workers' Revolutionary 2730.0000
United People Alliance 1230.0000
Total valid3,995,90595.741,908304
Blank ballots89,0732.13
Invalid ballots88,7832.13
Total4,173,761100.00
Registered voters/turnout6,454,99064.66

Municipality map

Most voted parties or coalitions in each Municipality.
Municipalities won by:
# - PS: 115
# - PSD: 115
# - FEPU: 37
# - CDS: 36
# - PPM: 1 Autarquicas portuguesas de 1976 (Mapa).png
Most voted parties or coalitions in each Municipality.
Municipalities won by:
- PS: 115
- PSD: 115
- FEPU: 37
- CDS: 36
- PPM: 1

City control

The following table lists party control in all district capitals, highlighted in bold, as well as in municipalities above 100,000 inhabitants. Population estimates from the 1970 Census. [7]

MunicipalityPopulationNew control
Almada 107,575 Electoral Front United People (FEPU)
Aveiro 49,808 Democratic and Social Centre (CDS)
Beja 36,384 Electoral Front United People (FEPU)
Braga 96,918 Socialist Party (PS)
Bragança 33,070 Social Democratic Party (PSD)
Cascais 92,907 Socialist Party (PS)
Castelo Branco 55,195 Socialist Party (PS)
Coimbra 110,553 Socialist Party (PS)
Évora 47,244 Electoral Front United People (FEPU)
Faro 30,973 Socialist Party (PS)
Funchal 101,810 Social Democratic Party (PSD)
Gondomar 105,075 Socialist Party (PS)
Guarda 39,741 Socialist Party (PS)
Guimarães 122,719 Socialist Party (PS)
Leiria 80,241 Social Democratic Party (PSD)
Lisbon 769,044 Socialist Party (PS)
Loures 166,167 Socialist Party (PS)
Matosinhos 109,225 Socialist Party (PS)
Oeiras 180,194 Socialist Party (PS)
Ponta Delgada 67,975 Social Democratic Party (PSD)
Portalegre 25,800 Socialist Party (PS)
Porto 301,655 Socialist Party (PS)
Santarém 56,440 Socialist Party (PS)
Setúbal 65,230 Socialist Party (PS)
Sintra 124,893 Socialist Party (PS)
Viana do Castelo 70,455 Social Democratic Party (PSD)
Vila Nova de Gaia 180,875 Socialist Party (PS)
Vila Real 44,550 Social Democratic Party (PSD)
Viseu 73,010 Democratic and Social Centre (CDS)

Municipal Assemblies

National summary of votes and seats

Summary of the 12 December 1976 Municipal Assemblies elections results
PartiesVotes%CandidaciesMandates
Total
Socialist 1,392,18133.391,698
Social Democratic 1,022,16824.521,658
Electoral Front United People 756,85618.15679
Democratic and Social Centre 685,57416.441,053
GDUPs 100,8722.4243
PCP(m-l) 5,3630.132
Portuguese Workers' Communist 5,2140.130
People's Monarchist 3,6950.092
Workers' Revolutionary 2,6340.060
Christian Democratic 9700.020
Total valid3,975,59695.245,135
Blank ballots104,1852.50
Invalid ballots89,2412.26
Total4,169,022100.00
Registered voters/turnout6,453,78364.60

Parish Assemblies

National summary of votes and seats

Summary of the 12 December 1976 Parish Assemblies elections results
PartiesVotes%CandidaciesMandatesPresidents
TotalTotal
Socialist 1,339,46032.698,345
Social Democratic 996,97224.339,076
Electoral Front United People 629,81215.372,291
Democratic and Social Centre 617,69015.075,077
Independents162,3673.961,230
GDUPs 93,9672.2999
Portuguese Workers' Communist 13,7210.332
People's Monarchist 1,7880.0412
PCP(m-l) 1,6660.043
Internationalist Communist League 710.000
Total valid3,915,12095.5526,135
Blank ballots88,9852.17
Invalid ballots93,4612.28
Total4,097,566100.00
Registered voters/turnout6,246,59465.60

Maps

Notes

Further Notes:

See also

References

  1. "Primeiras Eleições Autárquicas". RTP Arquivos. 12 December 2016. Retrieved 15 June 2025.
  2. "Especial Eleições – Parte I". RTP Arquivos. 25 April 1976. Retrieved 15 June 2025.
  3. "Presidenciais 76 – Parte I". RTP Arquivos. 27 June 1976. Retrieved 15 June 2025.
  4. "Decreto-Lei n.º 701-B/76, de 29 de setembro". Diário da República. 29 September 1976. Retrieved 15 June 2025.
  5. "Autárquicas: conta-me como foi este poder local quarentão". TVI Notícias. 1 October 2017. Retrieved 15 June 2025.
  6. Eleição dos titulares dos órgãos das autarquias locais. Diário da República (in Portuguese.) Retrieved 17 July 2025.
  7. "Instituto Nacional de Estatística (Recenseamentos Gerais da População)". www.ine.pt (in Portuguese). Statistics Portugal . Retrieved 17 July 2021.