1979 Portuguese local elections

Last updated

1979 Portuguese local elections
Flag of Portugal (official).svg
  1976 16 December 1979 1982  

All 305 Portuguese municipalities and 4,260 Portuguese Parishes
All 1,900 local government councils
Turnout71.7% Increase2.svg 7.0 pp
 First partySecond partyThird party
 
Francisco Sa Carneiro.jpg
Mario Soares 1975b (cropped).jpg
Alvaro Cunhal 1980 (cropped).jpg
Leader Francisco Sá Carneiro Mário Soares Álvaro Cunhal
Party PSD PS PCP
Alliance AD APU
Last election152 mayors, 41.1%115 mayors, 33.0%37 mayors, 17.3%
Popular vote2,109,072 [1] 1,258,966885,899
Percentage47.5%28.3%19.9%
SwingIncrease2.svg 6.4 pp Decrease2.svg 4.7 pp Increase2.svg 2.6 pp
Mayors195 [2] 6050
Mayors +/–Increase2.svg 43Decrease2.svg 55Increase2.svg 13
Councillors1,063 [3] 516316
Councillors +/–Increase2.svg 119Decrease2.svg 175Increase2.svg 48

Local elections were held in Portugal on 16 December 1979. They were the 2nd local elections in Portugal since the democratic revolution of 1974 introduced the concept of democratic local power. The elections took place just two weeks after the 1979 legislative election.

Contents

The elections consisted of three separate elections in the 305 Portuguese municipalities, the election for the Municipal Chambers, another election for the Municipal Assembly and a last one for the lower-level Parish Assembly, whose winner is elected parish president, this last was held separately in the more than 4,000 parishes around the country.

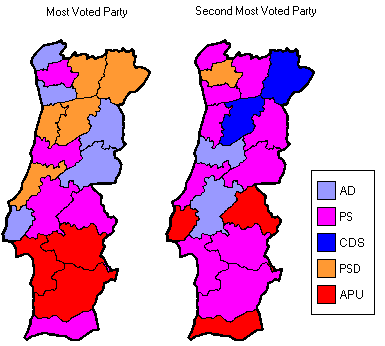
The Socialist Party finished on the top of the results table, however that was because the coalition between the two major right-wing parties, the Democratic and Social Center and the Social Democratic Party, the Democratic Alliance, did not participated in all Municipalities and Parishes, being the parties which composed it, separated in many Municipalities

The left-wing United People Alliance dominated the election in the municipalities of the South of the country, gathering more than 60 percent of the votes.

Turnout in these elections increased compared with the 1976 election, as 71.7 percent of the electorate cast a ballot, the highest turnout recorded in a nationwide local election.

Electoral system

All 305 municipalities are allocated a certain number of councilors to elect corresponding to the number of registered voters in a given municipality. Each party or coalition must present a list of candidates. The winner of the most voted list for the municipal council is automatically elected mayor, similar to first-past-the-post (FPTP). The lists are closed and the seats in each municipality are apportioned according to the D'Hondt method. [4]

Parties

The main political forces involved in the election were:

Results

Municipal Councils

National summary of votes and seats

Summary of the 16 December 1979 Municipal Councils elections results
PartiesVotes%±pp swing CandidaciesCouncillorsMayors
Total±Total±
Socialist 1,258,96628.33Decrease2.svg4.7297516Decrease2.svg17560Decrease2.svg55
Democratic Alliance 1,044,64223.5113842673
United People Alliance [A] 885,89919.94Increase2.svg2.6295316Increase2.svg4850Increase2.svg13
Social Democratic 723,95316.29Decrease2.svg8.0156475Decrease2.svg149101Decrease2.svg14
Democratic and Social Centre 334,2587.52Decrease2.svg9.1102156Decrease2.svg16120Decrease2.svg16
People's Democratic Union 53,0761.199530
Portuguese Workers' Communist 19,5080.44Decrease2.svg0.2630Steady2.svg00Steady2.svg0
Christian Democratic 6,6310.15920
People's Monarchist 6,2190.14Decrease2.svg0.136Increase2.svg31Steady2.svg0
UEDS 1,8820.04700
Workers Party of Socialist Unity 2730.01200
Total valid4,271,89797.56Increase2.svg1.81,900Decrease2.svg8305Increase2.svg1
Blank ballots44,6931.01Decrease2.svg1.1
Invalid ballots63,6791.43Decrease2.svg0.7
Total4,380,269100.00
Registered voters/turnout6,105,65171.74Increase2.svg7.1
A In 1976, as Electoral Front United People.

Municipality map

Most voted parties or coalitions in each Municipality.
Municipalities won by:
# - PS: 60
# - AD: 73
# - APU: 50
# - PSD: 101
# - CDS: 20
# - PPM: 1 Autarquicas portuguesas de 1979 (Mapa Camara).png
Most voted parties or coalitions in each Municipality.
Municipalities won by:
- PS: 60
- AD: 73
- APU: 50
- PSD: 101
- CDS: 20
- PPM: 1

City control

The following table lists party control in all district capitals, highlighted in bold, as well as in municipalities above 100,000 inhabitants. Population estimates from the 1970 Census. [5]

MunicipalityPopulationPrevious controlNew control
Almada 107,575 United People Alliance (APU) United People Alliance (APU)
Amadora 111,929Municipality created United People Alliance (APU)
Aveiro 49,808 Democratic and Social Centre (CDS) Democratic and Social Centre (CDS)
Beja 36,384 United People Alliance (APU) United People Alliance (APU)
Braga 96,918 Socialist Party (PS) Socialist Party (PS)
Bragança 33,070 Social Democratic Party (PSD) Social Democratic Party (PSD)
Cascais 92,907 Socialist Party (PS) Democratic and Social Centre (CDS)
Castelo Branco 55,195 Socialist Party (PS) Democratic Alliance (AD)
Coimbra 110,553 Socialist Party (PS) Democratic Alliance (AD)
Évora 47,244 United People Alliance (APU) United People Alliance (APU)
Faro 30,973 Socialist Party (PS) Democratic Alliance (AD)
Funchal 101,810 Social Democratic Party (PSD) Social Democratic Party (PSD)
Gondomar 105,075 Socialist Party (PS) Democratic Alliance (AD)
Guarda 39,741 Socialist Party (PS) Socialist Party (PS)
Guimarães 122,719 Socialist Party (PS) Democratic Alliance (AD)
Leiria 80,241 Social Democratic Party (PSD) Social Democratic Party (PSD)
Lisbon 769,044 Socialist Party (PS) Democratic Alliance (AD)
Loures 166,167 Socialist Party (PS) United People Alliance (APU)
Matosinhos 109,225 Socialist Party (PS) Socialist Party (PS)
Oeiras 180,194 Socialist Party (PS) Democratic Alliance (AD)
Ponta Delgada 67,975 Social Democratic Party (PSD) Social Democratic Party (PSD)
Portalegre 25,800 Socialist Party (PS) Democratic Alliance (AD)
Porto 301,655 Socialist Party (PS) Democratic Alliance (AD)
Santarém 56,440 Socialist Party (PS) Socialist Party (PS)
Setúbal 65,230 Socialist Party (PS) United People Alliance (APU)
Sintra 124,893 Socialist Party (PS) Democratic Alliance (AD)
Viana do Castelo 70,455 Social Democratic Party (PSD) Democratic Alliance (AD)
Vila Nova de Gaia 180,875 Socialist Party (PS) Democratic Alliance (AD)
Vila Real 44,550 Social Democratic Party (PSD) Social Democratic Party (PSD)
Viseu 73,010 Democratic and Social Centre (CDS) Democratic and Social Centre (CDS)

Municipal Assemblies

National summary of votes and seats

Summary of the 16 December 1979 Municipal Assemblies elections results
PartiesVotes%±pp swing CandidaciesMandates
Total±
Socialist 1,245,30627.86Decrease2.svg5.52,686Increase2.svg988
Democratic Alliance 1,056,65623.642,122
United People Alliance [A] 916,99020.51Increase2.svg2.41,746Increase2.svg1,067
Social Democratic 747,91116.73Decrease2.svg7.82,230Increase2.svg572
Democratic and Social Centre 308,7216.91Decrease2.svg9.5832Decrease2.svg221
People's Democratic Union 55,7941.2558
Portuguese Workers' Communist 10,7830.24Increase2.svg0.10Steady2.svg0
People's Monarchist 5,5780.12Increase2.svg0.026Increase2.svg24
UEDS 5960.013
Christian Democratic 4170.00Decrease2.svg0.00Steady2.svg0
Total valid4,266,01397.28Increase2.svg2.19,703Increase2.svg4,568
Blank ballots59,5641.33Decrease2.svg1.2
Invalid ballots62,2411.39Decrease2.svg0.9
Total4,387,818100.00
Registered voters/turnout6,105,64771.86Increase2.svg7.3
A In 1976, as Electoral Front United People.

Parish Assemblies

National summary of votes and seats

Summary of the 16 December 1979 Parish Assemblies elections results
PartiesVotes%±pp swing CandidaciesMandatesPresidents
Total±Total±
Socialist 1,219,29827.77Decrease2.svg4.910,613Increase2.svg2,268
Democratic Alliance 1,000,70222.799,785
United People Alliance [A] 898,67020.47Increase2.svg5.14,732Increase2.svg2,441
Social Democratic 736,95416.78Decrease2.svg7.69,447Increase2.svg371
Democratic and Social Centre 306,3326.98Decrease2.svg8.14,661Decrease2.svg416
Independents49,2071.12Decrease2.svg2.9707Decrease2.svg523
People's Democratic Union 41,4140.9455
Portuguese Workers' Communist 6,0100.14Decrease2.svg0.23Increase2.svg1
People's Monarchist 5,0060.12Increase2.svg0.178Increase2.svg66
Christian Democratic 2,5940.0626
Workers Party of Socialist Unity 6950.021
UEDS 6000.012
Total valid4,141,98197.19Increase2.svg1.640,110
Blank ballots54,7041.25Decrease2.svg0.9
Invalid ballots68,5021.56Decrease2.svg0.7
Total4,265,187100.00
Registered voters/turnout6,031,26670.72Increase2.svg5.1
A In 1976, as Electoral Front United People.

Maps

Notes

Further Notes:

See also

References

  1. Sum of PSD, AD, CDS and PPM votes.
  2. Sum of PSD, AD, CDS and PPM elected mayors.
  3. Sum of PSD, AD, CDS and PPM elected councillors.
  4. Eleição dos titulares dos órgãos das autarquias locais. Diário da República (in Portuguese.) Retrieved 17 July 2025.
  5. "Instituto Nacional de Estatística (Recenseamentos Gerais da População)". www.ine.pt (in Portuguese). Statistics Portugal . Retrieved 17 July 2021.