1982 Portuguese local elections

Last updated

1982 Portuguese local elections
Flag of Portugal (official).svg
  1979 12 December 1982 1985  

All 305 Portuguese municipalities and 4,260 Portuguese Parishes
All 1,909 local government councils
Turnout71.1% Decrease2.svg 0.6 pp
 First partySecond partyThird party
 
Dries van Agt en Francisco Jose Pereira Pinto Balsemao (1982) (cropped).jpg
Mario Soares 1975b (cropped).jpg
Alvaro Cunhal 1980 (cropped).jpg
Leader Francisco Pinto Balsemão Mário Soares Álvaro Cunhal
Party PSD PS PCP
Alliance AD APU
Last election195 mayors, 47.5%60 mayors, 28.3%50 mayors, 19.9%
Popular vote2,117,647 [1] 1,578,915 [2] 1,038,033
Percentage42.7%31.8%20.9%
SwingDecrease2.svg 4.8 pp Increase2.svg 3.5 pp Increase2.svg 1.0 pp
Mayors165 [3] 84 [4] 55
Mayors +/–Decrease2.svg 30Increase2.svg 24Increase2.svg 5
Councillors953 [5] 630 [6] 316
Councillors +/–Decrease2.svg 110Increase2.svg 114Steady2.svg 0

Local elections were held in Portugal on 12 December 1982. They were the third local elections in Portugal since the democratic revolution of 1974 introduced the concept of democratic local power.

Contents

The elections consisted of three separate elections in the 305 Portuguese municipalities that existed at the time, the election for the Municipal Chambers, another election for the Municipal Assembly and a last one for the lower-level Parish Assembly, whose winner is elected parish president, this last was held separately in the more than 4,000 parishes around the country.

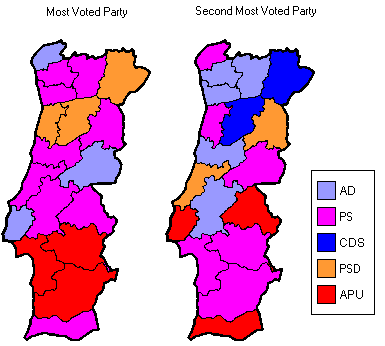
The Socialist Party finished once more on the top of the results table, increasing its share by 4 points, however that was because the coalition between the two major right-wing parties, the Democratic and Social Center and the Social Democratic Party, the Democratic Alliance, did not participate in all Municipalities and Parishes, being the parties which composed it, separated in many Municipalities. This right wing coalition did, however, lose some voting in relation to the previous election.

The left-wing United People Alliance dominated the election in the municipalities of the South of the country, gathering more than 60 percent of the votes and achieving its best result ever with 20.7 percent and 55 mayors.

Despite the victory of the Democratic Alliance, the then PSD leader and Prime Minister Francisco Pinto Balsemão considered the results a disappointment, citing divisions with his own party and the alliance, and resigned from both posts. [7] This decision led to a snap general election in April 1983.

Electoral system

All 305 municipalities are allocated a certain number of councilors to elect corresponding to the number of registered voters in a given municipality. Each party or coalition must present a list of candidates. The winner of the most voted list for the municipal council is automatically elected mayor, similar to first-past-the-post (FPTP). The lists are closed and the seats in each municipality are apportioned according to the D'Hondt method. [8]

Parties

The main political forces involved in the election were:

Results

Municipal Councils

National summary of votes and seats

Summary of the 12 December 1982 Municipal Councils elections results
PartiesVotes%±pp swing CandidaciesCouncillorsMayors
Total±Total±
Socialist 1,547,66431.18Increase2.svg2.9619Increase2.svg10383Increase2.svg23
United People Alliance 1,038,03320.91Increase2.svg1.0316Steady2.svg055Increase2.svg5
Democratic Alliance 988,34719.91Decrease2.svg3.6322Decrease2.svg10449Decrease2.svg24
Social Democratic 745,04815.01Decrease2.svg1.3439Decrease2.svg3688Decrease2.svg13
Democratic and Social Centre 369,2637.44Decrease2.svg0.1185Increase2.svg2927Increase2.svg7
People's Democratic Union 31,5670.64Decrease2.svg0.63Steady2.svg00Steady2.svg0
Socialist / UEDS 31,2510.63111
Portuguese Workers' Communist 15,3150.31Decrease2.svg0.10Steady2.svg00Steady2.svg0
People's Monarchist 11,1490.22Increase2.svg0.15Decrease2.svg11Steady2.svg0
Workers Party of Socialist Unity 5,6840.11Increase2.svg0.10Steady2.svg00Steady2.svg0
Independent Social Democratic Action 4,2360.0971
Democratic Union 3,8400.0820
OCMLP 1,3880.0300
Christian Democratic 8550.02Decrease2.svg0.20Steady2.svg00Steady2.svg0
Total valid4,785,58696.40Decrease2.svg1.21,909Increase2.svg9305Steady2.svg0
Blank ballots87,3811.76Increase2.svg0.8
Invalid ballots91,4031.84Increase2.svg0.4
Total4,964,370100.00
Registered voters/turnout6,987,10671.05Decrease2.svg0.7

Municipality map

Most voted parties or coalitions in each Municipality.
Municipalities won by:
# - PS: 84
# - APU: 55
# - AD: 49
# - PSD: 88
# - CDS: 27
# - PPM: 1
# - ASDI: 1 Autarquicas portuguesas de 1982 (Mapa Camara).png
Most voted parties or coalitions in each Municipality.
Municipalities won by:
- PS: 84
- APU: 55
- AD: 49
- PSD: 88
- CDS: 27
- PPM: 1
- ASDI: 1

City control

The following table lists party control in all district capitals, highlighted in bold, as well as in municipalities above 100,000 inhabitants. Population estimates from the 1981 Census. [9]

MunicipalityPopulationPrevious controlNew control
Almada 147,690 United People Alliance (APU) United People Alliance (APU)
Amadora 163,878 United People Alliance (APU) United People Alliance (APU)
Aveiro 60,284 Democratic and Social Centre (CDS) Democratic and Social Centre (CDS)
Barcelos 103,773 Social Democratic Party (PSD) Social Democratic Party (PSD)
Beja 38,246 United People Alliance (APU) United People Alliance (APU)
Braga 125,472 Socialist Party (PS) Socialist Party (PS)
Bragança 35,380 Social Democratic Party (PSD) Democratic and Social Centre (CDS)
Cascais 141,498 Democratic and Social Centre (CDS) Social Democratic Party (PSD)
Castelo Branco 54,908 Democratic Alliance (AD) Democratic Alliance (AD)
Coimbra 138,930 Democratic Alliance (AD) Socialist Party (PS)
Évora 51,572 United People Alliance (APU) United People Alliance (APU)
Faro 45,109 Democratic Alliance (AD) Democratic Alliance (AD)
Funchal 112,746 Social Democratic Party (PSD) Social Democratic Party (PSD)
Gondomar 130,751 Democratic Alliance (AD) Socialist Party (PS)
Guarda 40,360 Socialist Party (PS) Socialist Party (PS)
Guimarães 146,959 Democratic Alliance (AD) Socialist Party (PS)
Leiria 96,517 Social Democratic Party (PSD) Democratic and Social Centre (CDS)
Lisbon 807,937 Democratic Alliance (AD) Democratic Alliance (AD)
Loures 276,467 United People Alliance (APU) United People Alliance (APU)
Matosinhos 136,498 Socialist Party (PS) Socialist Party (PS)
Oeiras 149,328 Democratic Alliance (AD) Democratic Alliance (AD)
Ponta Delgada 63,804 Social Democratic Party (PSD) Social Democratic Party (PSD)
Portalegre 27,313 Democratic Alliance (AD) Socialist Party (PS)
Porto 327,368 Democratic Alliance (AD) Democratic Alliance (AD)
Santarém 62,896 Socialist Party (PS) Socialist Party (PS)
Santa Maria da Feira 109,531 Social Democratic Party (PSD) Democratic Alliance (AD)
Setúbal 98,366 United People Alliance (APU) United People Alliance (APU)
Sintra 226,428 Democratic Alliance (AD) Democratic Alliance (AD)
Viana do Castelo 81,009 Democratic Alliance (AD) Democratic Alliance (AD)
Vila Nova de Famalicão 106,508 Democratic Alliance (AD) Socialist Party (PS)
Vila Nova de Gaia 226,331 Democratic Alliance (AD) Socialist Party (PS)
Vila Real 47,020 Social Democratic Party (PSD) Democratic Alliance (AD)
Viseu 83,261 Democratic and Social Centre (CDS) Social Democratic Party (PSD)

Municipal Assemblies

National summary of votes and seats

Summary of the 12 December 1982 Municipal Assemblies elections results
PartiesVotes%±pp swing CandidaciesMandates
Total±
Socialist 1,583,80431.23Increase2.svg3.33,182Increase2.svg496
United People Alliance 1,070,24721.10Increase2.svg0.61,763Increase2.svg17
Democratic Alliance 990,31519.53Decrease2.svg4.11,625Decrease2.svg497
Social Democratic 717,13114.14Decrease2.svg2.62,148Decrease2.svg82
Democratic and Social Centre 379,8337.49Increase2.svg0.61,003Increase2.svg171
People's Democratic Union 35,1280.70Decrease2.svg0.621Decrease2.svg37
Socialist / UEDS 31,4810.63Increase2.svg0.652
Democratic Union 30,7070.6140
People's Monarchist 10,3140.21Increase2.svg0.128Increase2.svg2
Portuguese Workers' Communist 7,1200.14Increase2.svg0.11Increase2.svg1
Independent Social Democratic Action 3,8580.0832
Workers Party of Socialist Unity 2,4990.050
Christian Democratic 8470.02Increase2.svg0.02Increase2.svg2
OCMLP 5260.010
Total valid4,865,02795.93Decrease2.svg1.49,897Increase2.svg194
Blank ballots115,3522.27Increase2.svg1.0
Invalid ballots91,1281.80Increase2.svg0.4
Total5,071,507100.00
Registered voters/turnout7,114,98371.28Decrease2.svg0.6

Parish Assemblies

National summary of votes and seats

Summary of the 12 December 1982 Parish Assemblies elections results
PartiesVotes%±pp swing CandidaciesMandatesPresidents
Total±Total±
Socialist 1,527,32231.03Increase2.svg3.212,803Increase2.svg2,190
United People Alliance 1,071,83121.76Increase2.svg1.34,997Increase2.svg265
Democratic Alliance 905,69618.40Decrease2.svg4.47,684Decrease2.svg2,101
Social Democratic 760,84715.46Decrease2.svg1.39,499Increase2.svg52
Democratic and Social Centre 381,1507.74Increase2.svg0.74,837Increase2.svg176
Independents65,8651.34Increase2.svg0.21,038Increase2.svg331
Democratic Union 29,2840.59342
Socialist / UEDS 25,2650.51258
People's Democratic Union 24,7990.50Decrease2.svg0.430Decrease2.svg25
People's Monarchist 6,2610.13Increase2.svg0.099Increase2.svg21
Portuguese Workers' Communist 5,0230.10Decrease2.svg0.00Decrease2.svg3
Independent Social Democratic Action 2,7680.0649
Workers Party of Socialist Unity 8560.02Steady2.svg0.00Decrease2.svg1
Christian Democratic 4820.00Decrease2.svg0.10Decrease2.svg26
OCMLP 4440.000
Total valid4,738,91396.28Decrease2.svg0.941,636
Blank ballots87,9351.79Increase2.svg0.5
Invalid ballots95,3801.94Increase2.svg0.4
Total4,922,228100.00
Registered voters/turnout7,073,33669.59Decrease2.svg1.1

Maps

Notes

Further Notes:

See also

References

  1. Sum of PSD, CDS, PPM, AD and UD votes.
  2. Sum of PS and PS/UEDS votes.
  3. Sum of PSD, AD, CDS and PPM elected mayors.
  4. Sum of PS and PS/UEDS elected mayors.
  5. Sum of PSD, CDS, PPM, AD and UD elected councillors.
  6. Sum of PS and PS/UEDS elected councillors.
  7. "Demissão Pinto Balsemão", RTP-Antena1, 8 September 2015. Retrieved 14 December 2022.
  8. Eleição dos titulares dos órgãos das autarquias locais. Diário da República (in Portuguese.) Retrieved 17 July 2025.
  9. "Instituto Nacional de Estatística (Recenseamentos Gerais da População)". www.ine.pt (in Portuguese). Statistics Portugal . Retrieved 17 July 2021.