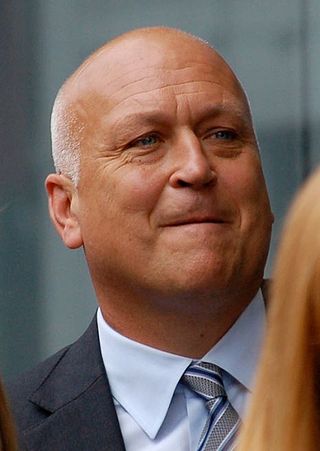
Calvin Edwin Ripken Jr., nicknamed "the Iron Man", is an American former baseball shortstop and third baseman who played his entire 21-season career in Major League Baseball (MLB) for the Baltimore Orioles (1981–2001). One of his position's most productive offensive players, Ripken compiled 3,184 hits, 431 home runs, and 1,695 runs batted in during his career, and he won two Gold Glove Awards for his defense. He was a 19-time All-Star and was twice named American League (AL) Most Valuable Player (MVP), in 1983 and 1991. Ripken holds the record for consecutive games played (2,632), having surpassed Lou Gehrig's streak of 2,130 which had stood for 56 years and which many deemed was unbreakable. In 2007, he was elected to the Baseball Hall of Fame in his first year of eligibility with 98.53% of votes, the sixth-highest election percentage ever to-date.
The 1983 World Series was the championship series of Major League Baseball's (MLB) 1983 season. The 80th edition of the World Series, it was a best-of-seven playoff played between the American League champion Baltimore Orioles and the National League champion Philadelphia Phillies. The Orioles won, four games to one to win their third title. "The I-95 Series", like the World Series two years later, also took its nickname from the interstate that the teams and fans traveled on, Interstate 95 in this case. This was the last World Series that Bowie Kuhn presided over as commissioner.

Calvin Edwin Ripken Sr. was an American baseball player, scout, coach and manager. who spent 36 years in the Baltimore Orioles organization. He played in the Orioles' farm system beginning in 1957, and later served as coach and manager of the parent club, on which his sons Cal Jr. and Billy played.
The 1983 American League Championship Series was a semifinal matchup in Major League Baseball's 1983 postseason played between the Chicago White Sox and the Baltimore Orioles from October 5 to 8.
The 2001 Baltimore Orioles season was the 101st season in Baltimore Orioles franchise history, the 48th in Baltimore, and the 10th at Oriole Park at Camden Yards. They failed to improve on their 74–88 (.457) record from the previous year with a 63-98 record, and missed the postseason for the 4th straight season. It would also be the final season for Hall of Famer Cal Ripken Jr.
The 1998 Baltimore Orioles season was the 98th season in Baltimore Orioles franchise history, the 45th in Baltimore, and the 7th at Oriole Park at Camden Yards.
The 1996 Baltimore Orioles season was the 96th season in Baltimore Orioles franchise history, the 43rd in Baltimore, and the 5th at Oriole Park at Camden Yards.

The 1991 Baltimore Orioles season was the 91st season in Baltimore Orioles franchise history, the 38th in Baltimore, and the 38th and final at Memorial Stadium, as they would move into Oriole Park at Camden Yards the following year. The Orioles finished sixth in the American League East with a record of 67 wins and 95 losses. Cal Ripken. Jr. would be the first shortstop in the history of the American League to win two MVP awards in a career.
The 1988 Baltimore Orioles season was the 88th season in Baltimore Orioles franchise history, the 35th in Baltimore, and the 35th at Memorial Stadium. The Orioles had the worst start to a season in modern American baseball history. The Orioles finished seventh in the American League East, reduced to a record of 54 wins and 107 losses just five seasons after winning the World Series. The season is most notable for the 0–21 start that lasted from April 4 to April 28. Manager Cal Ripken, Sr. was fired after an 0–6 start and replaced by Hall of Famer Frank Robinson. The Orioles won their first game of the year against the Chicago White Sox at Comiskey Park on April 29. The most runs allowed during the season was 15 in a game on June 19 while the most runs scored was 12 in a game on May 31. Orioles owner Edward Bennett Williams died in August of that year.
The 1987 Baltimore Orioles season was the 86th season in Baltimore Orioles franchise history, the 33rd in Baltimore, and the 33rd at Memorial Stadium. The Orioles finished seventh in the American League East with a record of 73 wins and 89 losses. On August 5, the Orioles were in second place with a record of 59–47, just 2.5 games out of first place, but the Orioles would lose 42 of their final 56 games to finish in last place in the AL East.
The 1985 Baltimore Orioles season was the 85th season in Baltimore Orioles franchise history, the 32nd in Baltimore, and the 32nd at Memorial Stadium. The Orioles finished fourth in the American League East with a record of 83 wins and 78 losses. The Orioles led Major League Baseball in home runs (214) and slugging percentage (.430).
The 1984 Baltimore Orioles season was the 84th season in Baltimore Orioles franchise history, the 31st in Baltimore, and the 31st at Memorial Stadium. The Orioles finished fifth in the American League East with a record of 85 wins and 77 losses.
The 1982 Baltimore Orioles season was the 82nd season in Baltimore Orioles franchise history, the 29th in Baltimore, and the 29th at Memorial Stadium. The Orioles finished second in the American League East to the eventual AL Champions Milwaukee Brewers. They finished with a record of 94 wins and 68 losses. For the second consecutive season, the Orioles recorded the most grand slams in MLB, hitting eight in 1982. This was long time Oriole manager and future Hall of Famer Earl Weaver's last season managing the Orioles until he returned to manage them from 1985 to 1986.
The 1981 Baltimore Orioles season was the franchise's 28th season based in Baltimore and 81st overall season as a member of the American League. Games were suspended for 50 days due to the 1981 Major League Baseball strike, causing a split season. The Orioles competed as members of the American League East, finishing second in the first half of the season and fourth in the second half of the season; their overall record was 59 wins and 46 losses. The Orioles hit five grand slams, the most in MLB in 1981.
The 1979 Baltimore Orioles season was the 79th season in Baltimore Orioles franchise history, the 26th in Baltimore, and the 26th at Memorial Stadium. The Orioles finished first in the American League East division of Major League Baseball with a record of 102 wins and 57 losses. They went on to defeat the California Angels in the 1979 American League Championship Series, 3 games to 1, before losing in the 1979 World Series to the Pittsburgh Pirates, 4 games to 3.
The 1978 Baltimore Orioles season was the 78th season in Baltimore Orioles franchise history, the 25th in Baltimore, and the 25th at Memorial Stadium. The Orioles finished fourth in the American League East with a record of 90 wins and 71 losses.

Larry Duane Harlow is an American former professional baseball player who played six seasons in the Major Leagues with the Baltimore Orioles and California Angels.

Floyd Kinnard "Sugar Bear" Rayford is a retired professional baseball player who played for seven seasons in the Major leagues. He primarily played third base and catcher during his career, but was a utility man who played four different positions during his Major League career. He served as batting coach for two seasons with the Rochester Red Wings of the International League until his firing on September 9, 2011. He was known as "Sugar Bear" and a fan favorite for his roly-poly physique.
Robert Averill Bonner is an American former professional baseball player and currently a Baptist missionary.
