This article lists the Alliance Party of Northern Ireland's election results in UK parliamentary elections.
Year | Number of Candidates | Total votes | Average votes per candidate | % UK vote | % NI vote | Change (percentage points) | Saved deposits | Number of MPs (out of NI total) |
---|---|---|---|---|---|---|---|---|
1974 Feb | 3 | 22,660 | 7,553 | 0.1 | 3.2 | N/A | 1 | 0 / 12 |
1974 Oct | 5 | 44,644 | 8,929 | 0.2 | 6.4 | +0.1 | 4 | 0 / 12 |
1979 | 12 | 82,892 | 6,908 | 0.3 | 11.9 | +0.1 | 4 | 0 / 12 |
1983 | 12 | 61,275 | 5,106 | 0.2 | 8.0 | −0.1 | 5 | 0 / 17 |
1987 | 16 | 72,671 | 4,542 | 0.2 | 10.0 | 0.0 | 11 | 0 / 17 |
1992 | 16 | 68,665 | 4,292 | 0.2 | 8.7 | 0.0 | 11 | 0 / 17 |
1997 | 17 | 62,972 | 3,704 | 0.2 | 8.0 | 0.0 | 11 | 0 / 18 |
2001 | 10 | 28,999 | 2,900 | 0.1 | 3.6 | −0.1 | 5 | 0 / 18 |
2005 | 12 | 28,291 | 2,358 | 0.1 | 3.9 | 0.0 | 7 | 0 / 18 |
2010 | 18 | 42,762 | 2,376 | 0.2 | 6.3 | +0.1 | 8 | 1 / 18 |
2015 | 18 | 61,556 | 3,420 | 0.2 | 8.6 | 0.0 | 10 | 0 / 18 |
2017 | 18 | 64,553 | 3,586 | 0.2 | 7.9 | 0.0 | 10 | 0 / 18 |
2019 | 18 | 134,115 | 7,451 | 0.4 | 16.8 | +0.2 | 16 | 1 / 18 |
Constituency | Candidate | Votes | % | Position |
---|---|---|---|---|
Armagh | Robin Glendinning | 4,983 | 8.1 | 3 |
Belfast South | David Cook | 5,118 | 9.9 | 3 |
South Antrim | Charles Kinahan | 12,559 | 17.6 | 2 |
Constituency | Candidate | Votes | % | Position |
---|---|---|---|---|
Belfast North | John Ferguson | 3,807 | 8.1 | 3 |
Belfast South | John Glass | 11,715 | 23.0 | 2 |
North Antrim | Hugh Wilson | 8,689 | 14.6 | 2 |
North Down | Keith Jones | 9,973 | 17.5 | 2 |
South Antrim | Charles Kinahan | 10,460 | 15.3 | 2 |
Constituency | Candidate | Votes | % | Position |
---|---|---|---|---|
Armagh | William Ramsay | 2,071 | 3.2 | 5 |
Belfast East | Oliver Napier | 15,066 | 29.6 | 3 |
Belfast North | John Cushnahan | 4,120 | 9.7 | 5 |
Belfast South | Basil Glass | 11,745 | 25.1 | 2 |
Belfast West | John Cousins | 2,021 | 6.1 | 5 |
Fermanagh and South Tyrone | Peter Acheson | 1,070 | 1.7 | 5 |
Londonderry | Arthur Barr | 5,830 | 9.2 | 3 |
Mid Ulster | Aidan Lagan | 3,481 | 5.3 | 4 |
North Antrim | Hugh Wilson | 7,797 | 11.9 | 3 |
North Down | Keith Jones | 13,364 | 21.6 | 2 |
South Antrim | Charles Kinahan | 11,914 | 16.2 | 2 |
South Down | Patrick Forde | 4,407 | 6.8 | 3 |
Election | Candidate | Votes | % | Position |
---|---|---|---|---|
August 1981 Fermanagh and South Tyrone by-election | Seamus Close | 1,930 | 3.0 | 3 |
1982 Belfast South by-election | David Cook | 11,726 | 26.9 | 2 |
Constituency | Candidate | Votes | % | Position |
---|---|---|---|---|
Belfast East | Oliver Napier | 9,373 | 24.1 | 3 |
Belfast North | Paul Maguire | 3,879 | 9.1 | 5 |
Belfast South | David Cook | 8,945 | 23.9 | 2 |
East Antrim | Seán Neeson | 7,620 | 20.0 | 3 |
East Londonderry | Martha McGrath | 2,401 | 4.7 | 5 |
Foyle | Gerard O'Grady | 1,108 | 2.1 | 4 |
Lagan Valley | Seamus Close | 4,593 | 11.3 | 3 |
Mid Ulster | Aidan Lagan | 1,735 | 3.2 | 5 |
North Down | John Cushnahan | 9,015 | 22.1 | 2 |
South Antrim | Gordon Mawhinney | 4,612 | 11.9 | 3 |
South Down | Patrick Forde | 1,823 | 3.6 | 5 |
Strangford | Addie Morrow | 6,171 | 15.8 | 3 |
Election | Candidate | Votes | % | Position |
---|---|---|---|---|
1986 Belfast East by-election | Oliver Napier | 5,917 | 17.4 | 2 |
1986 Belfast North by-election | Paul Maguire | 5,072 | 16.7 | 2 |
1986 Belfast South by-election | David Cook | 7,635 | 25.0 | 2 |
1986 East Antrim by-election | Seán Neeson | 5,405 | 15.1 | 2 |
1986 North Down by-election | John Cushnahan | 8,066 | 20.8 | 2 |
Constituency | Candidate | Votes | % | Position |
---|---|---|---|---|
Belfast East | John Alderdice | 10,574 | 32.1 | 2 |
Belfast North | Tom Campbell | 2,871 | 7.8 | 6 |
Belfast South | David Cook | 6,963 | 21.3 | 2 |
East Antrim | Seán Neeson | 8,582 | 25.6 | 2 |
East Londonderry | Paddy McGowan | 3,237 | 6.6 | 4 |
Fermanagh and South Tyrone | John Haslett | 950 | 1.7 | 5 |
Foyle | Elizabeth Zammitt | 1,276 | 2.6 | 4 |
Lagan Valley | Seamus Close | 5,728 | 13.8 | 2 |
Mid Ulster | Paddy Bogan | 1,846 | 3.5 | 4 |
Newry and Armagh | William H. Jeffrey | 664 | 1.3 | 4 |
North Antrim | John Gareth Williams | 5,140 | 12.4 | 3 |
North Down | John Cushnahan | 7,932 | 19.4 | 3 |
South Antrim | Gordon Mawhinney | 5,808 | 16.0 | 2 |
South Down | Siobhan Laird | 1,069 | 1.9 | 4 |
Strangford | Addie Morrow | 7,553 | 20.3 | 2 |
Upper Bann | Fionnuala Cook | 2,487 | 5.9 | 4 |
Election | Candidate | Votes | % | Position |
---|---|---|---|---|
1990 Upper Bann by-election | William Ramsay | 948 | 2.7 | 7 |
Constituency | Candidate | Votes | % | Position |
---|---|---|---|---|
Belfast East | John Alderdice | 10,650 | 29.8 | 2 |
Belfast North | Tom Campbell | 2,246 | 6.3 | 4 |
Belfast South | John Montgomery | 5,054 | 15.0 | 3 |
East Antrim | Seán Neeson | 9,132 | 23.3 | 3 |
East Londonderry | Paddy McGowan | 3,613 | 6.8 | 4 |
Fermanagh and South Tyrone | Eric Bullick | 950 | 1.7 | 5 |
Foyle | Lara McIlroy | 1,390 | 2.7 | 4 |
Lagan Valley | Seamus Close | 6,207 | 12.7 | 2 |
Mid Ulster | Ann Gormley | 1,506 | 2.8 | 4 |
Newry and Armagh | Eileen Bell | 972 | 1.8 | 4 |
North Antrim | John Gareth Williams | 3,442 | 7.6 | 4 |
North Down | Addie Morrow | 6,611 | 14.7 | 3 |
South Antrim | John K. Blair | 5,244 | 12.4 | 3 |
South Down | Michael Healey | 1,542 | 2.5 | 4 |
Strangford | Kieran McCarthy | 7,585 | 16.9 | 3 |
Upper Bann | William Ramsay | 2,541 | 5.6 | 4 |
Election | Candidate | Votes | % | Position |
---|---|---|---|---|
1995 North Down by-election | Oliver Napier | 6,970 | 25.4 | 3 |
Constituency | Candidate | Votes | % | Position |
---|---|---|---|---|
Belfast East | Jim Hendron | 9,288 | 23.8 | 3 |
Belfast North | Tom Campbell | 2,221 | 5.4 | 4 |
Belfast South | Steve McBride | 5,112 | 12.9 | 4 |
East Antrim | Seán Neeson | 6,929 | 20.2 | 2 |
East Londonderry | Yvonne Boyle | 2,427 | 6.0 | 5 |
Fermanagh and South Tyrone | Stephen Farry | 977 | 2.0 | 4 |
Foyle | Helen-Marie Bell | 817 | 1.7 | 4 |
Lagan Valley | Seamus Close | 7,635 | 17.2 | 2 |
Mid Ulster | Ephrem Bogues | 460 | 0.9 | 4 |
Newry and Armagh | Pete Whitcroft | 1,015 | 1.9 | 4 |
North Antrim | David Alderdice | 2,845 | 6.2 | 5 |
North Down | Oliver Napier | 7,554 | 20.7 | 3 |
South Antrim | David Ford | 4,668 | 11.6 | 3 |
South Down | Julian Crozier | 1,711 | 3.5 | 4 |
Strangford | Kieran McCarthy | 5,467 | 13.1 | 3 |
Upper Bann | William Ramsay | 3,017 | 6.3 | 5 |
West Tyrone | Ann Gormley | 829 | 1.8 | 4 |
Election | Candidate | Votes | % | Position |
---|---|---|---|---|
2000 South Antrim by-election | David Ford | 2,031 | 6.6 | 5 |
Constituency | Candidate | Votes | % | Position |
---|---|---|---|---|
Belfast East | David Alderdice | 5,832 | 15.8 | 3 |
Belfast South | Geraldine Rice | 2,042 | 5.4 | 5 |
East Antrim | John Matthews | 4,483 | 12.5 | 3 |
East Londonderry | Yvonne Boyle | 1,625 | 4.1 | 5 |
Foyle | Colm Kavanagh | 579 | 1.2 | 5 |
Lagan Valley | Seamus Close | 7,624 | 16.6 | 2 |
North Antrim | Jayne Dunlop | 1,258 | 2.6 | 5 |
South Antrim | David Ford | 1,969 | 4.5 | 5 |
South Down | Betty Campbell | 685 | 1.3 | 5 |
Strangford | Kieran McCarthy | 2,902 | 6.7 | 3 |
Constituency | Candidate | Votes | % | Position |
---|---|---|---|---|
Belfast East | Naomi Long | 3,746 | 12.2 | 3 |
Belfast North | Marjorie Hawkins | 438 | 1.4 | 5 |
Belfast South | Geraldine Rice | 2,012 | 6.3 | 5 |
East Antrim | Seán Neeson | 4,869 | 15.3 | 3 |
East Londonderry | Yvonne Boyle | 924 | 2.6 | 5 |
Lagan Valley | Seamus Close | 4,316 | 10.1 | 3 |
North Antrim | Jayne Dunlop | 1,357 | 3.0 | 5 |
North Down | David Alderdice | 2,451 | 7.6 | 3 |
South Antrim | David Ford | 3,278 | 8.6 | 5 |
South Down | Julian Crozier | 613 | 1.3 | 5 |
Strangford | Kieran McCarthy | 3,332 | 9.0 | 3 |
Upper Bann | Alan Castle | 955 | 2.2 | 5 |
Constituency | Candidate | Votes | % | Position |
---|---|---|---|---|
Belfast East | Naomi Long | 12,839 | 37.2 | 1 |
Belfast North | Billy Webb | 1,809 | 4.9 | 5 |
Belfast South | Anna Lo | 5,114 | 15.0 | 4 |
Belfast West | Máire Hendron | 596 | 1.9 | 5 |
East Antrim | Gerry Lynch | 3,377 | 11.1 | 3 |
East Londonderry | Barney Fitzpatrick | 1,922 | 5.5 | 6 |
Fermanagh and South Tyrone | Vasundhara Kamble | 437 | 0.9 | 4 |
Foyle | Keith McGrellis | 223 | 0.6 | 6 |
Lagan Valley | Trevor Lunn | 4,174 | 11.4 | 3 |
Mid Ulster | Ian Butler | 397 | 1.0 | 6 |
Newry and Armagh | Andrew Muir | 545 | 1.2 | 6 |
North Antrim | Jayne Dunlop | 1,368 | 3.2 | 6 |
North Down | Stephen Farry | 1,876 | 5.6 | 3 |
South Antrim | Alan Lawther | 2,607 | 7.7 | 5 |
South Down | David Griffin | 560 | 1.3 | 7 |
Strangford | Deborah Girvan | 2,828 | 8.7 | 3 |
Upper Bann | Brendan Heading | 1,231 | 3.0 | 5 |
West Tyrone | Michael Bower | 859 | 2.3 | 5 |
Election | Candidate | Votes | % | Position |
---|---|---|---|---|
2011 Belfast West by-election | Aaron McIntyre | 122 | 0.5 | 6 |
2013 Mid Ulster by-election | Eric Bullick | 487 | 1.3 | 4 |
Constituency | Candidate | Votes | % | Position |
---|---|---|---|---|
Belfast East | Naomi Long | 16,978 | 42.8 | 2 |
Belfast North | Jason O'Neill | 2,941 | 7.3 | 4 |
Belfast South | Paula Bradshaw | 6,711 | 17.2 | 3 |
Belfast West | Gerard Catney | 636 | 1.8 | 7 |
East Antrim | Stewart Dickson | 5,021 | 15.0 | 3 |
East Londonderry | Yvonne Boyle | 2,642 | 7.6 | 5 |
Fermanagh and South Tyrone | Hannah Su | 658 | 1.3 | 5 |
Foyle | David Hawthorne | 835 | 2.3 | 5 |
Lagan Valley | Trevor Lunn | 5,544 | 13.9 | 3 |
Mid Ulster | Eric Bullick | 778 | 1.9 | 7 |
Newry and Armagh | Kate Nicholl | 841 | 1.7 | 4 |
North Antrim | Jayne Dunlop | 2,351 | 5.6 | 6 |
North Down | Andrew Muir | 3,086 | 8.6 | 3 |
South Antrim | Neil Kelly | 3,576 | 9.8 | 4 |
South Down | Martyn Todd | 1,622 | 3.8 | 6 |
Strangford | Kellie Armstrong | 4,687 | 13.8 | 3 |
Upper Bann | Peter Lavery | 1,780 | 3.8 | 5 |
West Tyrone | Stephen Donnelly | 869 | 2.2 | 5 |
Constituency | Candidate | Votes | % | Position |
---|---|---|---|---|
Belfast East | Naomi Long | 15,443 | 36.0 | 2 |
Belfast North | Sam Nelson | 2,475 | 5.4 | 3 |
Belfast South | Paula Bradshaw | 7,946 | 18.2 | 3 |
Belfast West | Sorcha Eastwood | 731 | 1.9 | 5 |
East Antrim | Stewart Dickson | 5,950 | 15.6 | 2 |
East Londonderry | Chris McCaw | 2,538 | 6.2 | 5 |
Fermanagh and South Tyrone | Noreen Campbell | 886 | 1.7 | 4 |
Foyle | John Doherty | 847 | 1.8 | 5 |
Lagan Valley | Aaron McIntyre | 4,996 | 11.1 | 3 |
Mid Ulster | Fay Watson | 1,094 | 2.3 | 5 |
Newry and Armagh | Jackie Coade | 1,256 | 2.3 | 5 |
North Antrim | Patricia O'Lynn | 2,723 | 5.6 | 5 |
North Down | Andrew Muir | 3,639 | 9.3 | 3 |
South Antrim | Neil Kelly | 3,203 | 7.4 | 4 |
South Down | Andrew McMurray | 1,814 | 3.6 | 5 |
Strangford | Kellie Armstrong | 5,693 | 14.7 | 2 |
Upper Bann | Tara Doyle | 2,319 | 4.5 | 5 |
West Tyrone | Stephen Donnelly | 1,000 | 2.3 | 5 |
Constituency | Candidate | Votes | % | Position |
---|---|---|---|---|
2018 West Tyrone by-election | Stephen Donnelly | 1,130 | 3.2 | 5 |
Constituency | Candidate | Votes | % | Position |
---|---|---|---|---|
Belfast East | Naomi Long | 19,055 | 44.9 | 2 |
Belfast North | Nuala McAllister | 4,824 | 9.8 | 3 |
Belfast South | Paula Bradshaw | 6,786 | 14.3 | 3 |
Belfast West | Donnamarie Higgins | 1,882 | 4.9 | 5 |
East Antrim | Danny Donnelly | 10,165 | 27.3 | 2 |
East Londonderry | Chris McCaw | 5,921 | 15.1 | 4 |
Fermanagh and South Tyrone | Matthew Beaumont | 2,650 | 5.2 | 4 |
Foyle | Rachael Ferguson | 1,267 | 2.7 | 6 |
Lagan Valley | Sorcha Eastwood | 13,087 | 28.8 | 2 |
Mid Ulster | Mel Boyle | 3,526 | 7.9 | 4 |
Newry and Armagh | Jackie Coade | 4,211 | 8.3 | 4 |
North Antrim | Patricia O'Lynn | 6,231 | 14.1 | 3 |
North Down | Stephen Farry | 18,358 | 45.2 | 1 |
South Antrim | John Blair | 8,190 | 19.1 | 3 |
South Down | Patrick Brown | 6,916 | 13.9 | 4 |
Strangford | Kellie Armstrong | 10,634 | 28.4 | 2 |
Upper Bann | Eóin Tennyson | 6,433 | 12.9 | 3 |
West Tyrone | Stephen Donnelly | 3,979 | 9.7 | 4 |
Constituency | Candidate | Votes | % | Position |
---|---|---|---|---|
Belfast East | Naomi Long | 17,218 | 40.3 | 2 |
Belfast North | Nuala McAllister | 4,274 | 10.6 | 3 |
Belfast South and Mid Down | Kate Nicholl | 8,839 | 20.3 | 2 |
Belfast West | Eóin Millar | 1,077 | 2.7 | 6 |
East Antrim | Danny Donnelly | 10,156 | 25.6 | 2 |
East Londonderry | Richard Stewart | 3,734 | 9.0 | 5 |
Fermanagh and South Tyrone | Eddie Roofe | 2,420 | 4.7 | 3 |
Foyle | Rachael Ferguson | 1,268 | 3.3 | 7 |
Lagan Valley | Sorcha Eastwood | 18,618 | 37.9 | 1 |
Mid Ulster | Padraic Farrell | 2,001 | 4.4 | 6 |
Newry and Armagh | Helena Young | 2,692 | 5.9 | 6 |
North Antrim | Sian Mulholland | 4,488 | 10.9 | 4 |
North Down | Stephen Farry | 13,608 | 31.4 | 2 |
South Antrim | John Blair | 4,574 | 10.7 | 4 |
South Down | Andrew McMurray | 3,187 | 7.0 | 4 |
Strangford | Michelle Guy | 10,428 | 26.8 | 2 |
Upper Bann | Eóin Tennyson | 6,322 | 13.3 | 3 |
West Tyrone | Stephen Donnelly | 2,287 | 5.2 | 6 |
Leigh was a constituency in Greater Manchester represented in the House of Commons of the UK Parliament.
Birmingham Edgbaston is a constituency, represented in the House of Commons of the UK Parliament since 2017 by Preet Gill, a Labour Co-op MP.
Birmingham Perry Barr is a constituency in the West Midlands, represented in the House of Commons of the UK Parliament by independent Ayoub Khan since July 2024. It had been previously held since 2001 by Khalid Mahmood of the Labour Party.
Gillingham was a constituency represented in the House of Commons of the Parliament of the United Kingdom. It elected one Member of Parliament (MP) by the first past the post system of election.
Edinburgh North was a burgh constituency of the House of Commons of the Parliament of the United Kingdom from 1918 to 1983. It elected one Member of Parliament (MP) using the first-past-the-post voting system.
Stirling and Falkirk Burghs was a parliamentary constituency represented in the House of Commons of the Parliament of the United Kingdom from 1918, comprising the burghs of Stirling, Falkirk and Grangemouth. It ceased to be a District of Burghs in 1950, but a constituency of the same name covering the same burghs continued in existence. In 1974 it became Stirling, Falkirk and Grangemouth. This was in turn abolished in 1983; it was the last British constituency to consist of non-contiguous parts.
Rutherglen is a burgh constituency represented in the House of Commons of the Parliament of the United Kingdom since 2024. It also existed between 1918 and 2005 and was largely replaced by Rutherglen and Hamilton West while a small portion became part of Glasgow Central and Glasgow South.
Kilmarnock was a county constituency of the House of Commons of the Parliament of the United Kingdom from 1918 to 1983. It elected one Member of Parliament (MP) by the first past the post system of election.
Woolwich East was a parliamentary constituency represented in the House of Commons of the Parliament of the United Kingdom from 1918 until 1983. Its seat was Woolwich, now in the Royal Borough of Greenwich in south-east London.
Hornsey was a constituency that returned one Member of Parliament (MP) to the House of Commons of the UK Parliament, 1885 — 1983. It was then largely replaced by Hornsey & Wood Green. Its voters using the first-past-the-post system elected the Conservative Party candidate at each election. Its closest result was a 1.29% majority at the 1966 election which saw the start of the Second Wilson Ministry. From 1945 onwards the runners-up in the seat were the Labour Party candidates.
Bedwellty was a county constituency in Monmouthshire which returned one Member of Parliament (MP) to the House of Commons of the Parliament of the United Kingdom from 1918 until it was abolished for the 1983 general election.
Chislehurst was a parliamentary constituency in what is now the London Borough of Bromley. It returned one Member of Parliament (MP) to the House of Commons of the Parliament of the United Kingdom.
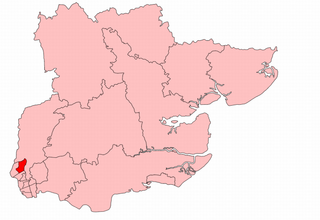
Walthamstow East was a parliamentary constituency in what was then the Municipal Borough of Walthamstow in east London. It returned one Member of Parliament (MP) to the House of Commons of the Parliament of the United Kingdom, elected by the first-past-the-post voting system.
Leyton was a parliamentary constituency in the United Kingdom, centred on the town of Leyton in North-East London. It returned one Member of Parliament (MP) to the House of Commons of the Parliament of the United Kingdom, elected by the first-past-the-post system.
Birmingham, Sparkbrook was a parliamentary constituency centred on the Sparkbrook area of Birmingham. It returned one Member of Parliament (MP) to the House of Commons of the Parliament of the United Kingdom, elected by the first past the post system.
Nottingham West was a borough constituency in the city of Nottingham. It returned one Member of Parliament (MP) to the House of Commons of the Parliament of the United Kingdom.
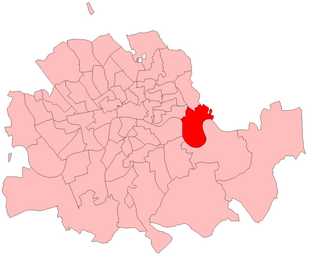
Batley and Morley was a parliamentary constituency centred on the towns of Batley and Morley in West Yorkshire. It returned one Member of Parliament (MP) to the House of Commons of the Parliament of the United Kingdom.
Poplar was a parliamentary constituency centred on the Poplar district of the East End of London. It returned one Member of Parliament (MP) to the House of Commons of the Parliament of the United Kingdom.
Denbigh was a county constituency centred on the town of Denbigh in North Wales. It returned one Member of Parliament (MP) to the House of Commons of the Parliament of the United Kingdom, elected by the first-past-the-post voting system.
Rhondda West was a parliamentary constituency centred on the Rhondda district of Wales. It returned one Member of Parliament (MP) to the House of Commons of the Parliament of the United Kingdom, elected by the first past the post system. Along with Rhondda East it was formed by dividing the old Rhondda constituency.