Elections to the Charnwood Borough Council took place on 5 May 2011, [1] in line with other local elections in the United Kingdom. A total of 52 councillors were elected from 28 wards as the whole council was up for election.
The pattern of local government in England is complex, with the distribution of functions varying according to the local arrangements.
The Conservatives held control of the council after winning it at the previous election with a sizeable, albeit reduced, majority of 14 seats. The Labour Party regained some of their 2007 losses in Loughborough and Shepshed whilst the Liberal Democrats lost four seats, leaving them with a sole councillor in Anstey. The British National Party only fielded three candidates and therefore lost a substantial share of their previous vote; they did, however, hold on to their one seat in East Goscote by just five votes, meaning Councillor Cathy Duffy became one of the few BNP councillors in the whole country to be re-elected.
The Conservative Party, officially the Conservative and Unionist Party, is a centre-right political party in the United Kingdom. Presently led by Theresa May, it has been the governing party since 2010. It presently has 314 Members of Parliament in the House of Commons, 249 members of the House of Lords, and 18 members of the European Parliament. It also has 31 Members of the Scottish Parliament, 12 members of the Welsh Assembly, eight members of the London Assembly and 9,008 local councillors. One of the major parties of UK politics, it has formed the government on 45 occasions, more than any other party.
The Labour Party is a centre-left political party in the United Kingdom which has been described as an alliance of social democrats, democratic socialists and trade unionists. The party's platform emphasises greater state intervention, social justice and strengthening workers' rights.
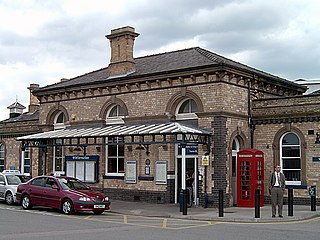
Loughborough is a town in the Charnwood borough of Leicestershire, England, seat of Charnwood Borough Council, and home to Loughborough University. The town had a population of 57,600 in 2004, making it the second largest settlement in Leicestershire. It is close to the Nottinghamshire border and within short distances of Nottingham, East Midlands Airport and Derby. The town has the world's largest bell foundry – John Taylor Bellfounders – which made bells for the Carillon war memorial, a landmark in the Queens Park in the town, of Great Paul for St Paul's Cathedral, and for York Minster.
Party | Seats | Gains | Losses | Net gain/loss | Seats % | Votes % | Votes | +/− | |
---|---|---|---|---|---|---|---|---|---|
Conservative | 33 | 3 | 2 | +1 | 63.5 | 50.9 | 48,940 | +2.3 | |
Labour | 16 | 3 | 0 | +3 | 30.8 | 40.3 | 38,728 | +12.9 | |
Liberal Democrat | 1 | 0 | 4 | −4 | 1.9 | 6.3 | 6,040 | −7.9 | |
BNP | 1 | 0 | 0 | ±0 | 1.9 | 1.0 | 959 | −6.0 | |
Independent | 1 | 0 | 0 | ±0 | 1.9 | 0.9 | 879 | −1.5 | |
UKIP | 0 | 0 | 0 | ±0 | 0.0 | 0.6 | 522 | N/A |
In wards that are represented by more than one councillor, electors were given more than one vote each, hence the voter turnout may not match the number of votes cast.
Party | Candidate | Votes | % | ± | |
---|---|---|---|---|---|
Liberal Democrat | John Sutherington | 1,087 | 28.8 | ||
Conservative | Paul Day | 989 | 26.2 | ||
Conservative | Susan Witts | 631 | 16.7 | ||
Labour | Glyn McAllister | 518 | 13.7 | ||
Labour | James Bolton | 335 | 8.9 | ||
BNP | James Taylor | 215 | 5.7 | ||
Turnout | 2,188 | 41.9 | |||
Liberal Democrat hold | Swing | ||||
Conservative hold | Swing | ||||
Ward Summary | ||||||
---|---|---|---|---|---|---|
Party | Votes | % Votes | ±% | Seats | Change | |
Conservative | 1,620 | 42.9 | −3.3 | 1 | ||
Liberal Democrat | 1,087 | 28.8 | −13.4 | 1 | ||
Labour | 853 | 22.6 | N/A | 0 | ||
BNP | 216 | 5.7 | −6.0 | 0 | ||
Total Votes Cast | 3,775 | |||||
Party | Candidate | Votes | % | ± | |
---|---|---|---|---|---|
Conservative | Hilary Fryer | 1,394 | 33.4 | ||
Conservative | Pauline Ranson | 1,224 | 29.4 | ||
Labour | Alan Willcocks | 855 | 20.5 | ||
Labour | Ivor Perry | 696 | 16.7 | ||
Turnout | 2,307 | 44.8 | |||
Conservative hold | Swing | ||||
Ward Summary | ||||||
---|---|---|---|---|---|---|
Party | Votes | % Votes | ±% | Seats | Change | |
Conservative | 2,618 | 62.8 | +5.6 | 2 | ||
Labour | 1,551 | 37.2 | +0.9 | 0 | ||
Total Votes Cast | 4,169 | |||||
Party | Candidate | Votes | % | ± | |
---|---|---|---|---|---|
Conservative | Stuart Jones | 1,102 | 30.6 | ||
Conservative | Serinda Shergill | 830 | 23.1 | ||
Labour | Marilyn Cowles | 642 | 17.8 | ||
Liberal Democrat | Helena Edwards | 564 | 15.7 | ||
Labour | Amrat Bava | 461 | 12.8 | ||
Turnout | 2,141 | 46.6 | |||
Conservative gain from Liberal Democrat | Swing | ||||
Conservative hold | Swing | ||||
Ward Summary | ||||||
---|---|---|---|---|---|---|
Party | Votes | % Votes | ±% | Seats | Change | |
Conservative | 1,932 | 53.7 | +8.0 | 2 | +1 | |
Labour | 1,103 | 30.6 | N/A | 0 | ||
Liberal Democrat | 564 | 15.7 | −31.4 | 0 | −1 | |
Total Votes Cast | 3,599 | |||||
Party | Candidate | Votes | % | ± | |
---|---|---|---|---|---|
Conservative | David Gaskell | 1,060 | 27.9 | ||
Conservative | Iain Bentley | 976 | 25.7 | ||
Labour | Rosalind Hopkins | 696 | 18.3 | ||
Labour | Sally Sapsford | 630 | 16.6 | ||
Liberal Democrat | Richard Miller | 433 | 11.4 | ||
Turnout | 2,253 | 42.5 | |||
Conservative gain from Liberal Democrat | Swing | ||||
Conservative hold | Swing | ||||
Ward Summary | ||||||
---|---|---|---|---|---|---|
Party | Votes | % Votes | ±% | Seats | Change | |
Conservative | 2,036 | 53.6 | +7.0 | 2 | +1 | |
Labour | 1,326 | 34.9 | N/A | 0 | ||
Liberal Democrat | 433 | 11.4 | −42.0 | 0 | −1 | |
Total Votes Cast | 3,795 | |||||
Party | Candidate | Votes | % | ± | |
---|---|---|---|---|---|
BNP | Cathy Duffy | 401 | 42.3 | +5.4 | |
Conservative | Yvonne Smith | 396 | 41.8 | +5.7 | |
Labour | Gill McLoughlin | 150 | 15.8 | N/A | |
Turnout | 963 | 43.2 | |||
BNP hold | Swing | −0.2 | |||
Party | Candidate | Votes | % | ± | |
---|---|---|---|---|---|
Conservative | David Snartt | 1,043 | 78.1 | −6.3 | |
Labour | Howard Stevenson | 292 | 21.9 | +6.3 | |
Turnout | 1,350 | 50.0 | |||
Conservative hold | Swing | −6.3 | |||
Party | Candidate | Votes | % | ± | |
---|---|---|---|---|---|
Labour | Chris Carter | 834 | 32.6 | ||
Labour | Julie Bradshaw | 817 | 31.9 | ||
Conservative | David Goss | 506 | 19.7 | ||
Conservative | Laura Seaton | 404 | 15.8 | ||
Turnout | 1,384 | 25.1 | |||
Labour gain from Conservative | Swing | ||||
Labour hold | Swing | ||||
Ward Summary | ||||||
---|---|---|---|---|---|---|
Party | Votes | % Votes | ±% | Seats | Change | |
Labour | 1,651 | 64.5 | +8.1 | 2 | +1 | |
Conservative | 910 | 35.5 | +4.4 | 0 | −1 | |
Total Votes Cast | 2,561 | |||||
Party | Candidate | Votes | % | ± | |
---|---|---|---|---|---|
Labour | Betty Newton | 1,270 | 30.6 | ||
Labour | Steve Smith | 1,131 | 27.2 | ||
Conservative | Stephen Hodgson | 906 | 21.8 | ||
Conservative | James Poland | 850 | 20.4 | ||
Turnout | 2,268 | 46.0 | |||
Labour hold | Swing | ||||
Labour gain from Conservative | Swing | ||||
Ward Summary | ||||||
---|---|---|---|---|---|---|
Party | Votes | % Votes | ±% | Seats | Change | |
Labour | 2,401 | 57.8 | +9.2 | 2 | +1 | |
Conservative | 1,756 | 42.2 | +0.3 | 0 | −1 | |
Total Votes Cast | 4,157 | |||||
Party | Candidate | Votes | % | ± | |
---|---|---|---|---|---|
Labour | Max Hunt | 1,150 | 32.7 | ||
Independent | Roy Campsall | 879 | 25.0 | ||
Conservative | John Bassford | 778 | 22.1 | ||
Labour | Hashok Parmar | 710 | 20.2 | ||
Turnout | 2,305 | 49.2 | |||
Labour hold | Swing | ||||
Independent hold | Swing | ||||
Ward Summary | ||||||
---|---|---|---|---|---|---|
Party | Votes | % Votes | ±% | Seats | Change | |
Labour | 1,860 | 52.9 | +9.9 | 1 | ||
Independent | 879 | 25.0 | −14.5 | 1 | ||
Conservative | 778 | 22.1 | +4.7 | 0 | ||
Total Votes Cast | 3,517 | |||||
Party | Candidate | Votes | % | ± | |
---|---|---|---|---|---|
Labour | Anne Williams | 1,163 | 34.5 | ||
Labour | Jitu Choudhury | 1,104 | 32.8 | ||
Conservative | Judith Spence | 612 | 18.1 | ||
Conservative | Mohammed Shahid | 492 | 14.6 | ||
Turnout | 1,934 | 41.2 | |||
Labour hold | Swing | ||||
Ward Summary | ||||||
---|---|---|---|---|---|---|
Party | Votes | % Votes | ±% | Seats | Change | |
Labour | 2,267 | 67.3 | +7.1 | 2 | ||
Conservative | 1,104 | 32.7 | −7.1 | 0 | ||
Total Votes Cast | 3,371 | |||||
Party | Candidate | Votes | % | ± | |
---|---|---|---|---|---|
Labour | Christine Harris | 1,200 | 36.4 | ||
Labour | Jewel Miah | 1,106 | 33.6 | ||
Conservative | Shazidur Chowdhury | 406 | 12.3 | ||
Conservative | Salim Miah | 389 | 11.8 | ||
Liberal Democrat | Michael Willis | 192 | 5.9 | ||
Turnout | 1,841 | 37.7 | |||
Labour hold | Swing | ||||
Ward Summary | ||||||
---|---|---|---|---|---|---|
Party | Votes | % Votes | ±% | Seats | Change | |
Labour | 2,306 | 70.0 | +19.1 | 2 | ||
Conservative | 795 | 24.1 | +5.7 | 0 | ||
Liberal Democrat | 192 | 5.9 | −16.1 | 0 | ||
Total Votes Cast | 3,294 | |||||
Party | Candidate | Votes | % | ± | |
---|---|---|---|---|---|
Conservative | Jane Hunt | 890 | 25.8 | ||
Conservative | Margaret Smidowicz | 826 | 24.0 | ||
Labour | Mike Cahill | 713 | 20.7 | ||
Labour | Ruth Sinclair | 610 | 17.7 | ||
Liberal Democrat | Steve Coltman | 207 | 6.0 | ||
Liberal Democrat | Andrew Thorpe | 200 | 5.8 | ||
Turnout | 1,863 | 40.9 | |||
Conservative hold | Swing | ||||
Ward Summary | ||||||
---|---|---|---|---|---|---|
Party | Votes | % Votes | ±% | Seats | Change | |
Conservative | 1,716 | 49.8 | −7.1 | 2 | ||
Labour | 1,323 | 38.4 | +18.7 | 0 | ||
Liberal Democrat | 407 | 11.8 | −11.7 | 0 | ||
Total Votes Cast | 3,446 | |||||
Party | Candidate | Votes | % | ± | |
---|---|---|---|---|---|
Conservative | Ron Jukes | 1,388 | 28.0 | ||
Conservative | Jonathan Morgan | 1,291 | 26.1 | ||
Labour | Frank Fay | 744 | 15.0 | ||
Labour | Andy Clarke | 720 | 14.6 | ||
Liberal Democrat | David Walker | 498 | 10.1 | ||
Liberal Democrat | David Scott | 312 | 6.3 | ||
Turnout | 2,501 | 53.7 | |||
Conservative gain from Liberal Democrat | Swing | ||||
Conservative hold | Swing | ||||
Ward Summary | ||||||
---|---|---|---|---|---|---|
Party | Votes | % Votes | ±% | Seats | Change | |
Conservative | 2,679 | 54.1 | +3.9 | 2 | +1 | |
Labour | 1,464 | 29.6 | N/A | 0 | ||
Liberal Democrat | 810 | 16.4 | −33.4 | 0 | −1 | |
Total Votes Cast | 4,125 | |||||
Party | Candidate | Votes | % | ± | |
---|---|---|---|---|---|
Labour | Robert Sharp | 1,078 | 28.6 | ||
Labour | Neville Stork | 998 | 26.4 | ||
Conservative | Geoffrey Parsons | 870 | 23.0 | ||
Conservative | Ann Watkinson | 832 | 22.0 | ||
Turnout | 2,137 | 40.4 | |||
Labour hold | Swing | ||||
Ward Summary | ||||||
---|---|---|---|---|---|---|
Party | Votes | % Votes | ±% | Seats | Change | |
Labour | 2,076 | 55.0 | +10.7 | 2 | ||
Conservative | 1,702 | 45.0 | +15.2 | 0 | ||
Total Votes Cast | 3,879 | |||||
Party | Candidate | Votes | % | ± | |
---|---|---|---|---|---|
Labour | Graeme Smith | 918 | 25.1 | ||
Labour | Marion Smith | 910 | 24.9 | ||
Conservative | Ted Parton | 766 | 20.9 | ||
Conservative | Hanif Asmal | 596 | 16.3 | ||
Liberal Democrat | Diana Brass | 279 | 7.6 | ||
Liberal Democrat | Alan Zenthon | 189 | 5.2 | ||
Turnout | 1,981 | 33.4 | |||
Labour hold | Swing | ||||
Ward Summary | ||||||
---|---|---|---|---|---|---|
Party | Votes | % Votes | ±% | Seats | Change | |
Labour | 1,828 | 50.0 | +7.4 | 2 | ||
Conservative | 1,362 | 37.2 | +3.7 | 0 | ||
Liberal Democrat | 468 | 12.8 | −11.0 | 0 | ||
Total Votes Cast | 3,658 | |||||
Party | Candidate | Votes | % | ± | |
---|---|---|---|---|---|
Labour | Sandie Forrest | 797 | 33.2 | ||
Labour | Patrick Youell | 733 | 30.5 | ||
Conservative | Simon Bradshaw | 475 | 19.8 | ||
Conservative | Ayesha Shahid | 396 | 16.5 | ||
Turnout | 1,490 | 29.8 | |||
Labour hold | Swing | ||||
Ward Summary | ||||||
---|---|---|---|---|---|---|
Party | Votes | % Votes | ±% | Seats | Change | |
Labour | 1,530 | 63.7 | −8.2 | 2 | ||
Conservative | 871 | 36.3 | +8.2 | 0 | ||
Total Votes Cast | 2,401 | |||||
Party | Candidate | Votes | % | ± | |
---|---|---|---|---|---|
Conservative | John Capleton | 1,178 | 32.0 | ||
Conservative | Jonathan Morgan | 1,086 | 29.5 | ||
Labour | Stan Coats | 604 | 16.4 | ||
Labour | Hayley Winrow | 553 | 15.0 | ||
UKIP | David Scott | 263 | 7.1 | ||
Turnout | 2,134 | 39.7 | |||
Conservative hold | Swing | ||||
Ward Summary | ||||||
---|---|---|---|---|---|---|
Party | Votes | % Votes | ±% | Seats | Change | |
Conservative | 2,264 | 61.5 | ±0.0 | 2 | ||
Labour | 1,157 | 31.4 | +5.8 | 0 | ||
UKIP | 263 | 7.1 | N/A | 0 | ||
Total Votes Cast | 3,684 | |||||
Party | Candidate | Votes | % | ± | |
---|---|---|---|---|---|
Conservative | Daniel Grimley | 948 | 78.5 | −3.9 | |
Labour | Mike McLoughlin | 260 | 21.5 | +3.9 | |
Turnout | 1,223 | 48.3 | |||
Conservative hold | Swing | −3.9 | |||
Party | Candidate | Votes | % | ± | |
---|---|---|---|---|---|
Conservative | Richard Shepherd | 1,721 | 37.4 | ||
Conservative | David Slater | 1,465 | 31.8 | ||
Labour | Pat Brown | 784 | 17.0 | ||
Labour | Bob Parks | 637 | 13.8 | ||
Turnout | 2,502 | 47.7 | |||
Conservative hold | Swing | ||||
Ward Summary | ||||||
---|---|---|---|---|---|---|
Party | Votes | % Votes | ±% | Seats | Change | |
Conservative | 3,186 | 69.2 | −6.7 | 2 | ||
Labour | 1,421 | 30.8 | +6.7 | 0 | ||
Total Votes Cast | 4,607 | |||||
Party | Candidate | Votes | % | ± | |
---|---|---|---|---|---|
Conservative | Peter Osborne | 1,831 | 39.7 | ||
Conservative | Diane Wise | 1,715 | 37.1 | ||
Labour | Joanna Richardson | 449 | 9.7 | ||
Labour | David Young | 362 | 7.9 | ||
UKIP | Jamie Bye | 259 | 5.6 | ||
Turnout | 2,564 | 50.9 | |||
Conservative hold | Swing | ||||
Ward Summary | ||||||
---|---|---|---|---|---|---|
Party | Votes | % Votes | ±% | Seats | Change | |
Conservative | 3,546 | 76.8 | +9.8 | 2 | ||
Labour | 811 | 17.6 | +4.0 | 0 | ||
UKIP | 259 | 5.6 | −4.4 | 0 | ||
Total Votes Cast | 4,616 | |||||
Party | Candidate | Votes | % | ± | |
---|---|---|---|---|---|
Conservative | Liz Bebbington | 837 | 20.2 | ||
Labour | Claire Poole | 805 | 19.5 | ||
Labour | Jane Lennie | 802 | 19.4 | ||
Conservative | Joan Tassell | 728 | 17.6 | ||
Liberal Democrat | Cynthia Popley | 540 | 13.1 | ||
Liberal Democrat | John Popley | 423 | 10.2 | ||
Turnout | 2,196 | 41.6 | |||
Conservative hold | Swing | ||||
Labour gain from Liberal Democrat | Swing | ||||
Ward Summary | ||||||
---|---|---|---|---|---|---|
Party | Votes | % Votes | ±% | Seats | Change | |
Labour | 1,607 | 38.9 | +7.9 | 1 | +1 | |
Conservative | 1,565 | 37.8 | +16.4 | 1 | ||
Liberal Democrat | 963 | 23.3 | −10.9 | 0 | −1 | |
Total Votes Cast | 4,135 | |||||
Party | Candidate | Votes | % | ± | |
---|---|---|---|---|---|
Conservative | Christine Radford | 1,000 | 21.9 | ||
Conservative | Bernard Burr | 960 | 21.0 | ||
Labour | Mike Cahill | 934 | 20.4 | ||
Labour | Ruth Sinclair | 801 | 17.5 | ||
Liberal Democrat | Steve Coltman | 481 | 10.5 | ||
Liberal Democrat | Andrew Thorpe | 396 | 8.7 | ||
Turnout | 2,519 | 45.3 | |||
Conservative hold | Swing | ||||
Ward Summary | ||||||
---|---|---|---|---|---|---|
Party | Votes | % Votes | ±% | Seats | Change | |
Conservative | 1,960 | 42.9 | +8.4 | 2 | ||
Labour | 1,735 | 37.9 | +8.7 | 0 | ||
Liberal Democrat | 877 | 19.2 | −3.8 | 0 | ||
Total Votes Cast | 4,572 | |||||
Party | Candidate | Votes | % | ± | |
---|---|---|---|---|---|
Conservative | Roy Brown | 1,278 | 35.3 | ||
Conservative | Andy Paling | 1,044 | 28.8 | ||
Labour | Glenn Thurlby | 674 | 18.6 | ||
Labour | Richard Watson | 625 | 17.3 | ||
Turnout | 2,078 | 36.8 | |||
Conservative hold | Swing | ||||
Ward Summary | ||||||
---|---|---|---|---|---|---|
Party | Votes | % Votes | ±% | Seats | Change | |
Conservative | 2,322 | 64.1 | −11.1 | 2 | ||
Labour | 1,299 | 35.9 | +11.1 | 0 | ||
Total Votes Cast | 3,621 | |||||
Party | Candidate | Votes | % | ± | |
---|---|---|---|---|---|
Conservative | Ken Pacey | 925 | 28.2 | ||
Conservative | Stephen Hampson | 894 | 27.3 | ||
Labour | Colin Lovell | 572 | 17.5 | ||
Labour | Stephen Rose | 542 | 16.5 | ||
BNP | Mick Dyer | 343 | 10.5 | ||
Turnout | 1,942 | 39.3 | |||
Conservative hold | Swing | ||||
Ward Summary | ||||||
---|---|---|---|---|---|---|
Party | Votes | % Votes | ±% | Seats | Change | |
Conservative | 1,819 | 55.5 | −3.2 | 2 | ||
Labour | 1,114 | 34.0 | +10.6 | 0 | ||
BNP | 343 | 10.5 | −7.4 | 0 | ||
Total Votes Cast | 3,276 | |||||
Party | Candidate | Votes | % | ± | |
---|---|---|---|---|---|
Conservative | Tom Barkley | 1,062 | 32.2 | ||
Conservative | Eric Vardy | 964 | 29.2 | ||
Labour | Colin Lovell | 684 | 20.7 | ||
Labour | Stephen Rose | 591 | 17.9 | ||
Turnout | 1,864 | 35.8 | |||
Conservative hold | Swing | ||||
Ward Summary | ||||||
---|---|---|---|---|---|---|
Party | Votes | % Votes | ±% | Seats | Change | |
Conservative | 2,026 | 61.4 | +8.8 | 2 | ||
Labour | 1,275 | 38.6 | +3.5 | 0 | ||
Total Votes Cast | 3,301 | |||||
Party | Candidate | Votes | % | ± | |
---|---|---|---|---|---|
Conservative | Jenny Bokor | 901 | 62.7 | +7.0 | |
Labour | Helen Dale | 298 | 20.7 | N/A | |
Liberal Democrat | Ian Sharpe | 238 | 16.6 | −27.7 | |
Turnout | 1,451 | 57.5 | |||
Conservative hold | Swing | −6.9 | |||
Party | Candidate | Votes | % | ± | |
---|---|---|---|---|---|
Conservative | Paul Harley | 1,473 | 19.1 | ||
Conservative | Mark Lowe | 1,399 | 18.2 | ||
Conservative | Brenda Seaton | 1,309 | 17.0 | ||
Labour | Steve Brown | 1,306 | 17.0 | ||
Labour | David Knaggs | 1,153 | 15.0 | ||
Labour | Janet Knaggs | 1,058 | 13.7 | ||
Turnout | 3,006 | 39.8 | |||
Conservative hold | Swing | ||||
Ward Summary | ||||||
---|---|---|---|---|---|---|
Party | Votes | % Votes | ±% | Seats | Change | |
Conservative | 4,181 | 54.3 | −2.0 | 3 | ||
Labour | 3,517 | 45.7 | +12.2 | 0 | ||
Total Votes Cast | 7,698 | |||||
Party | Candidate | Votes | % | ± | |
---|---|---|---|---|---|
Conservative | Matthew Blain | 904 | 78.1 | −5.9 | |
Labour | Gillian Adams | 253 | 20.7 | +5.9 | |
Turnout | 1,163 | 50.0 | |||
Conservative hold | Swing | −5.9 | |||
Elections to Slough Borough Council were held on 4 May 2006. One third of the council was up for election. This was the 121st Slough general local authority election since Slough became a local government unit in 1863.
Elections to the Borough Council in Slough, England, were held on 3 May 2007. One third of the council was up for election. This was the 122nd Slough general local authority election since Slough became a local government unit in 1863.
Elections to Barrow-in-Furness Borough Council was held on 1 May 2008. The whole of the council was up for election, with the number of councillors falling from 38 to 36, as a result of ward boundary changes enacted in February 2008. Councillors were elected for terms ranging between two and four years; where more than one councillor was elected in a ward, the councillor with the highest number of votes was granted the longer term.
This article lists the British National Party's election results in the UK parliamentary, Scottish parliamentary and Welsh Assembly elections, as well as in the European Parliament elections and at a local level.
Elections to Hammersmith and Fulham Council were held on 4 May 2006. The whole council was up for election for the first time since the 2002 election.
The 2010 Barnet Council election took place on 6 May 2010 to elect members of Barnet London Borough Council in London, England. The whole council was up for election and the Conservative party stayed in overall control of the council.
Local elections were held in the United Kingdom in 1991. The results were a setback for the governing Conservative Party, who were left with their lowest number of councillors since 1973 - though their popular vote was an improvement from the 1990 local elections, and the Conservatives would go on to win the general election in 1992.
Local elections were held in the United Kingdom on 3 May 1990. They were the last local elections held before the resignation of Prime Minister Margaret Thatcher in November 1990.
Elections to the North West Leicestershire District Council took place on 5 May 2011, in line with other local elections in the United Kingdom. A total of 38 councillors were elected from 20 wards as the whole council is up for election.
Elections to North Warwickshire District Council were held on Thursday 5 May 2011.
The second Guildford Borough Council full-council elections were held on 6 May 1976. The Conservatives retained control of the council with an increased majority, winning 35 of the 45 seats.
The 2011 council elections in Guildford saw the Conservatives retain control over Guildford Borough Council with an increased majority of 20 seats. Full results for each ward can be found at Guildford Council election, full results, 2011.
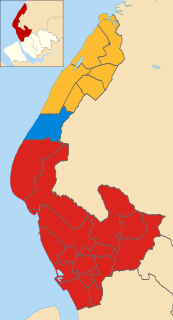
The 2012 Sefton Metropolitan Borough Council election took on 3 May 2012 to elect members of Sefton Metropolitan Borough Council in England, as part of the United Kingdom local elections, 2012. 22 seats, representing one third of the total Council membership, were up for election in single-member wards. Ten - nearly half - of the members elected were newcomers to the Council; five of these defeated sitting Councillors seeking re-election, whilst in the other five wards, the incumbent retired. Two incumbents stood under different labels to those they were elected under in 2008; both were defeated in their wards.
Elections for the London Borough of Merton were held on 4 May 1978 to elect members of Merton London Borough Council in London, England. This was on the same day as other local elections in England and Scotland.
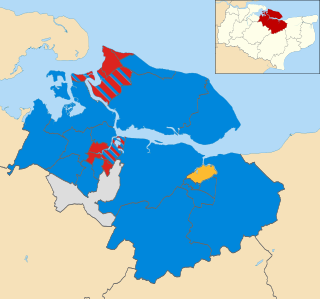
The 2011 Swale Borough Council election took place on 5 May 2011 to elect members of Swale Borough Council in Kent, England. The whole council was up for election and the Conservative party stayed in overall control of the council.
The 2015 Guildford Borough Council election took place on 7 May 2015 to elect members of Guildford Borough Council in England as one of the 2015 local elections, held simultaneously with the General Election.
Elections to Northampton Borough Council were held on 5 May 2011. The whole council was up for election and the Liberal Democrats Lost overall control of the council to the Conservative Party. There was no General Election taking place at the same time.
The 2015 Christchurch Borough Council election took place on 7 May 2015 to elect members of Christchurch Borough Council in Dorset, England. The whole council was up for election and the Conservative party stayed in overall control of the council.
The 2018 Hammersmith and Fulham Council election took place on 3 May 2018 to elect members of Hammersmith and Fulham Council in London.
Elections to Cannock Chase District Council took place on 3 May 2018 on the same day as other local elections in England. A third of the council was up for election, meaning a total of 13 councillors were elected from all but two of the council's wards.