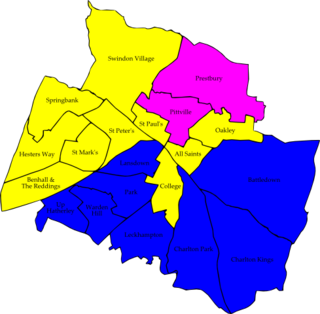
The 2004 Cheltenham Council election took place on 10 June 2004 to elect members of Cheltenham Borough Council in Gloucestershire, England. Half of the council was up for election and the Liberal Democrats lost overall control of the council to no overall control. [1]
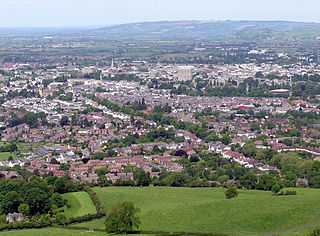
Cheltenham is a regency spa town and borough on the edge of the Cotswolds in Gloucestershire, England. Cheltenham has been a health and holiday spa town resort since the discovery of mineral springs in 1716 and has a number of internationally renowned and historic schools.
Borough status in the United Kingdom is granted by royal charter to local government districts in England, Wales and Northern Ireland. The status is purely honorary, and does not give any additional powers to the council or inhabitants of the district. In Scotland, similarly chartered communities were known as royal burghs, although the status is no longer granted.
Gloucestershire is a county in South West England. The county comprises part of the Cotswold Hills, part of the flat fertile valley of the River Severn, and the entire Forest of Dean.
After the election, the composition of the council was
The Liberal Democrats are a liberal political party in the United Kingdom. They presently have 11 Members of Parliament in the House of Commons, 96 members of the House of Lords, and one member of the European Parliament. They also have five Members of the Scottish Parliament and a member each in the Welsh Assembly and London Assembly. The party reached the height of its influence in the early 2010s, forming a junior partner in a coalition government from 2010 to 2015. It is presently led by Vince Cable.
The Conservative Party, officially the Conservative and Unionist Party, is a centre-right political party in the United Kingdom. Presently led by Theresa May, it has been the governing party since 2010. It presently has 314 Members of Parliament in the House of Commons, 249 members of the House of Lords, and 18 members of the European Parliament. It also has 31 Members of the Scottish Parliament, 12 members of the Welsh Assembly, eight members of the London Assembly and 9,008 local councillors. One of the major parties of UK politics, it has formed the government on 45 occasions, more than any other party.
People Against Bureaucracy (PAB) is a minor political party in Cheltenham, Gloucestershire. It was founded in 1976 to elect councillors to Tewkesbury Borough Council, later representing the same areas at Cheltenham Borough Council following council boundary changes. It describes itself as being opposed to 'party political' politics, and supportive of measures to make local government more transparent.
Overall turnout in the election was 39.44%. [3]
Party | Seats | Gains | Losses | Net gain/loss | Seats % | Votes % | Votes | +/− | |
---|---|---|---|---|---|---|---|---|---|
Conservative | 9 | 2 | 0 | +2 | 45.0 | 43.5 | 14,485 | +2.6% | |
Liberal Democrat | 7 | 0 | 3 | -3 | 35.0 | 34.5 | 11,481 | -9.8% | |
People Against Bureaucracy Action Group | 3 | 1 | 0 | +1 | 15.0 | 9.7 | 3,226 | +0.8% | |
Labour | 1 | 0 | 0 | 0 | 5.0 | 8.5 | 2,817 | +3.5% | |
Green | 0 | 0 | 0 | 0 | 0 | 2.3 | 777 | +1.3% | |
Independent | 0 | 0 | 0 | 0 | 0 | 1.4 | 479 | +1.4% |
Party | Candidate | Votes | % | ± | |
---|---|---|---|---|---|
Liberal Democrat | Stephen Jordan | 636 | 44.3 | ||
Conservative | Antony Sygerycz | 489 | 34.1 | ||
Green | Russell Partridge | 183 | 12.7 | ||
Labour | Martin Ricketts | 128 | 8.9 | ||
Majority | 147 | 10.2 | |||
Turnout | 1,436 | 34.6 | +0.9 | ||
Liberal Democrat hold | Swing |
Party | Candidate | Votes | % | ± | |
---|---|---|---|---|---|
Conservative | Andrew Wall | 1,035 | 60.9 | ||
Liberal Democrat | John Coleman | 523 | 30.8 | ||
Labour | Catherine Mozley | 142 | 8.4 | ||
Majority | 512 | 30.1 | |||
Turnout | 1,700 | 48.3 | +5.7 | ||
Conservative hold | Swing |
Party | Candidate | Votes | % | ± | |
---|---|---|---|---|---|
Conservative | Jacqueline Fletcher | 1,034 | 53.4 | ||
Liberal Democrat | Russell Milton | 780 | 40.3 | ||
Labour | Richard Moody | 121 | 6.3 | ||
Majority | 254 | 13.1 | |||
Turnout | 1,935 | 48.1 | +2.4 | ||
Conservative gain from Liberal Democrat | Swing | ||||
Party | Candidate | Votes | % | ± | |
---|---|---|---|---|---|
Conservative | Duncan Smith | 1,166 | 55.8 | ||
Liberal Democrat | Stephen Harvey | 729 | 34.9 | ||
Labour | Neville Mozeley | 196 | 9.4 | ||
Majority | 437 | 20.9 | |||
Turnout | 2,091 | 49.6 | +8.0 | ||
Conservative hold | Swing |
Party | Candidate | Votes | % | ± | |
---|---|---|---|---|---|
Conservative | Leslie Freeman | 1,284 | 64.0 | ||
Liberal Democrat | Margaret Woodward | 583 | 29.1 | ||
Labour | David Addison | 138 | 6.9 | ||
Majority | 701 | 35.0 | |||
Turnout | 2,005 | 49.6 | +3.2 | ||
Conservative hold | Swing |
Party | Candidate | Votes | % | ± | |
---|---|---|---|---|---|
Liberal Democrat | Lloyd Surgenor | 841 | 46.7 | ||
Conservative | Penelope Hall | 684 | 38.0 | ||
Green | Celia Wyndham | 177 | 9.8 | ||
Labour | Gillian Howells | 100 | 5.5 | ||
Majority | 157 | 8.7 | |||
Turnout | 1,802 | 41.9 | +4.3 | ||
Liberal Democrat hold | Swing |
Party | Candidate | Votes | % | ± | |
---|---|---|---|---|---|
Liberal Democrat | Wendy Young | 556 | 44.1 | ||
Independent | David Banyard | 365 | 28.9 | ||
Conservative | Daphne Allen | 235 | 18.6 | ||
Labour | Brenda Moody | 105 | 8.3 | ||
Majority | 191 | 15.1 | |||
Turnout | 1,261 | 29.2 | +6.2 | ||
Liberal Democrat hold | Swing |
Party | Candidate | Votes | % | ± | |
---|---|---|---|---|---|
Conservative | Diggory Seacome | 837 | 61.1 | ||
Liberal Democrat | Michael Storm | 326 | 23.8 | ||
Green | Keith Bessant | 105 | 7.7 | ||
Labour | David Evans | 103 | 7.5 | ||
Majority | 511 | 37.3 | |||
Turnout | 1,371 | 33.1 | +3.1 | ||
Conservative hold | Swing |
Party | Candidate | Votes | % | ± | |
---|---|---|---|---|---|
Conservative | Robin MacDonald | 1,466 | 70.3 | ||
Liberal Democrat | Dermot Clarke | 500 | 24.0 | ||
Labour | Frank Bench | 118 | 5.7 | ||
Majority | 966 | 46.4 | |||
Turnout | 2,084 | 52.2 | -2.8 | ||
Conservative hold | Swing |
Party | Candidate | Votes | % | ± | |
---|---|---|---|---|---|
Labour | Diana Hale | 502 | 38.0 | ||
Liberal Democrat | Paul Wheeldon | 492 | 37.2 | ||
Conservative | Stuart Hutton | 327 | 24.8 | ||
Majority | 10 | 0.8 | |||
Turnout | 1,321 | 32.6 | +6.2 | ||
Labour hold | Swing |
Party | Candidate | Votes | % | ± | |
---|---|---|---|---|---|
Conservative | Gerald Gearing | 1,199 | 59.1 | ||
Liberal Democrat | Iain Dobie | 660 | 32.5 | ||
Labour | Brian Hughes | 169 | 8.3 | ||
Majority | 539 | 26.6 | |||
Turnout | 2,028 | 44.0 | +4.0 | ||
Conservative hold | Swing |
Party | Candidate | Votes | % | ± | |
---|---|---|---|---|---|
People Against Bureaucracy Action Group | David Prince | 889 | 48.1 | ||
Conservative | Gary Bowden | 576 | 31.1 | ||
Liberal Democrat | David Lawrence | 268 | 14.5 | ||
Green | Jennifer Stone | 117 | 6.3 | ||
Majority | 313 | 16.9 | |||
Turnout | 1,850 | 43.9 | +3.4 | ||
Independent hold | Swing |
Party | Candidate | Votes | % | ± | |
---|---|---|---|---|---|
People Against Bureaucracy Action Group | Malcolm Stennett | 1,137 | 54.4 | ||
Conservative | John Newman | 593 | 28.4 | ||
Liberal Democrat | Jennifer Jones | 166 | 7.9 | ||
Labour | Jonquil Naish | 104 | 5.0 | ||
Green | Joan Mate | 89 | 4.3 | ||
Majority | 544 | 26.0 | |||
Turnout | 2,089 | 45.6 | +4.9 | ||
Independent hold | Swing |
Party | Candidate | Votes | % | ± | |
---|---|---|---|---|---|
Liberal Democrat | Simon Wheeler | 566 | 53.6 | ||
Conservative | Sarah Baylis | 360 | 34.1 | ||
Labour | Tustin Kelvin | 129 | 12.2 | ||
Majority | 206 | 19.5 | |||
Turnout | 1,055 | 24.3 | +2.4 | ||
Liberal Democrat hold | Swing |
Party | Candidate | Votes | % | ± | |
---|---|---|---|---|---|
Liberal Democrat | John Webster | 657 | 46.6 | ||
Conservative | Anthony Towers | 504 | 35.7 | ||
Labour | Clive Harriss | 250 | 17.7 | ||
Majority | 153 | 10.8 | |||
Turnout | 1,411 | 32.0 | +6.0 | ||
Liberal Democrat hold | Swing |
Party | Candidate | Votes | % | ± | |
---|---|---|---|---|---|
Liberal Democrat | Christopher Coleman | 557 | 63.6 | ||
Conservative | Susan Godwin | 146 | 16.7 | ||
Green | Caroline Griffiths | 106 | 12.1 | ||
People Against Bureaucracy Action Group | Joanna McVeagh | 67 | 7.6 | ||
Majority | 411 | 46.9 | |||
Turnout | 876 | 21.4 | +4.5 | ||
Liberal Democrat hold | Swing |
Party | Candidate | Votes | % | ± | |
---|---|---|---|---|---|
Liberal Democrat | John Rawson | 596 | 44.8 | ||
Conservative | Klara Sudbury | 484 | 36.4 | ||
Labour | Robert Irons | 137 | 10.3 | ||
Independent | Stephen Garbutt | 114 | 8.6 | ||
Majority | 112 | 8.4 | |||
Turnout | 1,331 | 30.4 | +6.6 | ||
Liberal Democrat hold | Swing |
Party | Candidate | Votes | % | ± | |
---|---|---|---|---|---|
People Against Bureaucracy | Peter Allen | 672 | 41.5 | ||
Liberal Democrat | Robert Jones | 613 | 37.9 | ||
Conservative | Michael Horton | 247 | 15.3 | ||
Labour | Ann Lightfoot | 87 | 5.4 | ||
Majority | 59 | 3.6 | |||
Turnout | 1,619 | 36.6 | +3.5 | ||
Independent gain from Liberal Democrat | Swing | ||||
Party | Candidate | Votes | % | ± | |
---|---|---|---|---|---|
Conservative | Alan Nicholson | 641 | 35.0 | ||
Liberal Democrat | David Fidgeon | 612 | 33.4 | ||
People Against Bureaucracy Action Group | Martin Burford | 461 | 25.2 | ||
Labour | Brian Johnson | 117 | 6.4 | ||
Majority | 29 | 1.6 | |||
Turnout | 1,831 | 44.1 | +1.5 | ||
Conservative gain from Liberal Democrat | Swing | ||||
Party | Candidate | Votes | % | ± | |
---|---|---|---|---|---|
Conservative | Anne Regan | 1,178 | 54.3 | ||
Liberal Democrat | Roger Whyborn | 820 | 37.8 | ||
Labour | Christopher Bailey | 171 | 7.9 | ||
Majority | 358 | 16.5 | |||
Turnout | 2,169 | 50.0 | +4.7 | ||
Conservative hold | Swing |
The 2004 Tunbridge Wells Borough Council election took place on 10 June 2004 to elect members of Tunbridge Wells Borough Council in Kent, England. One third of the council was up for election and the Conservative party stayed in overall control of the council.
The 2004 Worthing Borough Council election took place on 10 June 2004 to elect members of Worthing Borough Council in West Sussex, England. The whole council was up for election with boundary changes since the last election 2003 increasing the number of seats by 1. The Conservative party gained overall control of the council from no overall control. Overall turnout was 38.23%.
The 2004 Woking Council election took place on 10 June 2004 to elect members of Woking Borough Council in Surrey, England. One third of the council was up for election and the council stayed under no overall control.
The 2004 Welwyn Hatfield District Council election took place on 10 June 2004 to elect members of Welwyn Hatfield District Council in Hertfordshire, England. One third of the council was up for election and the Conservative party stayed in overall control of the council.
The 2004 Southend-on-Sea Council election took place on 10 June 2004 to elect members of Southend-on-Sea Unitary Council in Essex, England. One third of the council was up for election and the Conservative party stayed in overall control of the council.
The 2010 Cheltenham Council election took place on 6 May 2010 to elect members of Cheltenham Borough Council in Gloucestershire, England. Half of the council was up for election and the Liberal Democrats stayed in overall control of the council.
The 1998 Cheltenham Council election took place on 7 May 1998 to elect members of Cheltenham Borough Council in Gloucestershire, England. One third of the council was up for election and the Liberal Democrats stayed in overall control of the council.
The 1999 Cheltenham Council election took place on 6 May 1999 to elect members of Cheltenham Borough Council in Gloucestershire, England. One third of the council was up for election and the Liberal Democrats lost overall control of the council to no overall control.
The 2000 Cheltenham Council election took place on 4 May 2000 to elect members of Cheltenham Borough Council in Gloucestershire, England. One third of the council was up for election and the Conservative party stayed in overall control of the council.
The 2002 Cheltenham Council election took place on 2 May 2002 to elect members of Cheltenham Borough Council in Gloucestershire, England. The whole council was up for election with boundary changes since the last election in 2000 reducing the number of seat by 1. The Liberal Democrats gained overall control of the council from the Conservative party.
The 2006 Cheltenham Council election took place on 4 May 2006 to elect members of Cheltenham Borough Council in Gloucestershire, England. Half of the council was up for election and the council stayed under no overall control.
The 2008 Cheltenham Council election took place on 1 May 2008 to elect members of Cheltenham Borough Council in Gloucestershire, England. Half of the council was up for election and the council stayed under no overall control.
The 2004 Swindon Borough Council election took place on 10 June 2004 to elect members of Swindon Unitary Council in Wiltshire, England. One third of the council was up for election and the Conservative party gained overall control of the council from no overall control.
The 2004 Fareham Council election took place on 10 June 2004 to elect members of Fareham Borough Council in Hampshire, England. Half of the council was up for election and the Conservative party stayed in overall control of the council.
The 2004 Harrogate Council election took place on 10 June 2004 to elect members of Harrogate Borough Council in North Yorkshire, England. One third of the council was up for election and the Conservative party stayed in overall control of the council.
The 2004 Maidstone Borough Council election took place on 10 June 2004 to elect members of Maidstone Borough Council in Kent, England. One third of the council was up for election and the council stayed under no overall control.
The 2004 Basingstoke and Deane Council election took place on 10 June 2004 to elect members of Basingstoke and Deane Borough Council in Hampshire, England. One third of the council was up for election and the council stayed under no overall control.
The 2004 Hertsmere Borough Council election took place on 10 June 2004 to elect members of Hertsmere Borough Council in Hertfordshire, England. One third of the council was up for election and the Conservative party stayed in overall control of the council.
The 2004 Eastbourne Borough Council election took place on 10 June 2004 to elect members of Eastbourne Borough Council in East Sussex, England. One third of the council was up for election and the Conservative party gained overall control of the council from the Liberal Democrats.
The 2004 Colchester Borough Council election took place on 10 June 2004 to elect members of Colchester Borough Council in Essex, England. This was the same day as the other 2004 United Kingdom local elections and as the 2004 European Parliament Elections. One third of the seats were up for election and the council stayed under no overall control.