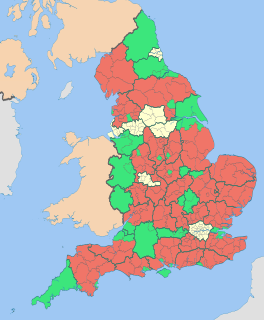
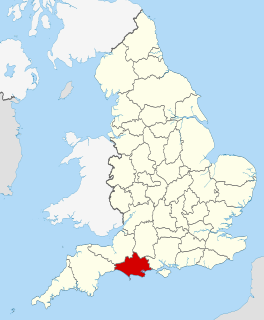
The 2007 East Dorset District Council election took place on 3 May 2007 to elect members of East Dorset District Council in Dorset, England. The whole council was up for election and the Conservative party stayed in overall control of the council. [1]
East Dorset is a local government district in Dorset, England. Its council is based in Wimborne Minster since 2016.
Non-metropolitan districts, or colloquially "shire districts", are a type of local government district in England. As created, they are sub-divisions of non-metropolitan counties in a two-tier arrangement.
Dorset is a county in South West England on the English Channel coast. The ceremonial county comprises the non-metropolitan county, which is governed by Dorset County Council, and the unitary authority areas of Poole and Bournemouth. Covering an area of 2,653 square kilometres (1,024 sq mi), Dorset borders Devon to the west, Somerset to the north-west, Wiltshire to the north-east, and Hampshire to the east. The county town is Dorchester which is in the south. After the reorganisation of local government in 1974 the county's border was extended eastward to incorporate the Hampshire towns of Bournemouth and Christchurch. Around half of the population lives in the South East Dorset conurbation, while the rest of the county is largely rural with a low population density.
Party | Seats | Gains | Losses | Net gain/loss | Seats % | Votes % | Votes | +/− | |
---|---|---|---|---|---|---|---|---|---|
Conservative | 25 | 3 | 2 | +1 | 69.4 | 62.0 | 30,092 | +2.1% | |
Liberal Democrat | 11 | 2 | 2 | 0 | 30.6 | 32.8 | 15,901 | -3.3% | |
UKIP | 0 | 0 | 0 | 0 | 0 | 4.1 | 2,003 | +3.6% | |
Labour | 0 | 0 | 0 | 0 | 0 | 0.7 | 334 | -1.0% | |
Independent | 0 | 0 | 1 | -1 | 0 | 0.3 | 168 | -0.8% |
Party | Candidate | Votes | % | ± | |
---|---|---|---|---|---|
Conservative | David Cozier | 581 | 65.6 | -10.2 | |
Liberal Democrat | David Tooke | 242 | 27.3 | +3.1 | |
UKIP | Annette Hurst | 63 | 7.1 | +7.1 | |
Majority | 339 | 38.3 | -13.3 | ||
Turnout | 886 | 39.5 | +7.3 | ||
Conservative hold | Swing |
Party | Candidate | Votes | % | ± | |
---|---|---|---|---|---|
Conservative | Pauline Reynolds | 651 | 79.4 | +5.8 | |
Liberal Democrat | Valery Kitson | 169 | 20.6 | -5.8 | |
Majority | 482 | 58.8 | +11.5 | ||
Turnout | 820 | 39.6 | +7.0 | ||
Conservative hold | Swing |
Party | Candidate | Votes | % | ± | |
---|---|---|---|---|---|
Liberal Democrat | Janet Dover | 933 | |||
Liberal Democrat | Don Wallace | 805 | |||
Conservative | K Johnson | 486 | |||
Conservative | Peter Finney | 447 | |||
UKIP | John Myers | 210 | |||
UKIP | Ken Dacombe | 205 | |||
Labour | Judy Eeles | 83 | |||
Turnout | 3,169 | 43.8 | +7.0 | ||
Liberal Democrat hold | Swing | ||||
Liberal Democrat hold | Swing |
Party | Candidate | Votes | % | ± | |
---|---|---|---|---|---|
Conservative | David Packer | 540 | 58.0 | -0.4 | |
Liberal Democrat | Mike Spencer-Smith | 323 | 34.7 | -6.9 | |
UKIP | Alan Haines | 68 | 7.3 | +7.3 | |
Majority | 217 | 23.3 | +6.5 | ||
Turnout | 931 | 47.7 | +7.2 | ||
Conservative hold | Swing |
Party | Candidate | Votes | % | ± | |
---|---|---|---|---|---|
Liberal Democrat | Paul Holland | 920 | |||
Liberal Democrat | Philip Cuckston | 837 | |||
Conservative | Peter Haward | 561 | |||
Conservative | Basil Pitt | 455 | |||
UKIP | Dave Evans | 219 | |||
UKIP | Josephine Evans | 188 | |||
Turnout | 3,180 | 40.8 | +12.0 | ||
Liberal Democrat hold | Swing | ||||
Liberal Democrat hold | Swing |
Party | Candidate | Votes | % | ± | |
---|---|---|---|---|---|
Liberal Democrat | Anne Holland | 479 | 61.6 | -9.7 | |
Conservative | Andrew Russell | 222 | 28.5 | -0.3 | |
UKIP | David Maloney | 77 | 9.9 | +9.9 | |
Majority | 257 | 33.0 | -9.5 | ||
Turnout | 778 | 40.5 | +7.7 | ||
Liberal Democrat hold | Swing |
Party | Candidate | Votes | % | ± | |
---|---|---|---|---|---|
Liberal Democrat | Stewart Hearn | 484 | 56.5 | -6.8 | |
Conservative | Ivan Harrington | 373 | 43.5 | +6.8 | |
Majority | 111 | 13.0 | -13.5 | ||
Turnout | 857 | 41.5 | +6.4 | ||
Liberal Democrat hold | Swing |
Party | Candidate | Votes | % | ± | |
---|---|---|---|---|---|
Conservative | Tim Palmer | 464 | 60.5 | -13.5 | |
Liberal Democrat | James Hankins | 303 | 39.5 | +13.5 | |
Majority | 161 | 21.0 | -26.9 | ||
Turnout | 767 | 44.2 | +5.6 | ||
Conservative hold | Swing |
Party | Candidate | Votes | % | ± | |
---|---|---|---|---|---|
Conservative | Queenie Comfort | 1,248 | |||
Conservative | Derek Burt | 1,127 | |||
Liberal Democrat | Robin Barsby | 358 | |||
Turnout | 2,733 | 41.9 | +4.4 | ||
Conservative hold | Swing | ||||
Conservative hold | Swing |
Party | Candidate | Votes | % | ± | |
---|---|---|---|---|---|
Conservative | John Little | 1,084 | |||
Conservative | Malcolm Birr | 1,063 | |||
Liberal Democrat | Margaret Martin | 388 | |||
Turnout | 2,535 | 36.5 | +7.0 | ||
Conservative hold | Swing | ||||
Conservative hold | Swing |
Party | Candidate | Votes | % | ± | |
---|---|---|---|---|---|
Conservative | Simon Tong | 682 | 62.5 | +20.0 | |
Liberal Democrat | Pauline Bailey-Wright | 410 | 37.5 | -20.0 | |
Majority | 272 | 24.9 | |||
Turnout | 1,092 | 54.0 | +17.5 | ||
Conservative gain from Liberal Democrat | Swing | ||||
Party | Candidate | Votes | % | ± | |
---|---|---|---|---|---|
Conservative | Spencer Flower | 699 | 79.8 | +5.5 | |
Liberal Democrat | Henry Bartlett | 177 | 20.2 | -5.5 | |
Majority | 522 | 59.6 | +11.0 | ||
Turnout | 876 | 46.0 | +5.3 | ||
Conservative hold | Swing |
Party | Candidate | Votes | % | ± | |
---|---|---|---|---|---|
Conservative | Sally Elliot | 511 | 65.9 | +6.9 | |
Liberal Democrat | Patricia Irvine | 134 | 17.3 | -23.7 | |
UKIP | John Baxter | 130 | 16.8 | +16.8 | |
Majority | 377 | 48.6 | +30.7 | ||
Turnout | 775 | 39.8 | +5.9 | ||
Conservative hold | Swing |
Party | Candidate | Votes | % | ± | |
---|---|---|---|---|---|
Conservative | Ronald Daw | 1,298 | |||
Conservative | Barbara Manuel | 1,269 | |||
Labour | Christopher Hampton | 251 | |||
Turnout | 2,818 | 40.6 | +8.2 | ||
Conservative hold | Swing | ||||
Conservative hold | Swing |
Party | Candidate | Votes | % | ± | |
---|---|---|---|---|---|
Conservative | Ann Warman | 1,347 | |||
Conservative | Michael Dyer | 1,277 | |||
UKIP | Mike Eckel | 239 | |||
Liberal Democrat | Adrian Wilson | 230 | |||
UKIP | Allan Tallett | 183 | |||
Turnout | 3,276 | 44.0 | +5.6 | ||
Conservative hold | Swing | ||||
Conservative hold | Swing |
Party | Candidate | Votes | % | ± | |
---|---|---|---|---|---|
Conservative | Raymond Dudman | 924 | 85.7 | +3.8 | |
Liberal Democrat | John Irvine | 154 | 14.3 | -3.8 | |
Majority | 770 | 71.4 | +7.7 | ||
Turnout | 1,078 | 52.0 | +5.0 | ||
Conservative hold | Swing |
Party | Candidate | Votes | % | ± | |
---|---|---|---|---|---|
Conservative | George Russell | 649 | 73.9 | -7.0 | |
Liberal Democrat | Philip Harknett | 131 | 14.9 | -4.2 | |
UKIP | David Baxter | 98 | 11.2 | +11.2 | |
Majority | 518 | 59.0 | -2.7 | ||
Turnout | 878 | 45.5 | +10.9 | ||
Conservative hold | Swing |
Party | Candidate | Votes | % | ± | |
---|---|---|---|---|---|
Conservative | Paul Bennett | 544 | 68.1 | +24.7 | |
Liberal Democrat | Tim Chant | 255 | 31.9 | -24.7 | |
Majority | 289 | 36.2 | |||
Turnout | 799 | 39.7 | +9.2 | ||
Conservative gain from Liberal Democrat | Swing | ||||
Party | Candidate | Votes | % | ± | |
---|---|---|---|---|---|
Conservative | Peter Richardson | 295 | 46.0 | +46.0 | |
Independent | Victor Redpath | 168 | 26.2 | -31.7 | |
UKIP | Jeremy Andrews | 90 | 14.0 | +14.0 | |
Liberal Democrat | Diana Baker | 89 | 13.9 | -28.2 | |
Majority | 127 | 19.8 | |||
Turnout | 642 | 33.6 | +10.9 | ||
Conservative gain from Independent | Swing | ||||
Party | Candidate | Votes | % | ± | |
---|---|---|---|---|---|
Conservative | Toni Coombs | 1,058 | |||
Conservative | Jean Hazel | 999 | |||
Liberal Democrat | Peter Baker | 524 | |||
Turnout | 2,581 | 39.5 | +5.5 | ||
Conservative hold | Swing | ||||
Conservative hold | Swing |
Party | Candidate | Votes | % | ± | |
---|---|---|---|---|---|
Conservative | Boyd Mortimer | 405 | 62.9 | +9.1 | |
Liberal Democrat | Lindsey Dedden | 239 | 37.1 | -0.7 | |
Majority | 166 | 25.8 | +9.8 | ||
Turnout | 644 | 31.8 | -4.0 | ||
Conservative hold | Swing |
Party | Candidate | Votes | % | ± | |
---|---|---|---|---|---|
Conservative | Lucy Clark | 1,029 | |||
Conservative | Michael Simper | 976 | |||
Liberal Democrat | Michael Daymond | 514 | |||
Liberal Democrat | Alan Dedden | 436 | |||
Turnout | 2,955 | 39.9 | -0.2 | ||
Conservative hold | Swing | ||||
Conservative hold | Swing |
Party | Candidate | Votes | % | ± | |
---|---|---|---|---|---|
Liberal Democrat | Pete Holden | 1,501 | |||
Conservative | Alexander Clarke | 1,429 | |||
Liberal Democrat | Nick Smith | 1,409 | |||
Conservative | David Durley | 1,389 | |||
Conservative | Andy Skeats | 1,242 | |||
Turnout | 6,970 | 45.1 | +11.1 | ||
Liberal Democrat gain from Conservative | Swing | ||||
Conservative hold | Swing | ||||
Liberal Democrat gain from Conservative | Swing | ||||
Party | Candidate | Votes | % | ± | |
---|---|---|---|---|---|
Liberal Democrat | Pat Hymers | 1,300 | |||
Liberal Democrat | David Morgan | 1,110 | |||
Liberal Democrat | Marilyn Osner | 1,047 | |||
Conservative | Robin Cook | 1,042 | |||
Conservative | Richard Booth | 899 | |||
Conservative | Michael Hodkinson | 827 | |||
UKIP | Jeff Markley | 233 | |||
Turnout | 6,458 | 41.6 | +5.8 | ||
Liberal Democrat hold | Swing | ||||
Liberal Democrat hold | Swing |
Party | Candidate | Votes | % | ± | |
---|---|---|---|---|---|
Conservative | Ian Monks | 499 | 53.0 | -12.5 | |
Liberal Democrat | David Tooke | 442 | 47.0 | +19.7 | |
Majority | 57 | 6.0 | -32.3 | ||
Turnout | 941 | 41.8 | +2.3 | ||
Conservative hold | Swing |
A by-election was held in Ferndown Central after the resignation of Conservative councillor Queenie Comfort. [5] The seat was held for the Conservatives by Lesley Dedman with a majority of 33 over independent Jason Lawford. [5]
By-elections, also spelled bye-elections, are used to fill elected offices that have become vacant between general elections.
Ferndown is a town and civil parish in the East Dorset district of Dorset in southern England, situated immediately to the north of the unitary authority areas of Poole and Bournemouth. The parish, which until 1972 was called Hampreston, includes the communities of Hampreston, Longham, Stapehill and Trickett's Cross. The latest population figure for the parish is 26,559.
A Councillor is a member of a local government council.
Party | Candidate | Votes | % | ± | |
---|---|---|---|---|---|
Conservative | Lesley Dedman | 510 | 51.7 | -26.0 | |
Independent | Jason Lawford | 477 | 48.3 | +48.3 | |
Majority | 33 | 3.4 | |||
Turnout | 987 | 26.4 | -15.5 | ||
Conservative hold | Swing |
A by-election was held in Corfe Mullen South after Liberal Democrat councillor Stewart Hearn resigned from the council. [6] The seat was held for the Liberal Democrats by Philip Harknet with a majority of 128. [6]
Corfe Mullen is a village in Dorset, England, on the north-western urban fringe of the South East Dorset conurbation and is part of the rural district of East Dorset. The village has a population of 10,133 (2011) and is served by six churches, five pubs, five schools, a library, various shops and local businesses, a village hall, and many community and sports organisations. There are three electoral wards within the village.
Party | Candidate | Votes | % | ± | |
---|---|---|---|---|---|
Liberal Democrat | Philip Harknet | 478 | 55.5 | -1.0 | |
Conservative | 350 | 40.6 | -2.9 | ||
UKIP | 34 | 3.9 | +3.9 | ||
Majority | 128 | 14.8 | +1.8 | ||
Turnout | 862 | 40.5 | -1.0 | ||
Liberal Democrat hold | Swing |
The 1999 Craven District Council election took place on 6 May 1999 to elect members of Craven District Council in North Yorkshire, England. One third of the council was up for election and the Conservative party gained overall control of the council from no overall control.
The 2000 Craven District Council election took place on 4 May 2000 to elect members of Craven District Council in North Yorkshire, England. One third of the council was up for election and the Conservative party stayed in overall control of the council.
The 2007 Harlow District Council election took place on 3 May 2007 to elect members of Harlow District Council in Essex, England. One third of the council was up for election and the council stayed under no overall control.
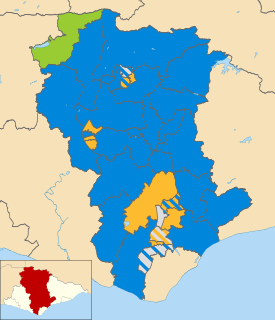
The 2007 Wealden District Council election took place on 3 May 2007 to elect members of Wealden District Council in East Sussex, England. The whole council was up for election and the Conservative party stayed in overall control of the council.
The 2011 Wealden District Council election took place on 5 May 2011 to elect members of Wealden District Council in East Sussex, England. The whole council was up for election and the Conservative party stayed in overall control of the council.
The 2011 East Dorset District Council election took place on 5 May 2011 to elect members of East Dorset District Council in Dorset, England. The whole council was up for election and the Conservative party stayed in overall control of the council.
The 2011 Torridge District Council election took place on 5 May 2011 to elect members of Torridge District Council in Devon, England. The whole council was up for election and the council stayed under no overall control.
The 2008 Huntingdonshire District Council election took place on 1 May 2008 to elect members of Huntingdonshire District Council in Cambridgeshire, England. One third of the council was up for election and the Conservative party stayed in overall control of the council.
The 2012 Huntingdonshire District Council election took place on 3 May 2012 to elect members of Huntingdonshire District Council in Cambridgeshire, England. One third of the council was up for election and the Conservative party stayed in overall control of the council.
The 2014 Huntingdonshire District Council election took place on 22 May 2014 to elect members of Huntingdonshire District Council in Cambridgeshire, England. One third of the council was up for election and the Conservative party stayed in overall control of the council.
The 2003 Rother District Council election took place on 1 May 2003 to elect members of Rother District Council in East Sussex, England. The whole council was up for election after boundary changes reduced the number of seats by 7. The Conservative party stayed in overall control of the council.
The 2007 Rother District Council election took place on 3 May 2007 to elect members of Rother District Council in East Sussex, England. The whole council was up for election and the Conservative party stayed in overall control of the council.
The 2014 Craven District Council election took place on 22 May 2014 to elect members of Craven District Council in North Yorkshire, England. One third of the council was up for election and the Conservative party stayed in overall control of the council.
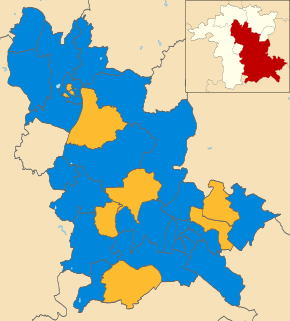
The 2007 Wychavon District Council election took place on 3 May 2007 to elect members of Wychavon District Council in Worcestershire, England. The whole council was up for election and the Conservative party stayed in overall control of the council.
The 2011 Wychavon District Council election took place on 5 May 2011 to elect members of Wychavon District Council in Worcestershire, England. The whole council was up for election and the Conservative party stayed in overall control of the council.
The 2003 Christchurch Borough Council election took place on 1 May 2003 to elect members of Christchurch Borough Council in Dorset, England. The whole council was up for election after boundary changes reduced the number of seats by one. The Conservative party stayed in overall control of the council.
The 2007 Christchurch Borough Council election took place on 3 May 2007 to elect members of Christchurch Borough Council in Dorset, England. The whole council was up for election and the Conservative party stayed in overall control of the council.
The 2015 Wychavon District Council election took place on 7 May 2015 to elect members of Wychavon District Council in Worcestershire, England. The whole council was up for election and the Conservative party stayed in overall control of the council.
The 2006 West Oxfordshire District Council election took place on 4 May 2006 to elect members of West Oxfordshire District Council in Oxfordshire, England. One third of the council was up for election and the Conservative party stayed in overall control of the council.
The 2007 West Oxfordshire District Council election took place on 3 May 2007 to elect members of West Oxfordshire District Council in Oxfordshire, England. One third of the council was up for election and the Conservative party stayed in overall control of the council.