Electoral results for the Division of O'Connor

Last updated

This is a list of electoral results for the Division of O'Connor in Australian federal elections from the division's creation in 1980 until the present.

Contents

Members

MemberPartyTerm
  Wilson Tuckey Liberal 1980–2010
  Tony Crook Nationals WA 2010–2013
  Rick Wilson Liberal 2013–present

Election results

Elections in the 2020s

2022

2022 Australian federal election: O'Connor [1]
PartyCandidateVotes%±%
Liberal Rick Wilson 32,65344.26+1.73
Labor Shaneane Weldon20,26027.46+6.84
Greens Giz Watson 7,48610.15+1.99
One Nation Stan Kustrin5,2177.07−1.40
Christians Justin Moseley2,1712.94+0.29
Great Australian Brenden Barber1,9042.58+1.66
Western Australia Morris Bessant1,7462.37+0.79
United Australia Tracy Tirronen1,2751.73−0.15
Australian Federation Isaac Middle1,0571.43+1.43
Total formal votes73,76994.58+0.76
Informal votes4,2295.42−0.76
Turnout 77,99866.13
Two-party-preferred result
Liberal Rick Wilson 41,17956.37−9.04
Labor Shaneane Weldon31,87843.63+9.04
Liberal hold Swing −9.04
Results are not final. Last updated on 23 May 2022 at 4:30 pm AEST.

Elections in the 2010s

2019

2019 Australian federal election: O'Connor [2]
PartyCandidateVotes%±%
Liberal Rick Wilson 36,13542.04−0.63
Labor Shelley Payne 18,24321.22+0.30
National John Hassell10,79512.56−5.77
One Nation Dean Smith7,2528.44+8.44
Greens Nelson Gilmour7,2458.43−1.94
Christians Ian 't Hart2,5272.94−1.08
United Australia Anthony Fels 1,5981.86+1.86
Western Australia Peter Swift1,2791.49+1.49
Great Australian Nicholas Robinson8831.03+1.03
Total formal votes85,95793.69−2.50
Informal votes5,7856.31+2.50
Turnout 91,74290.03+1.24
Two-party-preferred result
Liberal Rick Wilson 55,42164.48−0.56
Labor Shelley Payne 30,53635.52+0.56
Liberal hold Swing −0.56

2016

2016 Australian federal election: O'Connor [3]
PartyCandidateVotes%±%
Liberal Rick Wilson 37,09242.67+4.21
Labor Jon Ford 18,19020.92+1.40
National John Hassell15,93618.33−5.53
Greens Giz Watson 9,01310.37+3.58
Christians Trevor Young3,4964.02+1.54
Rise Up Australia Stephen Carson3,2073.69+2.96
Total formal votes86,93496.19+2.12
Informal votes3,4393.81−2.12
Turnout 90,37388.79−5.21
Two-party-preferred result
Liberal Rick Wilson 56,54365.04−0.38
Labor Jon Ford 30,39134.96+0.38
Liberal hold Swing −0.38

2013

2013 Australian federal election: O'Connor [4]
PartyCandidateVotes%±%
Liberal Rick Wilson 32,28439.13+0.77
National Chub Witham20,91425.35−3.50
Labor Michael Salt14,23417.25+0.14
Greens Diane Evers 5,6276.82−2.04
Palmer United Michael Lucas3,5814.34+4.34
Christians Mike Walsh2,0792.52+2.52
Independent Jane Mouritz1,4311.73+1.73
Family First Steven Fuhrmann6980.85−0.58
Katter's Australian Phillip Bouwman6600.80+0.80
Rise Up Australia Vanessa Korber5950.72+0.72
CEC Jean Robinson4070.49+0.03
Total formal votes82,51094.01−0.62
Informal votes5,2565.99+0.62
Turnout 87,76692.27−0.53
Two-party-preferred result
Liberal Rick Wilson 55,48667.25−5.75
Labor Michael Salt27,02432.75+5.75
Two-candidate-preferred result
Liberal Rick Wilson 42,04050.95+4.51
National Chub Witham40,47049.05−4.51
Liberal gain from National Swing +4.51

2010

2010 Australian federal election: O'Connor [5]
PartyCandidateVotes%±%
Liberal Wilson Tuckey 31,29438.36-10.36
National Tony Crook 23,53828.85+19.68
Labor Ian Bishop13,96217.11-9.15
Greens Andy Huntley7,2328.86+1.73
Christian Democrats Jacky Young2,2212.72+0.09
Independent Geoffrey Stokes1,2981.59+1.59
Family First Pat Scallan1,1641.43+0.21
Independent Neil Smithson5000.61+0.61
CEC Jean Robinson3750.46+0.08
Total formal votes81,58494.63-1.11
Informal votes4,6325.37+1.11
Turnout 86,21692.83-0.22
Two-party-preferred result
Liberal Wilson Tuckey 59,55573.00+10.24
Labor Ian Bishop22,02927.00-10.24
Two-candidate-preferred result
National Tony Crook 43,69353.56+53.56
Liberal Wilson Tuckey 37,89146.44-16.32
National gain from Liberal Swing N/A

Elections in the 2000s

2007

2007 Australian federal election: O'Connor
PartyCandidateVotes%±%
Liberal Wilson Tuckey 34,87645.85-7.40
Labor Dominic Rose15,54120.43+1.86
National Philip Gardiner 13,45917.69+8.25
Greens Adrian Price5,1886.82+0.09
Christian Democrats Mac Forsyth2,2352.94+0.12
One Nation Ross Paravicini1,2141.60-2.75
Independent Michael Walton1,1281.48+1.48
Family First Stephen Carson9911.30+1.30
Independent George Giudice9861.30-1.46
Independent Darius Crowe2370.31+0.31
CEC Judy Sudholz2120.28-0.22
Total formal votes76,06795.36+0.85
Informal votes3,7024.64-0.85
Turnout 79,76994.45+1.19
Two-party-preferred result
Liberal Wilson Tuckey 50,62566.55-3.84
Labor Dominic Rose25,44233.45+3.84
Liberal hold Swing -3.84

2004

2004 Australian federal election: O'Connor
PartyCandidateVotes%±%
Liberal Wilson Tuckey 38,87853.25+3.77
Labor Ursula Richards13,55918.57-1.21
National Leigh Hardingham6,8959.44+2.09
Greens Adrian Price4,9106.73+2.00
One Nation Brian McRae3,1774.35-7.42
Christian Democrats Justin Moseley2,0602.82+0.66
Independent George Giudice2,0132.76+2.76
New Country Jan Hough6390.88+0.88
Democrats David Thackrah5110.70-1.32
CEC Callum Payne3670.50+0.05
Total formal votes73,00994.51+0.43
Informal votes4,2455.49-0.43
Turnout 77,25493.26-2.04
Two-party-preferred result
Liberal Wilson Tuckey 51,38970.39+1.30
Labor Ursula Richards21,62029.61-1.30
Liberal hold Swing +1.30

2001

2001 Australian federal election: O'Connor
PartyCandidateVotes%±%
Liberal Wilson Tuckey 36,86749.48+2.59
Labor Mark Pendlebury14,74219.78+0.56
One Nation Ron McLean8,77411.77-3.19
National Vicki Brown5,4807.35-0.03
Greens Sandy Davis3,5254.73-0.29
Christian Democrats Alistair McNabb1,6112.16-0.02
Democrats Carole Pestana1,5022.02-0.32
Liberals for Forests Donna Selby1,1671.57+1.57
Independent Stephan Gyorgy5090.68+0.68
CEC Terry Iturbide3380.45+0.18
Total formal votes74,51594.08-1.19
Informal votes4,6935.92+1.19
Turnout 79,20895.88
Two-party-preferred result
Liberal Wilson Tuckey 51,48469.09+2.52
Labor Mark Pendlebury23,03130.91-2.52
Liberal hold Swing +2.52

Elections in the 1990s

1998

1998 Australian federal election: O'Connor
PartyCandidateVotes%±%
Liberal Wilson Tuckey 35,38346.48-6.92
Labor Frank Marciano16,87722.17-0.93
One Nation Frank Hough 10,44913.73+13.73
National Jenny Fowler6,1378.06-7.25
Greens Mark Douglas2,8453.74+0.27
Democrats Hannah McGlade 1,7992.36-0.93
Christian Democrats Mac Forsyth1,3431.76+1.76
Australia First Ian Stiles1,0541.38+1.38
CEC Stuart Smith2310.30+0.30
Total formal votes76,11895.16-1.63
Informal votes3,8734.84+1.63
Turnout 79,99195.33+0.21
Two-party-preferred result
Liberal Wilson Tuckey 49,58165.14-6.02
Labor Frank Marciano26,53734.86+6.02
Liberal hold Swing -6.02

1996

1996 Australian federal election: O'Connor
PartyCandidateVotes%±%
Liberal Wilson Tuckey 38,60756.00-12.26
National Kevin Altham12,45618.07+18.07
Labor Mick Cole12,24017.76-3.88
Greens John Hemsley2,5003.63+0.36
Democrats Neil Munro2,3383.39+0.02
Independent Stephan Gyorgy7951.15+1.15
Total formal votes68,93696.92-0.35
Informal votes2,1943.08+0.35
Turnout 71,13095.11-0.76
Two-party-preferred result
Liberal Wilson Tuckey 52,09975.93+1.91
Labor Mick Cole16,51424.07-1.91
Liberal hold Swing +1.91

1993

1993 Australian federal election: O'Connor
PartyCandidateVotes%±%
Liberal Wilson Tuckey 47,77768.26+18.21
Labor John Mason15,14421.64+1.45
Democrats Pat Howe2,3583.37-0.64
Greens Anne Lambert2,2873.27-0.35
Independent John Dunne1,4592.08+2.08
Independent Jim Lee9631.38+1.38
Total formal votes69,98897.26+0.30
Informal votes1,9682.74-0.30
Turnout 71,95695.88
Two-party-preferred result
Liberal Wilson Tuckey 51,78074.02+2.11
Labor John Mason18,17425.98-2.11
Liberal hold Swing +2.11

1990

1990 Australian federal election: O'Connor
PartyCandidateVotes%±%
Liberal Wilson Tuckey 33,80850.1-2.6
National James Ferguson13,94320.6-2.5
Labor Kim Chance 13,63520.2-2.6
Democrats Huw Grossmith2,7064.0+1.6
Greens Jim Cavill2,4433.6+3.6
Grey Power Rick Finney1,0091.5+1.5
Total formal votes67,54497.0
Informal votes2,1163.0
Turnout 69,66095.0
Two-party-preferred result
Liberal Wilson Tuckey 48,51471.9+1.0
Labor Kim Chance 18,94728.1-1.0
Liberal hold Swing +1.0

Elections in the 1980s

1987

1987 Australian federal election: O'Connor
PartyCandidateVotes%±%
Liberal Wilson Tuckey 31,32949.5-4.1
Labor Kim Chance 15,86525.1-2.8
National Trevor Flugge 14,63223.1+7.4
Democrats Shyama Peebles1,5032.4-0.4
Total formal votes63,32995.3
Informal votes3,1124.7
Turnout 66,44194.8
Two-party-preferred result
Liberal Wilson Tuckey 44,69570.6+1.4
Labor Kim Chance 18,63229.4-1.4
Liberal hold Swing +1.4

1984

1984 Australian federal election: O'Connor
PartyCandidateVotes%±%
Liberal Wilson Tuckey 33,40553.6+7.6
Labor Kim Chance 17,38227.9-6.7
National James Ferguson9,81715.7-0.3
Democrats Denis Kidby1,7402.8-0.7
Total formal votes62,34494.0
Informal votes3,9766.0
Turnout 66,32095.1
Two-party-preferred result
Liberal Wilson Tuckey 43,14069.2+7.7
Labor Kim Chance 19,20430.8-7.7
Liberal hold Swing +7.7

1983

1983 Australian federal election: O'Connor
PartyCandidateVotes%±%
Liberal Wilson Tuckey 29,41448.6+8.3
Labor Kim Chance 19,35632.0+8.8
National Brian Pearce5,9999.9-8.3
National James Ferguson3,6866.1-8.9
Democrats Denis Kidby2,1053.5+0.2
Total formal votes60,56097.9
Informal votes1,3032.1
Turnout 61,86393.8
Two-party-preferred result
Liberal Wilson Tuckey 64.1+1.6
Labor Kim Chance 35.9+35.9
Liberal hold Swing +1.6

1980

1980 Australian federal election: O'Connor
PartyCandidateVotes%±%
Liberal Wilson Tuckey 23,99840.3-6.5
Labor Robert Duncannon13,81423.2+5.0
National Country Anthony Hassell10,86318.2-8.0
National Eric Charlton 8,91515.0+15.0
Democrats Guy Wroth1,9943.3-2.0
Total formal votes59,58496.7
Informal votes2,0413.3
Turnout 61,62594.2
Two-candidate-preferred result
Liberal Wilson Tuckey 37,24962.5-2.7
National Country Anthony Hassell22,33537.5+2.7
Liberal hold Swing -2.7

Related Research Articles
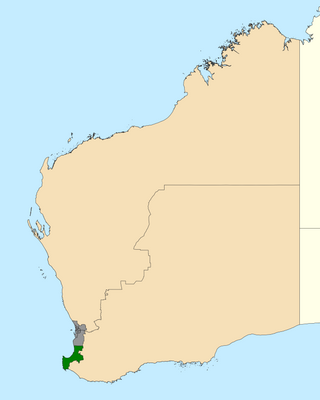
Division of Canning Australian federal electoral division

The Division of Canning is an Australian Electoral Division in Western Australia.
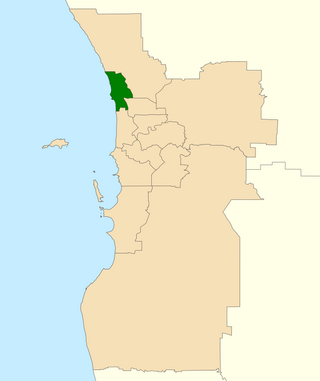
Division of Forrest Australian federal electoral division

The Division of Forrest is an Australian Electoral Division in Western Australia.

Division of Moore Australian federal electoral division

The Division of Moore is an Australian electoral division in the state of Western Australia.

Division of OConnor Australian federal electoral division

The Division of O'Connor is an Australian electoral division in the state of Western Australia. It is one of Western Australia's three rural seats, and one of the largest electoral constituencies in the world.

This article lists electoral results for the Division of Fremantle in Australian federal elections from the division's creation in 1901 to the present.

Division of Durack Australian federal electoral division

The Division of Durack is an Australian Electoral Division in the state of Western Australia.

This is a list of electoral results for the Division of Brand in Australian federal elections from the division's creation in 1984 until the present.

This is a list of electoral results for the Division of Canning in Australian federal elections from the division's creation in 1949 until the present.

This is a list of electoral results for the Division of Cowan in Australian federal elections from the division's creation in 1984 until the present.

This is a list of electoral results for the Division of Curtin in Australian federal elections from the division's creation in 1949 until the present.

This is a list of electoral results for the Division of Forrest in Australian federal elections from the division's creation in 1922 until the present.

This is a list of electoral results for the Division of Hasluck in Australian federal elections from the division's creation in 2001 until the present.

This is a list of electoral results for the Division of Moore in Australian federal elections from the division's creation in 1949 until the present.

This is a list of electoral results for the Division of Pearce in Australian federal elections from the division's creation in 1990 until the present.

This is a list of electoral results for the Division of Perth in Australian federal elections from the division's creation in 1901 until the present.

This is a list of electoral results for the Division of Stirling in Australian federal elections from the division's creation in 1955 until 2019. The division was abolished in 2022.

This is a list of electoral results for the Division of Swan in Australian federal elections from the division's creation in 1901 until the present.

This is a list of electoral results for the Division of Tangney in Australian federal elections from the division's creation in 1974 until the present.

This is a list of electoral results for the Division of Durack in Australian federal elections from the division's creation in 2008 until the present.

Results of the 2019 Australian federal election in Western Australia

This is a list of electoral division results for the 2019 Australian federal election in the state of Western Australia.

References

  1. O'Connor, WA, 2022 Tally Room, Australian Electoral Commission.
  2. O'Connor, WA, Tally Room 2019, Australian Electoral Commission.
  3. O'Connor, WA, Virtual Tally Room 2016, Australian Electoral Commission.
  4. 2013 results for O'Connor, AEC.
  5. "2010 results for O'Connor". AEC.