In finance, technical analysis is an analysis methodology for analysing and forecasting the direction of prices through the study of past market data, primarily price and volume. As a type of active management, it stands in contradiction to much of modern portfolio theory. The efficacy of technical analysis is disputed by the efficient-market hypothesis, which states that stock market prices are essentially unpredictable, and research on whether technical analysis offers any benefit has produced mixed results. It is distinguished from fundamental analysis, which considers a company's financial statements, health, and the overall state of the market and economy.

A candlestick chart is a style of financial chart used to describe price movements of a security, derivative, or currency.
A chart pattern or price pattern is a pattern within a chart when prices are graphed. In stock and commodity markets trading, chart pattern studies play a large role during technical analysis. When data is plotted there is usually a pattern which naturally occurs and repeats over a period. Chart patterns are used as either reversal or continuation signals.
The hikkake pattern, or hikkake, is a technical analysis pattern used for determining market turning-points and continuations. It is a simple pattern that can be observed in market price data, using traditional bar charts, point and figure charts, or Japanese candlestick charts. The pattern does not belong to the collection of traditional candlestick chart patterns.
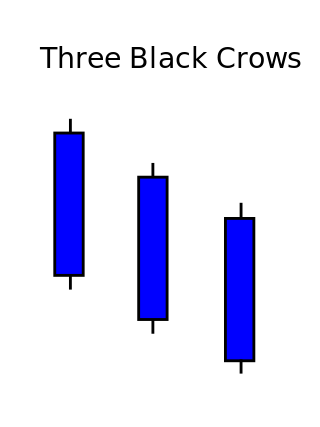
Three crows is a term used by stock market analysts to describe a market downturn. It appears on a candlestick chart in the financial markets. It unfolds across three trading sessions, and consists of three long candlesticks that trend downward like a staircase. Each candle should open below the previous day's open, ideally in the middle price range of that previous day. Each candlestick should also close progressively downward to establish a new near-term low. The pattern indicates a strong price reversal from a bull market to a bear market.

An open-high-low-close chart is a type of chart typically used to illustrate movements in the price of a financial instrument over time. Each vertical line on the chart shows the price range over one unit of time, e.g., one day or one hour. Tick marks project from each side of the line indicating the opening price on the left, and the closing price for that time period on the right. The bars may be shown in different hues depending on whether prices rose or fell in that period.
On the technical analysis chart, a wedge pattern is a market trend commonly found in traded assets. The pattern is characterized by a contracting range in prices coupled with an upward trend in prices or a downward trend in prices.
The doji is a commonly found pattern in a candlestick chart of financially traded assets in technical analysis. It is characterized by being small in length—meaning a small trading range—with an opening and closing price that are virtually equal. The efficacy of technical analysis is disputed by the efficient-market hypothesis, which states that stock market prices are essentially unpredictable.
Spinning top is a Japanese candlesticks pattern with a short body found in the middle of two long wicks. A spinning top is indicative of a situation where neither the buyers nor the sellers have won for that time period, as the market has closed relatively unchanged from where it opened; the market is indecisive regarding its trend. The upper and lower long wicks, however, tell us that both the buyers and the sellers had the upper hand at some point during the time period the candle represents. When a spinning top forms after a run up or run down in the market, it can be an indication of a pending reversal, as the indecision in the market is representative of the buyers losing momentum when this occurs after an uptrend and the sellers losing momentum after a downtrend.

A hammer is a type of bullish reversal candlestick pattern, made up of just one candle, found in price charts of financial assets. The candle looks like a hammer, as it has a long lower wick and a short body at the top of the candlestick with little or no upper wick. In order for a candle to be a valid hammer, most traders say the lower wick must be two times greater than the size of the body portion of the candle, and the body of the candle must be at the upper end of the trading range. This is one of the most common candlestick patterns and it is often seen in bearish trends.

The Morning Star is a pattern seen in a candlestick chart, a popular type of a chart used by technical analysts to anticipate or predict price action of a security, derivative, or currency over a short period of time.
The inverted hammer is a type of candlestick pattern found after a downtrend and is usually taken to be a trend-reversal signal. The inverted hammer looks like an upside down version of the Inverted * symbol pattern, and when it appears in an uptrend is called a shooting star.

In technical analysis, a shooting star is interpreted as a type of reversal pattern presaging a falling price. The Shooting Star looks exactly the same as the Inverted hammer, but instead of being found in a downtrend it is found in an uptrend and thus has different implications. Like the Inverted hammer it is made up of a candle with a small lower body, little or no lower wick, and a long upper wick that is at least two times the size of the lower body.
Double top and double bottom are reversal chart patterns observed in the technical analysis of financial trading markets of stocks, commodities, currencies, and other assets.
Marubozu is the name of a Japanese candlesticks formation used in technical analysis to indicate a stock has traded strongly in one direction throughout the session and closed at its high or low price of the day. A marubozu candle is represented only by a body; it has no wicks or shadows extending from the top or bottom of the candle. A white marubozu candle has a long white body and is formed when the open equals the low and the close equals the high.

Ichimoku Kinko Hyo (IKH) (Japanese: 一目均衡表, Hepburn: Ichimoku Kinkō Hyō), usually shortened to "Ichimoku", is a technical analysis method that builds on candlestick charting to improve the accuracy of forecast price moves.
In financial technical analysis, a candlestick pattern is a movement in prices shown graphically on a candlestick chart that some believe can predict a particular market movement. The recognition of the pattern is subjective and programs that are used for charting have to rely on predefined rules to match the pattern. There are 42 recognized patterns that can be split into simple and complex patterns. Author Thomas Bulkowski takes an in-depth look at 103 candlestick formations, from identification guidelines and statistical analysis of their behaviour to detailed trading tactics. He makes important discoveries and statistical summaries, as well as a glossary of relevant terms and a visual index to make candlestick identification easy.
Price action is a method of analysis of the basic price movements to generate trade entry and exit signals that is considered reliable while not requiring the use of indicators. It is a form of technical analysis, as it ignores the fundamental factors of a security and looks primarily at the security's price history. However, this method is different from other forms of technical analysis, as it focuses on the relation of the security's current price to its price history, which consists of all price movements, as opposed to values derived from the price history.

Volume Analysis is an example of a type of technical analysis that examines the volume of traded securities to confirm and predict price trends. Volume is a measure of the number of shares of an asset that are traded in a given period of time. As one of the oldest market indicators used for analysis, sudden changes in volume are often the result of news-related events. Commonly used by chartists and technical analysts, volume analysis is centered on the following ideas:
Heikin-Ashi is a Japanese trading indicator and financial chart that means "average bar". Heikin-Ashi charts resemble candlestick charts, but have a smoother appearance as they track a range of price movements, rather than tracking every price movement as with candlesticks. Heikin-Ashi was created in the 1700s by Munehisa Homma, who also created the candlestick chart. These charts are used by traders and investors to help determine and predict price movements.
