
The economy of Egypt is a highly centralized economy, focused on import substitution under president Gamal Abdel Nasser (1954–1970). During the rule of president Abdel Fattah el-Sisi (2014–present), the economy follows Egypt's 2030 Vision. The policy is aimed at diversifying Egypt's economy. The country's economy is the second largest in Africa by nominal GDP, and 42nd in worldwide ranking as of 2024.

The economy of Pakistan is categorized as a developing economy. It ranks as the 24th-largest based on GDP using purchasing power parity (PPP) and the 46th largest in terms of nominal GDP. With a population of 241.5 million people as of 2023, Pakistan's position at per capita income ranks 161st by GDP (nominal) and 138th by GDP (PPP) according to the International Monetary Fund (IMF).

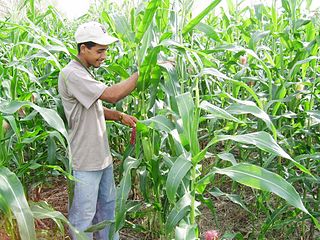
Organic farming, also known as organic agricultureecological farming or biological farming, is an agricultural system that uses fertilizers of organic origin such as compost manure, green manure, and bone meal and places emphasis on techniques such as crop rotation and companion planting. It originated early in the 20th century in reaction to rapidly changing farming practices. Indeed, so-called "organic pioneers" wanted to keep farming with nature, without being dependent on external inputs. Certified organic agriculture accounts for 70 million hectares globally, with over half of that total in Australia. Biological pest control, mixed cropping, and the fostering of insect predators are encouraged. Organic standards are designed to allow the use of naturally-occurring substances while prohibiting or severely limiting synthetic substances. For instance, naturally-occurring pesticides such as garlic extract, bicarbonate of soda, or pyrethrin which is found naturally in the Chrysanthemum flower are permitted, while synthetic fertilizers and pesticides such as glyphosate are prohibited. Synthetic substances that are allowed, only in exceptional circumstances, include, for example, copper sulfate, elemental sulfur, and veterinary drugs. Genetically modified organisms, nanomaterials, human sewage sludge, plant growth regulators, hormones, and antibiotic use in livestock husbandry are prohibited. Organic farming positively impacts sustainability, self-sufficiency, autonomy and independence, health, animal welfare, food security, and food safety. Organic farming can therefore be seen as part of the solution to the impacts of climate change, as also established by the Food and Agriculture Organisation (FAO).
An agricultural subsidy is a government incentive paid to agribusinesses, agricultural organizations and farms to supplement their income, manage the supply of agricultural commodities, and influence the cost and supply of such commodities.

A family farm is generally understood to be a farm owned and/or operated by a family. It is sometimes considered to be an estate passed down by inheritance.
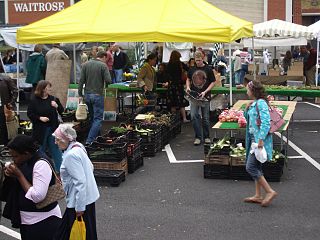
Local food is food that is produced within a short distance of where it is consumed, often accompanied by a social structure and supply chain different from the large-scale supermarket system.

A smallholding or smallholder is a small farm operating under a small-scale agriculture model. Definitions vary widely for what constitutes a smallholder or small-scale farm, including factors such as size, food production technique or technology, involvement of family in labor and economic impact. There are an estimated 500 million smallholder farms in developing countries of the world alone, supporting almost two billion people. Smallholdings are usually farms supporting a single family with a mixture of cash crops and subsistence farming. As a country becomes more affluent, smallholdings may not be self-sufficient, but may be valued for providing supplemental sustenance, recreation, and general rural lifestyle appreciation. As the sustainable food and local food movements grow in affluent countries, some of these smallholdings are gaining increased economic viability in the developed world as well.
Food policy is the area of public policy concerning how food is produced, processed, distributed, purchased, or provided. Food policies are designed to influence the operation of the food and agriculture system balanced with ensuring human health needs. This often includes decision-making around production and processing techniques, marketing, availability, utilization, and consumption of food, in the interest of meeting or furthering social objectives. Food policy can be promulgated on any level, from local to global, and by a government agency, business, or organization. Food policymakers engage in activities such as regulation of food-related industries, establishing eligibility standards for food assistance programs for the poor, ensuring safety of the food supply, food labeling, and even the qualifications of a product to be considered organic.
A food cooperative or food co-op is a food distribution outlet organized as a cooperative, rather than a private or public company. Food cooperatives are usually consumer cooperatives, where the decisions regarding the production and distribution of its food are chosen by its members. Like all cooperatives, food cooperatives are often based on the 7 Rochdale Principles, and they typically offer natural foods. Decisions about how to run a cooperative are not made by outside shareholders, therefore cooperatives often exhibit a higher degree of social responsibility than their corporate analogues.

Farmland Industries was the largest agricultural cooperative in North America when it eventually sold all of its assets in 2002–04. During its 74-year history, Farmland served its farmer membership as a diversified, integrated organization, playing a significant role in agricultural markets both domestically and worldwide.
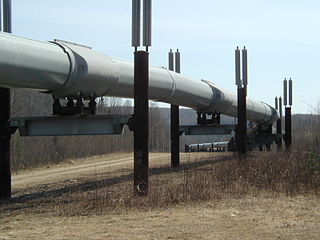
The Indian government has, since war, subsidised many industries and products, from fuel to gas.

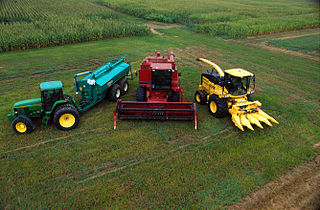
Industrial agriculture is a form of modern farming that refers to the industrialized production of crops and animals and animal products like eggs or milk. The methods of industrial agriculture include innovation in agricultural machinery and farming methods, genetic technology, techniques for achieving economies of scale in production, the creation of new markets for consumption, the application of patent protection to genetic information, and global trade. These methods are widespread in developed nations and increasingly prevalent worldwide. Most of the meat, dairy, eggs, fruits and vegetables available in supermarkets are produced in this way.
Farm to School is a program in the United States through which schools buy and feature locally produced, farm-fresh foods such as dairy, fruits and vegetables, eggs, honey, meat, and beans on their menus. Schools also incorporate nutrition-based curriculum and provide students with experiential learning opportunities such as farm visits, garden-based learning, and recycling programs. As a result of Farm to School, students have access to fresh, local foods, and farmers have access to new markets through school sales. Farmers are also able to participate in programs designed to educate kids about local food and agriculture.

For millennia, agriculture has played an important role in the Chinese economy and society. By the time the People's Republic of China was established in 1949, virtually all arable land was under cultivation; irrigation and drainage systems constructed centuries earlier and intensive farming practices already produced relatively high yields. But little prime virgin land was available to support population growth and economic development. However, after a decline in production as a result of the Great Leap Forward (1958–60), agricultural reforms implemented in the 1980s increased yields and promised even greater future production from existing cultivated land.

Retailing in India is one of the pillars of its economy and accounts for about 10 percent of its GDP. The Indian retail market is estimated to be worth $1.3 trillion as of 2022. India is one of the fastest growing retail markets in the world, with 1.4 billion people.

Agriculture in Ghana consists of a variety of agricultural products and is an established economic sector, providing employment on a formal and informal basis. It is represented by the Ministry of Food and Agriculture. Ghana produces a variety of crops in various climatic zones which range from dry savanna to wet forest which run in east–west bands across Ghana. Agricultural crops, including yams, grains, cocoa, oil palms, kola nuts, and timber, form the base of agriculture in Ghana's economy. In 2013 agriculture employed 53.6% of the total labor force in Ghana.
The economic liberalisation in India refers to the series of policy changes aimed at opening up the country's economy to the world, with the objective of making it more market-oriented and consumption-driven. The goal was to expand the role of private and foreign investment, which was seen as a means of achieving economic growth and development. Although some attempts at liberalisation were made in 1966 and the early 1980s, a more thorough liberalisation was initiated in 1991.
In a report compiled by the government of Alaska, the real GDP of Alaska was $51.1 billion in 2011, $52.9 billion in 2012 and $51.5 billion in 2013. The drop-off that occurred between 2012 and 2013 has been attributed to the decline in the mining sector, specifically the oil and gas sectors, a consequence of declined production. The state's economy has been described by University of Alaska Anchorage economist Scott Goldsmith as a "three-legged stool" – with one leg being the petroleum and gas industry, the second leg being the federal government and the third leg being all other industries and services. Between 2004 and 2006, the federal government was responsible for 135,000 Alaska jobs, the petroleum sector provided 110,000 jobs and all other industries and services combined for 122,000 jobs.
Agriculture in Panama is an important sector of the Panamanian economy. Major agricultural products include bananas, cocoa beans, coffee, coconuts, timber, beef, chicken, shrimp, corn, potatoes, rice, soybeans, and sugar cane.

The Farmers' Market Nutrition Program (FMNP) is a federal assistance program in the United States associated with the Special Supplemental Nutrition Program for Women, Infants and Children that provides fresh, unprepared, locally grown fruits and vegetables and nutrition education to WIC participants. Women, infants and children that have been certified to receive WIC program benefits or who are on a waiting list for WIC certification are eligible to participate in the FMNP.


