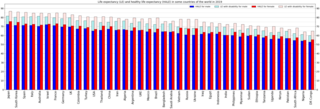
Tables
Congressional district table:
| Congressional district | State | Life expectancy at birth 2018 (years) |
|---|---|---|
| - | 79.4 | |
| Congressional district 18 | California | 83.7 |
| Congressional district 12 | New York | 82.9 |
| Congressional district 33 | California | 81.7 |
| Congressional district 17 | California | 83.4 |
| Congressional district 8 | Virginia | 83.5 |
| Congressional district 10 | New York | 82.2 |
| Congressional district 3 | New York | 81.9 |
| Congressional district 10 | Virginia | 82.5 |
| Congressional district 7 | New Jersey | 81.9 |
| Congressional district 8 | Maryland | 83.3 |
| Congressional district 11 | New Jersey | 80.9 |
| Congressional district 11 | Virginia | 83.6 |
| Congressional district 45 | California | 82.6 |
| Congressional district 12 | California | 82.6 |
| Congressional district 5 | Massachusetts | 81.6 |
| Congressional district 3 | Texas | 81.8 |
| Congressional district 5 | New Jersey | 82.0 |
| Congressional district 52 | California | 81.5 |
| Congressional district 14 | California | 83.6 |
| Congressional district 4 | Connecticut | 82.5 |
| Congressional district 6 | Illinois | 81.1 |
| Congressional district 4 | Massachusetts | 80.6 |
| Congressional district 7 | Washington | 81.8 |
| Congressional district 48 | California | 82.6 |
| Congressional district 17 | New York | 82.6 |
| Congressional district 22 | Texas | 80.9 |
| Congressional district 3 | Minnesota | 81.4 |
| Congressional district (at large) | District of Columbia | 78.3 |
| Congressional district 4 | New York | 82.5 |
| Congressional district 15 | California | 82.0 |
| Congressional district 8 | Massachusetts | 80.9 |
| Congressional district 6 | Georgia | 79.1 |
| Congressional district 6 | Massachusetts | 81.1 |
| Congressional district 16 | New York | 81.6 |
| Congressional district 2 | Missouri | 79.4 |
| Congressional district 7 | Texas | 79.4 |
| Congressional district 3 | Maryland | 79.1 |
| Congressional district 2 | Colorado | 82.3 |
| Congressional district 6 | New York | 83.0 |
| Congressional district 5 | Illinois | 79.4 |
| Congressional district 1 | Washington | 81.1 |
| Congressional district 9 | Illinois | 79.2 |
| Congressional district 6 | Maryland | 81.4 |
| Congressional district 1 | New York | 80.6 |
| Congressional district 11 | Michigan | 78.5 |
| Congressional district 7 | Pennsylvania | 79.5 |
| Congressional district 9 | North Carolina | 79.6 |
| Congressional district 14 | Illinois | 80.6 |
| Congressional district 26 | Texas | 80.3 |
| Congressional district 4 | New Jersey | 80.0 |
| Congressional district 8 | Pennsylvania | 80.2 |
| Congressional district 2 | Minnesota | 81.6 |
| Congressional district 12 | New Jersey | 80.9 |
| Congressional district 6 | Pennsylvania | 80.4 |
| Congressional district 11 | New York | 80.9 |
| Congressional district 6 | New Jersey | 81.0 |
| Congressional district 39 | California | 82.0 |
| Congressional district 11 | California | 81.6 |
| Congressional district 27 | California | 81.6 |
| Congressional district 30 | California | 81.7 |
| Congressional district 13 | California | 82.0 |
| Congressional district 1 | Connecticut | 80.1 |
| Congressional district 3 | Kansas | 80.4 |
| Congressional district 6 | Arizona | 80.4 |
| Congressional district 3 | Massachusetts | 81.2 |
| Congressional district 10 | Illinois | 80.9 |
| Congressional district 5 | Maryland | 78.8 |
| Congressional district 1 | Hawaii | 82.4 |
| Congressional district 8 | Washington | 80.9 |
| Congressional district 3 | New Jersey | 79.8 |
| Congressional district 5 | Connecticut | 80.8 |
| Congressional district 19 | California | 83.9 |
| Congressional district 5 | Wisconsin | 80.8 |
| Congressional district 2 | New York | 81.1 |
| Congressional district 6 | Colorado | 81.0 |
| Congressional district 5 | Arizona | 80.4 |
| Congressional district 3 | Connecticut | 80.4 |
| Congressional district 9 | New Jersey | 81.6 |
| Congressional district 6 | Minnesota | 81.2 |
| Congressional district 9 | Washington | 81.8 |
| Congressional district 4 | California | 80.9 |
| Congressional district 1 | Virginia | 80.2 |
| Congressional district 2 | California | 81.2 |
| Congressional district 21 | Texas | 80.4 |
| Congressional district 4 | Minnesota | 80.7 |
| Congressional district 28 | California | 81.7 |
| Congressional district 1 | New Hampshire | 80.2 |
| Congressional district 2 | Texas | 79.4 |
| Congressional district 25 | California | 81.8 |
| Congressional district 23 | Florida | 81.0 |
| Congressional district 49 | California | 81.8 |
| Congressional district 21 | Florida | 82.0 |
| Congressional district 2 | Connecticut | 80.6 |
| Congressional district 5 | Indiana | 78.4 |
| Congressional district 18 | New York | 80.5 |
| Congressional district 2 | Massachusetts | 80.3 |
| Congressional district 24 | Texas | 79.1 |
| Congressional district 7 | Virginia | 79.3 |
| Congressional district 5 | Minnesota | 81.3 |
| Congressional district 53 | California | 81.5 |
| Congressional district 7 | Georgia | 81.1 |
| Congressional district 13 | North Carolina | 79.4 |
| Congressional district 2 | Wisconsin | 80.7 |
| Congressional district 22 | Florida | 81.9 |
| Congressional district 10 | Texas | 79.9 |
| Congressional district 20 | New York | 79.8 |
| Congressional district 11 | Illinois | 80.9 |
| Congressional district 32 | Texas | 78.8 |
| Congressional district 1 | Oregon | 81.2 |
| Congressional district 7 | Massachusetts | 80.8 |
| Congressional district 8 | Arizona | 80.4 |
| Congressional district 8 | Michigan | 79.5 |
| Congressional district 7 | Illinois | 79.2 |
| Congressional district 18 | Pennsylvania | 78.3 |
| Congressional district 12 | Ohio | 78.6 |
| Congressional district 9 | New York | 81.0 |
| Congressional district 7 | California | 79.2 |
| Congressional district 9 | Massachusetts | 80.2 |
| Congressional district 2 | Rhode Island | 79.8 |
| Congressional district 42 | California | 80.4 |
| Congressional district 8 | New York | 81.1 |
| Congressional district 2 | New Hampshire | 79.9 |
| Congressional district 26 | California | 82.1 |
| Congressional district 4 | Colorado | 80.5 |
| Congressional district 16 | Ohio | 78.3 |
| Congressional district 2 | Maryland | 78.9 |
| Congressional district 31 | Texas | 80.5 |
| Congressional district 18 | Florida | 81.6 |
| Congressional district 7 | Florida | 80.2 |
| Congressional district 5 | New York | 82.9 |
| Congressional district 47 | California | 82.1 |
| Congressional district 1 | Minnesota | 81.9 |
| Congressional district 11 | Georgia | 79.2 |
| Congressional district 1 | Colorado | 79.2 |
| Congressional district 25 | New York | 79.8 |
| Congressional district 3 | Nevada | 78.4 |
| Congressional district 1 | Maine | 80.0 |
| Congressional district 1 | Maryland | 78.9 |
| Congressional district 5 | California | 80.7 |
| Congressional district 2 | Nebraska | 79.1 |
| Congressional district 4 | Maryland | 78.6 |
| Congressional district 4 | North Carolina | 79.8 |
| Congressional district 12 | Pennsylvania | 78.1 |
| Congressional district 7 | Maryland | 77.1 |
| Congressional district 25 | Texas | 78.9 |
| Congressional district 8 | Illinois | 80.4 |
| Congressional district 14 | Ohio | 78.4 |
| Congressional district 37 | California | 81.7 |
| Congressional district 7 | Colorado | 79.8 |
| Congressional district 1 | South Carolina | 79.6 |
| Congressional district 3 | Iowa | 79.3 |
| Congressional district 18 | Illinois | 78.8 |
| Congressional district 9 | Arizona | 80.4 |
| Congressional district 2 | Washington | 80.9 |
| Congressional district (at large) | Vermont | 79.9 |
| Congressional district 1 | New Jersey | 78.1 |
| Congressional district 2 | Hawaii | 81.8 |
| Congressional district 5 | Georgia | 78.6 |
| Congressional district 12 | Texas | 78.6 |
| Congressional district 3 | Oregon | 79.4 |
| Congressional district 6 | Alabama | 76.0 |
| Congressional district 13 | Pennsylvania | 77.9 |
| Congressional district 27 | New York | 78.7 |
| Congressional district 1 | Massachusetts | 79.7 |
| Congressional district 24 | New York | 79.6 |
| Congressional district (at large) | Alaska | 78.7 |
| Congressional district 8 | Texas | 78.3 |
| Congressional district 6 | Texas | 78.5 |
| Congressional district 1 | Wisconsin | 78.9 |
| Congressional district 5 | Colorado | 79.9 |
| Congressional district 15 | Pennsylvania | 79.6 |
| Congressional district 10 | New Jersey | 79.5 |
| Congressional district 24 | California | 81.8 |
| Congressional district 38 | California | 81.7 |
| Congressional district 1 | Illinois | 79.4 |
| Congressional district 26 | Florida | 81.6 |
| Congressional district 1 | Rhode Island | 80.0 |
| Congressional district 6 | Wisconsin | 80.0 |
| Congressional district 1 | Iowa | 80.1 |
| Congressional district 2 | Iowa | 79.2 |
| Congressional district 6 | Louisiana | 76.9 |
| Congressional district 50 | California | 81.4 |
| Congressional district 3 | Illinois | 79.3 |
| Congressional district 1 | Nebraska | 80.2 |
| Congressional district 8 | Wisconsin | 79.7 |
| Congressional district 4 | Utah | 79.9 |
| Congressional district 19 | New York | 79.4 |
| Congressional district 16 | Florida | 81.2 |
| Congressional district (at large) | Delaware | 78.5 |
| Congressional district 10 | Florida | 79.9 |
| Congressional district 8 | New Jersey | 80.2 |
| Congressional district 9 | Michigan | 78.8 |
| Congressional district 12 | Florida | 78.2 |
| Congressional district 12 | Michigan | 77.5 |
| Congressional district 4 | Pennsylvania | 79.4 |
| Congressional district 1 | Ohio | 77.7 |
| Congressional district (at large) | North Dakota | 79.9 |
| Congressional district 3 | Utah | 80.1 |
| Congressional district 7 | New York | 81.6 |
| Congressional district 2 | Utah | 80.2 |
| Congressional district 10 | Washington | 79.4 |
| Congressional district 27 | Florida | 81.8 |
| Congressional district 19 | Florida | 81.9 |
| Congressional district 6 | Washington | 79.4 |
| Congressional district 16 | Pennsylvania | 80.5 |
| Congressional district 3 | Michigan | 79.2 |
| Congressional district 14 | New York | 81.8 |
| Congressional district 4 | Virginia | 78.1 |
| Congressional district 26 | New York | 78.3 |
| Congressional district (at large) | Wyoming | 78.6 |
| Congressional district 3 | Washington | 79.2 |
| Congressional district 2 | Virginia | 78.6 |
| Congressional district 3 | Colorado | 79.6 |
| Congressional district 13 | Florida | 78.9 |
| Congressional district 16 | Illinois | 78.5 |
| Congressional district 4 | Georgia | 79.2 |
| Congressional district 15 | Florida | 79.1 |
| Congressional district 20 | California | 82.2 |
| Congressional district 13 | New York | 82.2 |
| Congressional district 25 | Florida | 82.4 |
| Congressional district 10 | Michigan | 78.2 |
| Congressional district 2 | South Carolina | 77.5 |
| Congressional district 2 | North Carolina | 78.4 |
| Congressional district 15 | Ohio | 77.2 |
| Congressional district 13 | Georgia | 78.3 |
| Congressional district 4 | Iowa | 80.0 |
| Congressional district 7 | Minnesota | 80.1 |
| Congressional district 6 | North Carolina | 77.8 |
| Congressional district 14 | Pennsylvania | 78.4 |
| Congressional district 5 | Ohio | 78.5 |
| Congressional district 6 | Missouri | 78.1 |
| Congressional district 1 | New Mexico | 79.0 |
| Congressional district 3 | Missouri | 78.3 |
| Congressional district 4 | Florida | 76.7 |
| Congressional district 1 | Utah | 79.8 |
| Congressional district 1 | Louisiana | 76.9 |
| Congressional district 5 | Oregon | 79.9 |
| Congressional district 4 | Kansas | 77.9 |
| Congressional district 5 | Virginia | 78.1 |
| Congressional district 3 | Kentucky | 76.8 |
| Congressional district 6 | Florida | 79.1 |
| Congressional district 13 | Illinois | 78.6 |
| Congressional district 5 | Washington | 79.2 |
| Congressional district 43 | California | 81.7 |
| Congressional district 32 | California | 81.7 |
| Congressional district 6 | California | 79.3 |
| Congressional district 3 | Wisconsin | 80.0 |
| Congressional district (at large) | South Dakota | 79.4 |
| Congressional district 4 | Kentucky | 77.1 |
| Congressional district 2 | Illinois | 79.1 |
| Congressional district 22 | New York | 79.3 |
| Congressional district 2 | Ohio | 76.7 |
| Congressional district 8 | Minnesota | 79.5 |
| Congressional district 8 | Florida | 79.1 |
| Congressional district 11 | Pennsylvania | 78.0 |
| Congressional district 5 | Tennessee | 77.1 |
| Congressional district 7 | Michigan | 78.7 |
| Congressional district 2 | Arizona | 79.4 |
| Congressional district 14 | Florida | 79.2 |
| Congressional district 7 | Tennessee | 77.3 |
| Congressional district 3 | Georgia | 77.1 |
| Congressional district 7 | Wisconsin | 79.4 |
| Congressional district 4 | Indiana | 78.5 |
| Congressional district 3 | Nebraska | 79.7 |
| Congressional district 14 | Texas | 77.8 |
| Congressional district 2 | Kansas | 77.8 |
| Congressional district 2 | Nevada | 77.8 |
| Congressional district 3 | California | 79.2 |
| Congressional district 8 | Tennessee | 75.7 |
| Congressional district 2 | Pennsylvania | 75.6 |
| Congressional district 2 | New Jersey | 77.6 |
| Congressional district 6 | Michigan | 78.8 |
| Congressional district 3 | New Mexico | 78.6 |
| Congressional district 1 | Indiana | 77.4 |
| Congressional district 21 | New York | 79.3 |
| Congressional district 9 | Indiana | 77.4 |
| Congressional district 10 | Ohio | 77.3 |
| Congressional district 2 | Michigan | 79.5 |
| Congressional district 1 | Oklahoma | 76.7 |
| Congressional district 17 | Texas | 79.1 |
| Congressional district 23 | New York | 78.8 |
| Congressional district 23 | California | 78.0 |
| Congressional district 8 | Ohio | 77.3 |
| Congressional district 9 | Florida | 79.9 |
| Congressional district 3 | Pennsylvania | 78.2 |
| Congressional district 1 | Idaho | 79.2 |
| Congressional district 5 | Alabama | 76.9 |
| Congressional district 12 | Illinois | 76.9 |
| Congressional district 4 | South Carolina | 77.3 |
| Congressional district 17 | Pennsylvania | 78.0 |
| Congressional district 5 | Missouri | 77.4 |
| Congressional district 36 | Texas | 77.0 |
| Congressional district 31 | California | 78.8 |
| Congressional district 1 | Missouri | 77.3 |
| Congressional district 9 | California | 79.4 |
| Congressional district 6 | Kentucky | 77.3 |
| Congressional district 3 | Indiana | 78.2 |
| Congressional district 24 | Florida | 81.6 |
| Congressional district 2 | Tennessee | 76.9 |
| Congressional district 1 | Kansas | 78.6 |
| Congressional district 15 | Illinois | 77.6 |
| Congressional district 2 | Arkansas | 77.1 |
| Congressional district 10 | Georgia | 77.6 |
| Congressional district (at large) | Montana | 78.5 |
| Congressional district 10 | Pennsylvania | 78.8 |
| Congressional district 22 | California | 78.7 |
| Congressional district 2 | Maine | 78.3 |
| Congressional district 5 | North Carolina | 77.8 |
| Congressional district 11 | Ohio | 77.5 |
| Congressional district 8 | California | 79.0 |
| Congressional district 1 | Arizona | 78.2 |
| Congressional district 5 | Pennsylvania | 78.5 |
| Congressional district 14 | Michigan | 77.6 |
| Congressional district 7 | Ohio | 78.2 |
| Congressional district 6 | Virginia | 78.1 |
| Congressional district 2 | Idaho | 79.3 |
| Congressional district 3 | Ohio | 77.3 |
| Congressional district 3 | Arkansas | 78.0 |
| Congressional district 4 | Nevada | 77.8 |
| Congressional district 4 | Ohio | 78.2 |
| Congressional district 1 | California | 78.3 |
| Congressional district 20 | Texas | 79.0 |
| Congressional district 17 | Florida | 80.3 |
| Congressional district 17 | Illinois | 78.2 |
| Congressional district 9 | Texas | 80.0 |
| Congressional district 8 | Indiana | 77.2 |
| Congressional district 3 | Florida | 77.5 |
| Congressional district 4 | Wisconsin | 77.6 |
| Congressional district 41 | California | 80.4 |
| Congressional district 9 | Pennsylvania | 77.9 |
| Congressional district 1 | Georgia | 77.3 |
| Congressional district 20 | Florida | 81.4 |
| Congressional district 3 | Oklahoma | 76.3 |
| Congressional district 2 | Florida | 77.6 |
| Congressional district 2 | West Virginia | 76.4 |
| Congressional district 4 | Oregon | 78.7 |
| Congressional district 36 | California | 80.4 |
| Congressional district 1 | Pennsylvania | 76.0 |
| Congressional district 10 | California | 78.4 |
| Congressional district 7 | North Carolina | 77.6 |
| Congressional district 5 | South Carolina | 76.0 |
| Congressional district 9 | Georgia | 78.3 |
| Congressional district 9 | Ohio | 77.5 |
| Congressional district 18 | Texas | 79.4 |
| Congressional district 2 | Oregon | 78.9 |
| Congressional district 1 | Florida | 77.3 |
| Congressional district 6 | Indiana | 76.9 |
| Congressional district 30 | Texas | 78.6 |
| Congressional district 3 | Louisiana | 76.1 |
| Congressional district 2 | Kentucky | 77.2 |
| Congressional district 16 | Texas | 79.9 |
| Congressional district 1 | Michigan | 78.9 |
| Congressional district 11 | Texas | 77.2 |
| Congressional district 10 | North Carolina | 77.0 |
| Congressional district 4 | Oklahoma | 76.3 |
| Congressional district 13 | Ohio | 77.4 |
| Congressional district 4 | Missouri | 77.9 |
| Congressional district 11 | North Carolina | 77.8 |
| Congressional district 2 | Indiana | 77.5 |
| Congressional district 5 | Oklahoma | 75.5 |
| Congressional district 4 | Michigan | 78.3 |
| Congressional district 46 | California | 82.6 |
| Congressional district 1 | West Virginia | 76.6 |
| Congressional district 4 | Arizona | 78.5 |
| Congressional district 23 | Texas | 79.2 |
| Congressional district 27 | Texas | 78.0 |
| Congressional district 4 | Tennessee | 76.5 |
| Congressional district 11 | Florida | 77.8 |
| Congressional district 3 | Mississippi | 75.1 |
| Congressional district 4 | Texas | 76.5 |
| Congressional district 4 | Washington | 79.3 |
| Congressional district 7 | Missouri | 77.6 |
| Congressional district 12 | North Carolina | 79.1 |
| Congressional district 4 | Illinois | 79.2 |
| Congressional district 29 | California | 81.7 |
| Congressional district 3 | South Carolina | 76.8 |
| Congressional district 8 | Georgia | 76.4 |
| Congressional district 13 | Texas | 77.0 |
| Congressional district 8 | North Carolina | 76.8 |
| Congressional district 5 | Texas | 77.1 |
| Congressional district 2 | Alabama | 76.2 |
| Congressional district 15 | Texas | 81.2 |
| Congressional district 3 | North Carolina | 77.9 |
| Congressional district 6 | Tennessee | 76.3 |
| Congressional district 6 | Ohio | 76.3 |
| Congressional district 3 | Tennessee | 75.9 |
| Congressional district 28 | Texas | 79.9 |
| Congressional district 51 | California | 81.6 |
| Congressional district 35 | Texas | 80.3 |
| Congressional district 3 | Arizona | 80.3 |
| Congressional district 2 | Louisiana | 76.7 |
| Congressional district 14 | Georgia | 76.4 |
| Congressional district 35 | California | 79.4 |
| Congressional district 3 | Virginia | 76.6 |
| Congressional district 1 | Alabama | 75.6 |
| Congressional district 1 | Mississippi | 75.8 |
| Congressional district 19 | Texas | 77.1 |
| Congressional district 3 | Alabama | 75.1 |
| Congressional district 4 | Louisiana | 75.8 |
| Congressional district 9 | Tennessee | 76.4 |
| Congressional district 44 | California | 81.7 |
| Congressional district 34 | California | 81.7 |
| Congressional district 5 | Michigan | 76.7 |
| Congressional district 12 | Georgia | 75.7 |
| Congressional district 9 | Virginia | 75.6 |
| Congressional district 1 | Texas | 76.3 |
| Congressional district 7 | Indiana | 76.5 |
| Congressional district 4 | Mississippi | 75.4 |
| Congressional district 2 | New Mexico | 77.8 |
| Congressional district 5 | Florida | 78.4 |
| Congressional district 1 | North Carolina | 77.3 |
| Congressional district 34 | Texas | 80.0 |
| Congressional district 1 | Nevada | 78.4 |
| Congressional district 4 | Arkansas | 75.0 |
| Congressional district 2 | Oklahoma | 74.5 |
| Congressional district 7 | Arizona | 80.4 |
| Congressional district 7 | South Carolina | 75.7 |
| Congressional district 1 | Kentucky | 75.5 |
| Congressional district 1 | Tennessee | 75.8 |
| Congressional district 6 | South Carolina | 76.9 |
| Congressional district 8 | Missouri | 75.4 |
| Congressional district 1 | Arkansas | 74.5 |
| Congressional district 16 | California | 79.2 |
| Congressional district 15 | New York | 79.4 |
| Congressional district 5 | Louisiana | 75.1 |
| Congressional district 40 | California | 81.7 |
| Congressional district 4 | Alabama | 73.8 |
| Congressional district 7 | Alabama | 74.9 |
| Congressional district 29 | Texas | 79.4 |
| Congressional district 13 | Michigan | 75.8 |
| Congressional district 2 | Georgia | 75.2 |
| Congressional district 2 | Mississippi | 73.6 |
| Congressional district 3 | West Virginia | 73.0 |
| Congressional district 33 | Texas | 78.8 |
| Congressional district 5 | Kentucky | 72.9 |
| Congressional district 21 | California | 78.4 |
State table:
| State | Life expectancy at birth 2018 (years) |
|---|---|
| 79.4 | |
| 75.3 | |
| 78.3 | |
| 79.7 | |
| 75.9 | |
| 81.5 | |
| 80.5 | |
| 81.0 | |
| 78.6 | |
| 78.5 | |
| 80.0 | |
| 77.7 | |
| 82.5 | |
| 79.3 | |
| 79.4 | |
| 77.2 | |
| 79.5 | |
| 78.8 | |
| 75.3 | |
| 76.2 | |
| 78.7 | |
| 79.2 | |
| 80.5 | |
| 81.0 | |
| 78.1 | |
| 74.8 | |
| 77.5 | |
| 78.5 | |
| 79.8 | |
| 78.3 | |
| 79.4 | |
| 80.5 | |
| 78.0 | |
| 81.3 | |
| 78.0 | |
| 79.9 | |
| 77.1 | |
| 76.0 | |
| 79.7 | |
| 78.3 | |
| 80.1 | |
| 77.0 | |
| 79.0 | |
| 76.1 | |
| 79.1 | |
| 79.6 | |
| 79.7 | |
| 79.5 | |
| 80.4 | |
| 75.0 | |
| 79.4 | |
| 79.1 |