Design of a questionnaire to gather statistically useful information about a given topic
Questionnaire construction refers to the design of a questionnaire to gather statistically useful information about a given topic. When properly constructed and responsibly administered, questionnaires can provide valuable data about any given subject.
Questionnaires are frequently used in quantitative marketing research and social research. They are a valuable method of collecting a wide range of information from a large number of individuals, often referred to as respondents.
What is often referred to as "adequate questionnaire construction" is critical to the success of a survey. Inappropriate questions, incorrect ordering of questions, incorrect scaling, or a bad questionnaire format can make the survey results valueless, as they may not accurately reflect the views and opinions of the participants.
Different methods can be useful for checking a questionnaire and making sure it is accurately capturing the intended information. Initial advice may include:
consulting subject-matter experts
using questionnaire construction guidelines to inform drafts, such as the Tailored Design Method,[1] or those produced by National Statistical Organisations.
Empirical tests also provide insight into the quality of the questionnaire. This can be done by:
conducting cognitive interviewing, asking a sample of potential-respondents about their interpretation of the questions and use of the questionnaire.
carrying out a small pretest of the questionnaire, using a small subset of target respondents. Results can inform a researcher of errors such as missing questions, or logical and procedural errors.
estimating the measurement quality of the questions. This can be done for instance using test-retest,[2] quasi-simplex,[3] or mutlitrait-multimethod models.[4]
predicting the measurement quality of the question. This can be done using the software Survey Quality Predictor (SQP).[5]
Test items
In the realm of psychological testing and questionnaires, an individual task or question is referred to as a test Item or item.[6][7] These items serve as fundamental components within questionnaire and psychological tests, often tied to a specific latent psychological construct (see operationalization). Each item produces a value, typically a raw score, which can be aggregated across all items to generate a composite score for the measured trait.
Test items generally encompass three primary components:
Item stem: This represents the question, statement, or task presented.
Answer format: The manner in which the respondent provides an answer, including options for multiple-choice questions.
Evaluation criteria: The criteria used to assess and score the response.
The degree of standardization varies, ranging from strictly prescribed questions with predetermined answers to open-ended questions with subjective evaluation criteria.
Responses to test items serve as indicators in the realm of social sciences.
Yes/no questions – The respondent answers with a "yes" or a "no".
Multiple choice – The respondent has several option from which to choose.
Scaled questions – Responses are graded on a continuum (e.g.: rate the appearance of the product on a scale from 1 to 10, with 10 being the most preferred appearance). Examples of types of scales include the Likert scale, semantic differential scale, and rank-order scale. (See scale for further information)
Matrix questions – Identical response categories are assigned to multiple questions. The questions are placed one under the other, forming a matrix with response categories along the top and a list of questions down the side. This is an efficient use of page space and the respondents' time.
Open-ended questions – No options or predefined categories are suggested. The respondent supplies their own answer without being constrained by a fixed set of possible responses. Examples include:
Completely unstructured – For example, "What is your opinion on questionnaires?"
Word association – Words are presented and the respondent mentions the first word that comes to mind.
Sentence completion – Respondents complete an incomplete sentence. For example, "The most important consideration in my decision to buy a new house is..."
Story completion – Respondents complete an incomplete story.
Picture completion – Respondents fill-in an empty speech balloon.
Thematic apperception test – Respondents explain a picture or create a story about what they think is happening in the picture.
Contingency question – A question that is answered only if the respondent gives a particular response to a previous question. This avoids asking questions of people that do not apply to them (for example, asking men if they have ever been pregnant).
Multi-item scales
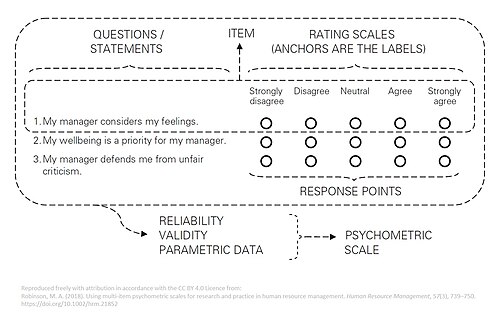
Labelled example of a multi-item psychometricscale as used in questionnaires
Within social science research and practice, questionnaires are most frequently used to collect quantitative data using multi-item scales with the following characteristics:[8]
Multiple statements or questions (minimum ≥3; usually ≥5) are presented for each variable being examined.
Each statement or question has an accompanying set of equidistant response-points (usually 5-7).
Each response point has an accompanying verbal anchor (e.g., “strongly agree”) ascending from left to right.
Verbal anchors should be balanced to reflect equal intervals between response-points.
Collectively, a set of response-points and accompanying verbal anchors are referred to as a rating scale. One very frequently-used rating scale is a Likert scale.
Usually, for clarity and efficiency, a single set of anchors is presented for multiple rating scales in a questionnaire.
Collectively, a statement or question with an accompanying rating scale is referred to as an item.
When multiple items measure the same variable in a reliable and valid way, they are collectively referred to as a multi-item scale, or a psychometric scale.
Pretesting is testing and evaluating whether a questionnaire causes problems that could affect data quality and data collection for interviewers or survey respondents.
Cognitive interviewing examines the respondent's thought process as they answer the questions or afterwards. The interviewer directs the respondent to think aloud or administer verbal probes.[12] It can also be conducted online without an interviewer.[13]
Usability testing focuses on how people interact with the survey, such as navigating the survey, entering survey responses, and finding help information.
Vignettes are short descriptions of hypothetical situations that are presented to research participants to examine their survey-relevant decisions.[14][15]
Behavioral coding (or behavior coding) monitors the interviewer and respondent' verbal interactions in live or recorded interviews, or from transcripts. Questions are identified as needing repair when certain behaviors are coded frequently, such as respondents asking for clarifications.[16][17]
Expert review is conducted by an individual expert or a panel of experts in questionnaire design to identify potential problems and solutions.[18]
Experimental comparisons test the impact of the revised items by comparing it with the original items.[9]
A multiple-method approach helps to triangulate results. For example, cognitive interviews, usability testing, behavior coding, and/or vignettes can be combined for pretesting.[15][19][11]
Questionnaire construction issues
Before constructing a questionnaire survey, it is advisable to consider how the results of the research will be used. If the results won't influence the decision-making process, budgets won't allow implementing the findings, or the cost of research outweighs its usefulness, then there is little purpose in conducting the research.
The research objective(s) and frame-of-reference should be defined beforehand, including the questionnaire's context of time, budget, manpower, intrusion and privacy. The types of questions (e.g.: closed, multiple-choice, open) should fit the data analysis techniques available and the goals of the survey.
The manner (random or not) and location (sampling frame) for selecting respondents will determine whether the findings will be representative of the larger population.
The level of measurement – known as the scale, index, or typology – will determine what can be concluded from the data. A yes/no question will only reveal how many of the sample group answered yes or no, lacking the resolution to determine an average response. The nature of the expected responses should be defined and retained for interpretation.
A common method is to "research backwards" in building a questionnaire by first determining the information sought (i.e., Brand A is more/less preferred by x% of the sample vs. Brand B, and y% vs. Brand C), then being certain to ask all the needed questions to obtain the metrics for the report. Unneeded questions should be avoided, as they are an expense to the researcher and an unwelcome imposition on the respondents. All questions should contribute to the objective(s) of the research.
Topics should fit the respondents' frame of reference, as their background may affect their interpretation of the questions. Respondents should have enough information or expertise to answer the questions truthfully. Writing style should be conversational, yet concise and accurate and appropriate to the target audience and subject matter. The wording should be kept simple, without technical or specialized vocabulary. Ambiguous words, equivocal sentence structures and negatives may cause misunderstanding, possibly invalidating questionnaire results. Double negatives should be reworded as positives.
If a survey question actually contains more than one issue, the researcher will not know which one the respondent is answering. Care should be taken to ask one question at a time.
Questions and prepared responses (for multiple-choice) should be neutral as to intended outcome. A biased question or questionnaire encourages respondents to answer one way rather than another.[20] Even questions without bias may leave respondents with expectations. The order or grouping of questions is also relevant; early questions may bias later questions. Loaded questions evoke emotional responses and may skew results.
The list of prepared responses should be collectively exhaustive; one solution is to use a final write-in category for "other________". The possible responses should also be mutually exclusive, without overlap. Respondents should not find themselves in more than one category, for example in both the "married" category and the "single" category (in such a case there may be need for separate questions on marital status and living situation).
Many people will not answer personal or intimate questions. For this reason, questions about age, income, marital status, etc. are generally placed at the end of the survey. This way, even if the respondent refuses to answer these questions, he/she will have already answered the research questions.
Visual presentation of the questions on the page (or computer screen) and use of white space, colors, pictures, charts, or other graphics may affect respondent's interest – or distract from the questions. There are four primary design elements: words (meaning), numbers (sequencing), symbols (e.g. arrow), and graphics (e.g. text boxes).[1] In translated questionnaires, the design elements also take into account the writing practice (e.g. Spanish words are lengthier and require more space on the page or on the computer screen) and text orientation (e.g. Arabic is read from right to left) to prevent data missingness.[21][22]
Questionnaires can be administered by research staff, by volunteers or self-administered by the respondents. Clear, detailed instructions are needed in either case, matching the needs of each audience
There are a number of channels, or modes, that can be used to administer a questionnaire. Each has strengths and weaknesses, and therefore a researcher will generally need to tailor their questionnaire to the modes they will be using. For example, a questionnaire designed to be filled-out on paper may not operate in the same way when administered by telephone. These mode effects may be substantial enough that they threaten the validity of the research.
Using multiple modes can improve access to the population of interest when some members have different access, or have particular preferences.
Method
Benefits and cautions
Postal
Usually a simple questionnaire, printed on paper to be filled-out with a pen or pencil.
Low cost-per-response for small samples. Large samples can often be administered more efficiently by using optical character recognition.
Mail is subject to postal delays and errors, which can be substantial when posting to remote areas, or given unpredictable events such as natural disasters.
Surveys are limited to populations that are contactable by a mail service.
Reliant on high levels of literacy
Allows survey participants to remain anonymous (e.g. using identical paper forms).
Limited ability to build rapport with the respondent, or to answer questions about the purpose of the research.
Telephone
Questionnaires can be conducted swiftly, particularly if computer-assisted.
Opportunity to build rapport with respondents may improve response rates.
Researchers may be mistaken for being telemarketers.
Surveys are limited to populations with a telephone.
Are more prone to social desirability biases than other modes, so telephone interviews are generally not suitable for sensitive topics.[23][24]
Electronic
Usually administered via a HTML-based webpage, or other electronic channel such as a smartphone app.
This method has a low ongoing-cost, and most surveys cost little for the participants and surveyors. However, initial set-up costs can be high for a customised design due to the effort required in developing the back-end system or programming the questionnaire itself.
Questionnaires can be conducted swiftly, without postal delays.
Survey participants can choose to remain anonymous, though risk being tracked through cookies, unique links and other technology.
It is not labour-intensive.
Questions can be more detailed, as opposed to the limits of paper or telephones.[25]
This method works well if the survey contains several branching questions. Help or instructions can be dynamically displayed with the question as needed, and automatic sequencing means the computer can determine the next question, rather than relying on respondents to correctly follow skip instructions.
Not all of the sample may be able to use the electronic form due to accessibility issues, software compatibility, bandwidth requirements, server load, or internet access, and therefore results may not be representative of the target population.
Personally administered
Questions can be more detailed and obtains more comprehensive information. However, respondents are often limited to their working memory: specially designed visual cues (such as prompt cards) may help in some cases.
Interviewers sometimes rephrase questions during the interview, reducing the level of standardisation. Computer-assisted personal interviewing may assist with this.
Rapport with respondents is generally higher than other modes.
Typically higher response-rate than other modes.
Can be extremely expensive and time-consuming to train and maintain an interviewer panel. Each interview also has a cost associated with collecting the data.
Relatively few limits to the population, so long as an interviewer is granted access.
The way that a question is phrased can have a large impact on how a research participant will answer the question.[26] Thus, survey researchers must be conscious of their wording when writing survey questions.[26] It is important for researchers to keep in mind that different individuals, cultures, and subcultures can interpret certain words and phrases differently from one another.[26]
There are two different types of questions that survey researchers use when writing a questionnaire: free-response questions and closed questions.[26] Free-response questions are open-ended, whereas closed questions are usually multiple-choice.[26] Free-response questions are beneficial because they allow the responder greater flexibility, but they are also very difficult to record and score, requiring extensive coding.[26] Contrastingly, closed questions can be scored and coded more easily, but they diminish expressivity and spontaneity of the responder.[26] Some problems with the wording of questions are obvious and may be intentional, particularly in psuedopolls, whose sponsors are seeking specific results. [27] Wording problems can arise on routine topics in legtimate surveyss [27] If question wording can affect measurement of relatively objective matters, such as a person's age, the number of children in a family, or the frequency of news watching, then how much might wording affect more subjective phenomena?[27]
In general, the vocabulary of a question should be very simple and direct, and preferably under twenty words.[26] Each question should be edited for readability and should avoid leading or loaded questions.[26] If multiple questions are being used to measure one construct, some of the questions should be worded in the opposite direction to evade response bias.[26]
A respondent's answer to an open-ended question can be coded into a response scale afterwards,[28] or analysed using more qualitative methods. Two studies demonstrate both the importance of question wording and the differential impact it can have on different subsets of citizens.[27] The first study examined how the use of the terms "global warming" versus "climate change" influenced Americans' opinions about the world's changing environment.[29] Another study also demonstrates the importance of question wording and how it affects subsets of respondents.[30]
Questions should flow logically, from the general to the specific, from least to most sensitive, from factual and behavioral matters to attitudes and opinions. When semi-automated, they should flow from unaided to aided questions. The researcher should ensure that the answer to a question is not influenced by previous questions.
According to the three-stage theory (also called the sandwich theory), questions should be asked in three stages:[citation needed]
1 2 Dillman, Don A., Smyth, Jolene D., Christian, Leah Melani. 2014. Internet, Phone, Mail and Mixed-Mode Surveys: The Tailored Design Method, 4th edition. John Wiley: Hoboken, NJ
↑ Lord, Frederic M. (1968). Statistical theories of mental test scores. Addison-Wesley Publishing Company. OCLC769112327.[pageneeded]
↑ Heise, David R. (February 1969). "Separating Reliability and Stability in Test-Retest Correlation". American Sociological Review. 34 (1): 93–101. doi:10.2307/2092790. JSTOR2092790.
↑ Andrews, Frank M. (1984). "Construct Validity and Error Components of Survey Measures: A Structural Modeling Approach". Public Opinion Quarterly. 48 (2): 409–42=42. doi:10.1086/268840.
↑ Osterlind, Steven J. (2002). "Definition, Purpose, and Characteristics of Items". Constructing Test Items. Evaluation in Education and Human Services. Vol.47. pp.17–57. doi:10.1007/0-306-47535-9_2. ISBN0-7923-8077-0.
1 2 Presser, S.; Couper, M. P.; Lessler, J. T.; Martin, E.; Martin, J.; Rothgeb, J. M.; Singer, E. (March 2004). "Methods for Testing and Evaluating Survey Questions". Public Opinion Quarterly. 68 (1): 109–130. doi:10.1093/poq/nfh008.
↑ "Web Probing". GESIS - Leibniz Institute for the Social Sciences. Retrieved 2023-10-24.
↑ Martin, Elizabeth (2004). "Vignettes and Respondent Debriefing for Questionnaire Design and Evaluation". Methods for Testing and Evaluating Survey Questionnaires. pp.149–171. doi:10.1002/0471654728.ch8. ISBN978-0-471-45841-8.
↑ Kapousouz, Evgenia; Johnson, Timothy; Holbrook, Allyson (2020). "Seeking Clarifications for Problematic Questions: Effects of Interview Language and Respondent Acculturation". In Sha, Mandy; Gabel, Tim (eds.). The essential role of language in survey research. RTI Press. pp.23–46. doi:10.3768/rtipress.bk.0023.2004. ISBN978-1-934831-23-6.
↑ Yan, T.; Kreuter, F.; Tourangeau, R (December 2012). "Evaluating Survey Questions: A Comparison of Methods". Journal of Official Statistics. 28 (4): 503–529.
↑ Aizpurua, Eva (2020). "Pretesting Methods in Cross-Cultural Research". In Sha, Mandy; Gabel, Tim (eds.). The Essential Role of Language in Survey Research. pp.129–150. doi:10.3768/rtipress.bk.0023.2004. ISBN978-1-934831-24-3.
↑ M. Mandy, Sha; Wang, Kevin (2013). "A Comparison of Results from a Spanish and English Mail Survey: Effects of Instruction Placement on Item Missingness". Survey Methods. doi:10.13094/SMIF-2013-00006.
↑ Kreuter, F.; Presser, S.; Tourangeau, R. (December 2008). "Social Desirability Bias in CATI, IVR, and Web Surveys: The Effects of Mode and Question Sensitivity". Public Opinion Quarterly. 72 (5): 847–865. doi:10.1093/poq/nfn063.
↑ Holbrook, Allyson L.; Green, Melanie C.; Krosnick, Jon A. (2003). "Telephone versus Face-to-Face Interviewing of National Probability Samples with Long Questionnaires". Public Opinion Quarterly. 67 (1): 79–125. doi:10.1086/346010.
1 2 3 4 Asher, Herb (2017). Polling and the Public, 9th edition.
↑ Mellenbergh, G.J. (2008). Chapter 9: Surveys. In H.J. Adèr & G.J. Mellenbergh (Eds.) (with contributions by D.J. Hand), Advising on Research Methods: A consultant's companion (pp. 183–209). Huizen, The Netherlands: Johannes van Kessel Publishing.
↑ Schuldt, J. P.; Konrath, S. H.; Schwarz, N. (1 March 2011). "'Global warming' or 'climate change'?: Whether the planet is warming depends on question wording". Public Opinion Quarterly. 75 (1): 115–124. doi:10.1093/poq/nfq073.
This page is based on this Wikipedia article Text is available under the CC BY-SA 4.0 license; additional terms may apply. Images, videos and audio are available under their respective licenses.