Real estate bubble

Last updated

A real estate bubble or property bubble (or housing bubble for residential markets) is a type of economic bubble that occurs periodically in local or global real estate markets, and typically follow a land boom. [1] A land boom is the rapid increase in the market price of real property such as housing until they reach unsustainable levels and then decline. This period, during the run up to the crash, is also known as froth. The questions of whether real estate bubbles can be identified and prevented, and whether they have broader macroeconomic significance, are answered differently by schools of economic thought, as detailed below. [1] [2]

Contents

Bubbles in housing markets are more critical than stock market bubbles. Historically, equity price busts occur on average every 13 years, last for 2.5 years, and result in about 4 percent loss in GDP. Housing price busts are less frequent, but last nearly twice as long and lead to output losses that are twice as large (IMF World Economic Outlook, 2003). A recent laboratory experimental study [3] also shows that, compared to financial markets, real estate markets involve longer boom and bust periods. Prices decline slower because the real estate market is less liquid.

The financial crisis of 2007–2008 was related to the bursting of real estate bubbles that had begun in various countries during the 2000s. [4]

Identification and prevention

US house price trend (1998-2008) as measured by the Case-Shiller index Case-shiller-index-values.jpg
US house price trend (1998–2008) as measured by the Case–Shiller index
Ratio of Melbourne median house prices to Australian annual wages, 1965 to 2010 Real Melbourne House Prices 1965 - 2010b.JPG
Ratio of Melbourne median house prices to Australian annual wages, 1965 to 2010

As with all types of economic bubbles, disagreement exists over whether or not a real estate bubble can be identified or predicted, then perhaps prevented. Speculative bubbles are persistent, systematic and increasing deviations of actual prices from their fundamental values. [5] Real estate bubbles can be difficult to identify even as they are occurring, due in part to the difficulty of discerning the intrinsic value of real estate. As with other medium and long range economic trends, accurate prediction of future bubbles has proven difficult. [1]

In real estate, fundamentals can be estimated from rental yields (where real estate is then considered in a similar vein to stocks and other financial assets) or based on a regression of actual prices on a set of demand and/or supply variables. [6] [7]

American economist Robert Shiller of the Case–Shiller Home Price Index of home prices in 20 metro cities across the United States indicated on May 31, 2011 that a "Home Price Double Dip [is] Confirmed" [8] and British magazine The Economist, argue that housing market indicators can be used to identify real estate bubbles. Some[ who? ] argue further that governments and central banks can and should take action to prevent bubbles from forming, or to deflate existing bubbles.

Macroeconomic significance

Within mainstream economics, economic bubbles, and in particular real estate bubbles, are not considered major concerns.[ dubious ] Within some schools of heterodox economics, by contrast, real estate bubbles are considered of critical importance and a fundamental cause of financial crises and ensuing economic crises.

The pre-dominating economic perspective is that increases in housing prices result in little or no wealth effect, namely it does not affect the consumption behavior of households not looking to sell. The house price becoming compensation for the higher implicit rent costs for owning. Increasing house prices can have a negative effect on consumption through increased rent inflation and a higher propensity to save given expected rent increase. [9]

In some schools of heterodox economics, notably Austrian economics and Post-Keynesian economics, real estate bubbles are seen as an example of credit bubbles (pejoratively,[ clarification needed ] speculative bubbles), because property owners generally use borrowed money to purchase property, in the form of mortgages. These are then argued to cause financial and hence economic crises. This is first argued empirically – numerous real estate bubbles have been followed by economic slumps, and it is argued that there is a cause-effect relationship between these.

The Post-Keynesian theory of debt deflation takes a demand-side view, arguing that property owners not only feel richer but borrow to (i) consume against the increased value of their property – by taking out a home equity line of credit, for instance; or (ii) speculate by buying property with borrowed money in the expectation that it will rise in value. When the bubble bursts, the value of the property decreases but not the level of debt. The burden of repaying or defaulting on the loan depresses aggregate demand, it is argued, and constitutes the proximate cause of the subsequent economic slump.

Housing market indicators

UK house prices between 1975 and 2006, adjusted for inflation Graph-house-prices-1975-2006.gif
UK house prices between 1975 and 2006, adjusted for inflation
Robert Shiller's plot of U.S. home prices, population, building costs, and bond yields, from Irrational Exuberance, 2d ed. Shiller shows that inflation adjusted U.S. home prices increased 0.4% per year from 1890-2004, and 0.7% per year from 1940-2004, whereas U.S. census data from 1940-2004 shows that the self-assessed value increased 2% per year. Shiller IE2 Fig 2-1.png
Robert Shiller's plot of U.S. home prices, population, building costs, and bond yields, from Irrational Exuberance , 2d ed. Shiller shows that inflation adjusted U.S. home prices increased 0.4% per year from 1890–2004, and 0.7% per year from 1940–2004, whereas U.S. census data from 1940–2004 shows that the self-assessed value increased 2% per year.

In attempting to identify bubbles before they burst, economists have developed a number of financial ratios and economic indicators that can be used to evaluate whether homes in a given area are fairly valued. By comparing current levels to previous levels that have proven unsustainable in the past (i.e. led to or at least accompanied crashes), one can make an educated guess as to whether a given real estate market is experiencing a bubble. Indicators describe two interwoven aspects of housing bubble: a valuation component and a debt (or leverage) component. The valuation component measures how expensive houses are relative to what most people can afford, and the debt component measures how indebted households become in buying them for home or profit (and also how much exposure the banks accumulate by lending for them). A basic summary of the progress of housing indicators for U.S. cities is provided by Business Week . [10] See also: real estate economics and real estate trends.

Housing affordability measures

Inflation-adjusted home prices in Japan (1980-2005) compared to home price appreciation in the United States, Britain, and Australia (1995-2005) EconomistHomePrices20050615.jpg
Inflation-adjusted home prices in Japan (1980–2005) compared to home price appreciation in the United States, Britain, and Australia (1995–2005)

Housing debt measures

Housing ownership and rent measures

The house price-to-earnings ratio provides a direct comparison with P/E ratios utilised to analyze other uses of the money tied up in a home. Compare this ratio to the simpler but less accurate price-rent ratio below.
The latter is often measured using the "owner's equivalent rent" numbers published by the Bureau of Labor Statistics. It can be viewed as the real estate equivalent of stocks' price-earnings ratio; in other terms it measures how much the buyer is paying for each dollar of received rent income (or dollar saved from rent spending). Rents, just like corporate and personal incomes, are generally tied very closely to supply and demand fundamentals; one rarely sees an unsustainable "rent bubble" (or "income bubble" for that matter).[ citation needed ] Therefore a rapid increase of home prices combined with a flat renting market can signal the onset of a bubble. The U.S. price-rent ratio was 18% higher than its long-run average as of October 2004. [18]
This is the reciprocal of the house price-rent ratio. The net rental yield deducts the landlord's expenses (and sometimes estimated rental voids) from the gross rent before doing the above calculation; this is the reciprocal of the house P/E ratio.
Because rents are received throughout the year rather than at its end, both the gross and net rental yields calculated by the above are somewhat less than the true rental yields obtained when taking into account the monthly nature of rental payments.

Housing price indices

The Case-Shiller index 1890-2016, showing a housing bubble peaking in 2006 Case-Shiller Index.svg
The Case–Shiller index 1890–2016, showing a housing bubble peaking in 2006

Measures of house price are also used in identifying housing bubbles; these are known as house price indices (HPIs).

A noted series of HPIs for the United States are the Case–Shiller indices, devised by American economists Karl Case, Robert J. Shiller, and Allan Weiss. As measured by the Case–Shiller index, the US experienced a housing bubble peaking in the second quarter of 2006 (2006 Q2).

Recent real estate bubbles

The crash of the Japanese asset price bubble from 1990 on has been very damaging to the Japanese economy. [19] The crash in 2005 affected Shanghai, China's largest city. [20]

As of 2007, real estate bubbles had existed in the recent past or were widely believed to still exist in many parts of the world. [21] including Argentina, [22] New Zealand, Ireland, Spain, Lebanon, Poland, [23] and Croatia. [24] Then U.S. Federal Reserve Chairman Alan Greenspan said in mid-2005 that "at a minimum, there's a little 'froth' (in the U.S. housing market) … it's hard not to see that there are a lot of local bubbles." [25] The Economist magazine, writing at the same time, went further, saying "the worldwide rise in house prices is the biggest bubble in history". [26]

In France, the economist Jacques Friggit publishes each year a study called "Evolution of the price, value and number of property sales in France since the 19th century", [27] showing a high price increase since 2001. Yet, the existence of a real estate bubble in France is discussed by economists. [28] Real estate bubbles are invariably followed by severe price decreases (also known as a house price crash) that can result in many owners holding mortgages that exceed the value of their homes. [29] 11.1 million residential properties, or 23.1% of all U.S. homes, were in negative equity at December 31, 2010. [30] Commercial property values remained around 35% below their mid-2007 peak in the United Kingdom. As a result, banks have become less willing to hold large amounts of property-backed debt, likely a key issue affecting the worldwide recovery in the short term.

By 2006, most areas of the world were thought to be in a bubble state, although this hypothesis, based upon the observation of similar patterns in real estate markets of a wide variety of countries, [31] was subject to controversy. Such patterns include those of overvaluation and, by extension, excessive borrowing based on those overvaluations. [32] [33] The U.S. subprime mortgage crisis of 2007–2010, alongside its impacts and effects on economies in various nations, has implied that these trends might have some[ which? ] common characteristics. [21]

For individual countries, see:

US real estate bubble 2012–present

The Washington Post writer Lisa Sturtevant thinks that the housing market of 2013 was not indicative of a housing bubble. "A critical difference between the current market and the overheated market of the middle of last decade is the nature of the mortgage market. Stricter underwriting standards have limited the pool of potential homebuyers to those who are most qualified and most likely to be able to pay loans back. The demand this time is based more closely on market fundamentals. And the price growth we’ve experienced recently is 'real.' Or 'more real.'" [35] Other recent research indicates that mid-level managers in securitized finance did not exhibit awareness of problems in overall housing markets. [36]

Economist David Stockman believes that a second housing bubble was started in 2012 and still inflating as of February 2013. [37] Housing inventory began to dwindle starting in early 2012 as hedge fund investors and private equity firms purchase single-family homes in hopes of renting them out while waiting for a housing rebound. [38] Due to the policies of QE3, mortgage interest rates have been hovering at an all-time low, causing real estate values to rise. Home prices have risen unnaturally as much as 25% within one year in metropolitan areas like the San Francisco Bay Area and Las Vegas. [39]

See also

Related Research Articles

This aims to be a complete list of the articles on real estate.

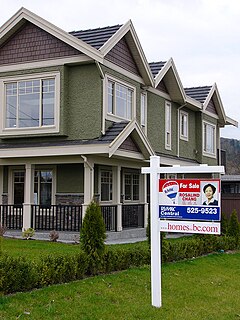
Owner-occupancy or home-ownership is a form of housing tenure in which a person, called the owner-occupier, owner-occupant, or home owner, owns the home in which they live. The home can be a house, such as a single-family house, an apartment, condominium, or a housing cooperative. In addition to providing housing, owner-occupancy also functions as a real estate investment.

Household debt

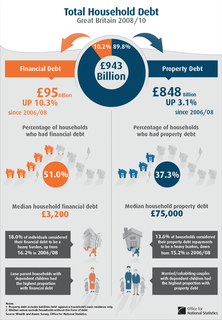
Household debt is defined as the combined debt of all people in a household. It includes consumer debt and mortgage loans. A significant rise in the level of this debt coincides historically with many severe economic crises and was a cause of the U.S. and subsequent European economic crises of 2007–2012. Several economists have argued that lowering this debt is essential to economic recovery in the U.S. and selected Eurozone countries.

Real estate economics application of economic techniques to real estate markets

Real estate economics is the application of economic techniques to real estate markets. It tries to describe, explain, and predict patterns of prices, supply, and demand. The closely related field of housing economics is narrower in scope, concentrating on residential real estate markets, while the research on real estate trends focuses on the business and structural changes affecting the industry. Both draw on partial equilibrium analysis, urban economics, spatial economics, basic and extensive research, surveys, and finance.

Second mortgage

Second mortgages, commonly referred to as junior liens, are loans secured by a property in addition to the primary mortgage. Depending on the time at which the second mortgage is originated, the loan can be structured as either a standalone second mortgage or piggyback second mortgage. Whilst a standalone second mortgage is opened subsequent to the primary loan, those with a piggyback loan structure are originated simultaneously with the primary mortgage. With regard to the method in which funds are withdrawn, second mortgages can be arranged as home equity loans or home equity lines of credit. Home equity loans are granted for the full amount at the time of loan origination in contrast to home equity lines of credit which permit the homeowner access to a predetermined amount which is repaid during the repayment period.

United States housing bubble Economic bubble

The United States housing bubble was a real estate bubble affecting over half of the U.S. states. It was the impetus for the subprime mortgage crisis. Housing prices peaked in early 2006, started to decline in 2006 and 2007, and reached new lows in 2012. On December 30, 2008, the Case–Shiller home price index reported its largest price drop in its history. The credit crisis resulting from the bursting of the housing bubble is an important cause of the Great Recession in the United States.

Housing bubble

A housing bubble is one of several types of asset price bubbles which periodically occur in the market. The basic concept of a housing bubble is the same as for other asset bubbles, consisting of two main phases. First there is a period where house prices increase dramatically, driven more and more by speculation. In the second phase, house prices fall dramatically. Housing bubbles tend to be among the asset bubbles with the largest effect on the real economy, because they are credit-fueled, because a large number of households participate and not just investors, and because the wealth effect from housing tends to be larger than for other types of financial assets.

Irish property bubble Irish mid 2000s asset price bubble

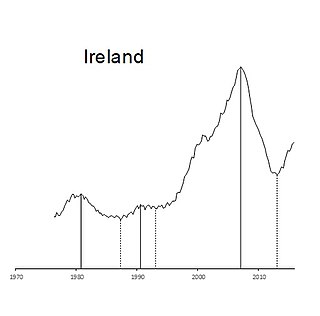
The Irish property bubble was the speculative excess element of a long-term price increase of real estate in the Republic of Ireland from the early 2000s to 2007, a period known as the later part of the Celtic Tiger. In 2006, the prices peaked at the top of the bubble, with a combination of increased speculative construction and rapidly rising prices; in 2007 the prices first stabilised and then started to fall until 2010 following the shock effect of the Great Recession. By the second quarter of 2010, house prices in Ireland had fallen by 35% compared with the second quarter of 2007, and the number of housing loans approved fell by 73%.

Capitalization rate is a real estate valuation measure used to compare different real estate investments. Although there are many variations, a cap rate is often calculated as the ratio between the net operating income produced by an asset and current market value.

Affordable housing Housing affordable to those with a median household income

Affordable housing is housing which is deemed affordable to those with a median household income or below as rated by the national government or a local government by a recognized housing affordability index. Most of the literature on affordable housing refers to mortgages and number of forms that exist along a continuum – from emergency shelters, to transitional housing, to non-market rental, to formal and informal rental, indigenous housing, and ending with affordable home ownership.

Real estate investing involves the purchase, ownership, management, rental and/or sale of real estate for profit. Improvement of realty property as part of a real estate investment strategy is generally considered to be a sub-specialty of real estate investing called real estate development. Real estate is an asset form with limited liquidity relative to other investments. It is also capital intensive and is highly cash flow dependent. If these factors are not well understood and managed by the investor, real estate becomes a risky investment.

Robert J. Shiller American economist (born 1946)

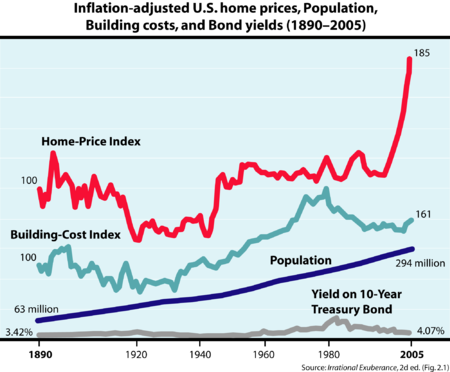
Robert James Shiller is an American economist, academic, and best-selling author. As of 2019, he serves as a Sterling Professor of Economics at Yale University and is a fellow at the Yale School of Management's International Center for Finance. Shiller has been a research associate of the National Bureau of Economic Research (NBER) since 1980, was vice president of the American Economic Association in 2005, its president-elect for 2016, and president of the Eastern Economic Association for 2006–2007. He is also the co‑founder and chief economist of the investment management firm MacroMarkets LLC.

United States housing prices experienced a major market correction after the housing bubble that peaked in early 2006. Prices of real estate then adjusted downwards in late 2006, causing a loss of market liquidity and subprime defaults

Causes of the United States housing bubble

Observers and analysts have attributed the reasons for the 2001–2006 housing bubble and its 2007–10 collapse in the United States to "everyone from home buyers to Wall Street, mortgage brokers to Alan Greenspan". Other factors that are named include "Mortgage underwriters, investment banks, rating agencies, and investors", "low mortgage interest rates, low short-term interest rates, relaxed standards for mortgage loans, and irrational exuberance" Politicians in both the Democratic and Republican political parties have been cited for "pushing to keep derivatives unregulated" and "with rare exceptions" giving Fannie Mae and Freddie Mac "unwavering support".

Karl Edwin "Chip" Case was Professor of Economics Emeritus at Wellesley College in Wellesley, Massachusetts, United States, where he held the Coman and Hepburn Chair in Economics and taught for 34 years. He was a Senior Fellow at the Joint Center for Housing Studies at Harvard University and was President of the Boston Economic Club 2011-12. Professor Case was also a founding partner in the real estate research firm of Fiserv Case Shiller Weiss, Inc., which created the S&P Case Shiller Index of home prices. He served as a member of the Board of Directors of the Depositors Insurance Fund of Massachusetts. He was a member of the Standard and Poor’s Index Advisory Committee, the Academic Advisory Board of the Federal Reserve Bank of Boston and the Board of Advisors of the Rappaport Institute for Greater Boston at Harvard University. He served as a member of the Boards of Directors of the Mortgage Guaranty Insurance Corporation (MGIC), Century Bank, The Lincoln Institute of Land Policy, and the American Real Estate and Urban Economics Association. He was also an Associate Editor of The Journal of Economic Perspectives and The Journal of Economics Education.

Australian property bubble

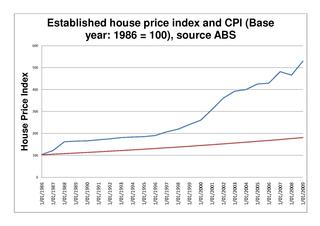
The Australian property bubble is the economic theory that the Australian property market has become or is becoming significantly overpriced and due for a significant downturn. Since the early 2010s, various commentators, including one Treasury official, have claimed the Australian property market is in a significant bubble.

Chinese property bubble (2005–2011)

The 2005 Chinese property bubble was a real estate bubble in residential and commercial real estate in China. The New York Times reported that the bubble started to deflate in 2011, while observing increased complaints that members of the middle-class were unable to afford homes in large cities. The deflation of the property bubble is seen as one of the primary causes for China's declining economic growth in 2013.

Real estate in China is developed and managed by public, private, and state-owned red chip enterprises. In the years leading up to the 2008 financial crisis, the real estate sector in China was growing so rapidly that the government implemented a series of policies—including raising the required downpayment for some property purchases, and five 2007 interest rate increases—due to concerns of overheating. But after the crisis hit, these policies were quickly eliminated, and in some cases tightened. Beijing also launched a massive stimulus package to boost growth, and much of the stimulus wound up flowing into the property market and driving prices upward, resulting in investors increasingly looking abroad. By late 2014, the IMF warned that a real estate oversupply problem had arisen that threatened to cause detrimental effects to the Chinese economy, particularly in 2nd and 3rd tier cities. As of 2015, the market was experiencing low growth and the central government had eased prior measures to tighten interest rates, increase deposits and impose restrictions. By early 2016, the Chinese government introduced a series of measures to increase property purchases, including lower taxes on home sales, limiting land sales for new development projects, and the third in a series of mortgage down payment reductions.

Property investment calculator is a term used to define an application that provides fundamental financial analysis underpinning the purchase, ownership, management, rental and/or sale of real estate for profit. Property investment calculators are typically driven by mathematical finance models and converted into source code. Key concepts that drive property investment calculators include returns, cash flow, affordability of financing, investment strategy, equity and risk management.

The Canadian property bubble refers to a significant rise in Canadian real estate prices from 2002 to present which some observers have called a real estate bubble. From 2003 to 2018, Canada saw an increase in home and property prices of up to 337% in some cities.

References

  1. 1 2 3 Mayer, Christopher (September 2011). "Housing Bubbles: A Survey". Annual Review of Economics. 3 (1): 559–577. doi:10.1146/annurev.economics.012809.103822. ISSN   1941-1383.
  2. Staff, Investopedia. "What Is a Housing Bubble?". Investopedia. Retrieved April 5, 2021.
  3. Ikromov, Nuridding and Abdullah Yavas, 2012a, "Asset Characteristics and Boom and Bust Periods: An Experimental Study". Real Estate Economics. 40, 508–535.
  4. Klein, Ezra (May 28, 2009). "Bill Clinton and the Housing Bubble". Washington Post. Retrieved September 22, 2011.
  5. Brooks, Chris; Katsaris, Apostolos (2005). "Trading rules from forecasting the collapse of speculative bubbles for the S&P 500 composite index" (PDF). The Journal of Business . 78 (5): 2003–2036. doi:10.1086/431450. ISSN   0740-9168.
  6. Nneji, Ogonna; Brooks, Chris; Ward, Charles (2013). "Intrinsic and rational speculative bubbles in the U.S. housing market 1960-2011". Journal of Real Estate Research. 35 (2): 121–151. doi:10.1080/10835547.2013.12091360. ISSN   0896-5803.
  7. Nneji, Ogonna; Brooks, Chris; Ward, Charles W.R. (2013). "House price dynamics and their reaction to macroeconomic changes" (PDF). Economic Modeling. 32: 172–178. doi:10.1016/j.econmod.2013.02.007. ISSN   0264-9993.
  8. Christie, Les (May 31, 2011). "Home prices: 'Double-dip' confirmed". CNN Money.
  9. Nocera, Andrea (June 2017). "House prices and monetary polic in the Euro area: a structural VAR analysis" (PDF). European Central Bank - Working Papers (2073).
  10. "Interactive Table: How Bubbly Is Your Housing Market?". Business Week. April 11, 2005. Archived from the original on November 20, 2007. Retrieved June 23, 2009.
  11. seek.estate
  12. "Home - SecurityNational Mortgage Company". snmcblog.com. Retrieved January 6, 2017.
  13. "Affordable Housing Real Estate Resource: Housing Affordability Index". National Association of Realtors. Retrieved June 23, 2009.
  14. seek.estate
  15. "10th Annual Demographia International Housing Affordability Survey: 2014" (PDF). Retrieved November 11, 2014.
  16. June 2, 2005 report
  17. Wallison, Peter J (January 5, 2014), "The Bubble is Back", The New York Times, New York, p. A15, retrieved April 14, 2014
  18. Krainer, John; Wei, Chishen (October 1, 2004). "House Prices and Fundamental Value". Federal Reserve Bank of San Francisco.Cite journal requires |journal= (help)
  19. Fackler, Martin (December 25, 2005). "Take It From Japan: Bubbles Hurt". New York Times. Retrieved June 23, 2009.
  20. Lee, Don (January 8, 2006). "A Home Boom Busts". Los Angeles Times. Retrieved June 23, 2009.
  21. 1 2 Putland, Gavin R. (June 1, 2009). "From the subprime to the terrigenous: Recession begins at home". Land Values Research Group. Retrieved June 23, 2009.
  22. "The good times are here again". Global Property Guide. February 28, 2008. Retrieved June 23, 2009.
  23. "The end of Poland's house price boom". Global Property Guide. August 25, 2008. Retrieved June 23, 2009.
  24. "Real estate prices in Adriatic Coast up, Zagreb down". Global Property Guide. August 19, 2008. Retrieved June 23, 2009.
  25. Leonhardt, David (December 25, 2005). "2005: In a Word: Frothy". New York Times. Retrieved June 23, 2009.
  26. "The global housing boom". The Economist. June 16, 2005.
  27. "The French housing market and its environment since 1800". Conseil Général de l'Environnement et du Développement Durable. Retrieved December 21, 2016.
  28. "Bulle immobilière : de quoi parle-t-on et que faut-il craindre ?". Ideal-investisseur. Retrieved December 21, 2016.
  29. Kellington, Tom (2021-05-25). "What happens when real estate bubbles pop?". The Business Daily. Retrieved 2021-05-26.
  30. Philyaw, Jason (8 March 2011). "Underwater mortgages back above 11 million in 4Q". CoreLogic. Retrieved April 14, 2014.
  31. "House Prices Worldwide". Global Property Guide. Retrieved June 23, 2009.
  32. "Headlines in the financial press ranged from “Property slowdown fuels China fears” to “China property correction would be painful, but salutary” (Financial Times, 2014e, p. 3). Housing demand has been increasing due to higher incomes, rapid urbanization and China’s rural urban migration strategy"
  33. "The ups and downs of the real estate market and its relations with the rest of the economy in China". Real Estate, Construction and Economic Development in Emerging Market Economies. 2015. pp. 108–124. doi:10.4324/9781315762289-13. ISBN   9781315762289.
  34. Bajaj, Vikas; Leonhardt, David (December 18, 2008). "Tax Break May Have Helped Cause Housing Bubble". New York Times. Retrieved May 6, 2012.
  35. Sturtevant, Lisa A. (March 26, 2013). "Is the Washington, D.C.-area housing market bubbling again?". The Washington Post.
  36. Wall Street and the Housing Bubble, Princeton University, September 2013
  37. "This is Housing Bubble 2.0: David Stockman".
  38. StreetAuthority (January 15, 2013). "Why Blackstone Bought 16,000 Homes". SeekingAlpha.com. Retrieved January 6, 2017.
  39. "Comeback for California Housing Prices". NBCLosAngeles.com. Retrieved January 6, 2017.

Further reading