Electrocardiography is the process of producing an electrocardiogram, a recording of the heart's electrical activity through repeated cardiac cycles. It is an electrogram of the heart which is a graph of voltage versus time of the electrical activity of the heart using electrodes placed on the skin. These electrodes detect the small electrical changes that are a consequence of cardiac muscle depolarization followed by repolarization during each cardiac cycle (heartbeat). Changes in the normal ECG pattern occur in numerous cardiac abnormalities, including:

Third-degree atrioventricular block is a medical condition in which the electrical impulse generated in the sinoatrial node in the atrium of the heart can not propagate to the ventricles.

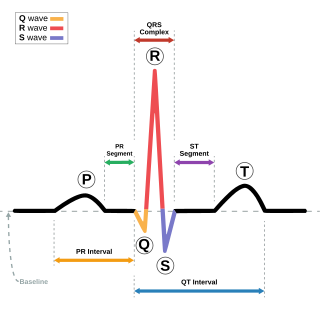
In electrocardiography, the T wave represents the repolarization of the ventricles. The interval from the beginning of the QRS complex to the apex of the T wave is referred to as the absolute refractory period. The last half of the T wave is referred to as the relative refractory period or vulnerable period. The T wave contains more information than the QT interval. The T wave can be described by its symmetry, skewness, slope of ascending and descending limbs, amplitude and subintervals like the Tpeak–Tend interval.

A bundle branch block is a defect in one of the bundle branches in the electrical conduction system of the heart.
The QRS complex is the combination of three of the graphical deflections seen on a typical electrocardiogram. It is usually the central and most visually obvious part of the tracing. It corresponds to the depolarization of the right and left ventricles of the heart and contraction of the large ventricular muscles.
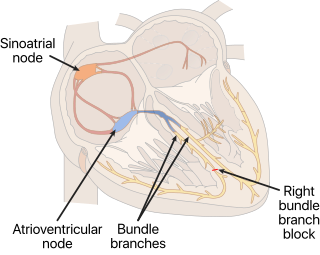
A right bundle branch block (RBBB) is a heart block in the right bundle branch of the electrical conduction system.

Acute coronary syndrome (ACS) is a syndrome due to decreased blood flow in the coronary arteries such that part of the heart muscle is unable to function properly or dies. The most common symptom is centrally located pressure-like chest pain, often radiating to the left shoulder or angle of the jaw, and associated with nausea and sweating. Many people with acute coronary syndromes present with symptoms other than chest pain, particularly women, older people, and people with diabetes mellitus.

Left bundle branch block (LBBB) is a conduction abnormality in the heart that can be seen on an electrocardiogram (ECG). In this condition, activation of the left ventricle of the heart is delayed, which causes the left ventricle to contract later than the right ventricle.

Eptifibatide, is an antiplatelet drug of the glycoprotein IIb/IIIa inhibitor class. Eptifibatide is a cyclic heptapeptide derived from a disintegrin protein found in the venom of the southeastern pygmy rattlesnake. It belongs to the class of the arginin-glycin-aspartat-mimetics and reversibly binds to platelets. Eptifibatide has a short half-life. The drug is the third inhibitor of GPIIb/IIIa that has found broad acceptance after the specific antibody abciximab and the non-peptide tirofiban entered the global market.

The electrical axis of the heart is the net direction in which the wave of depolarization travels. It is measured using an electrocardiogram (ECG). Normally, this begins at the sinoatrial node ; from here the wave of depolarisation travels down to the apex of the heart. The hexaxial reference system can be used to visualise the directions in which the depolarisation wave may travel.

Left anterior fascicular block (LAFB) is an abnormal condition of the left ventricle of the heart, related to, but distinguished from, left bundle branch block (LBBB).

A myocardial infarction (MI), commonly known as a heart attack, occurs when blood flow decreases or stops in one of the coronary arteries of the heart, causing infarction to the heart muscle. The most common symptom is chest pain or discomfort which may travel into the shoulder, arm, back, neck or jaw. Often such pain occurs in the center or left side of the chest and lasts for more than a few minutes. The discomfort may occasionally feel like heartburn. Other symptoms may include shortness of breath, nausea, feeling faint, a cold sweat, feeling tired, and decreased level of consciousness. About 30% of people have atypical symptoms. Women more often present without chest pain and instead have neck pain, arm pain or feel tired. Among those over 75 years old, about 5% have had an MI with little or no history of symptoms. An MI may cause heart failure, an irregular heartbeat, cardiogenic shock or cardiac arrest.

ST elevation refers to a finding on an electrocardiogram wherein the trace in the ST segment is abnormally high above the baseline.

ST depression refers to a finding on an electrocardiogram, wherein the trace in the ST segment is abnormally low below the baseline.
In electrocardiography, the PR interval is the period, measured in milliseconds, that extends from the beginning of the P wave until the beginning of the QRS complex ; it is normally between 120 and 200 ms in duration. The PR interval is sometimes termed the PQ interval.

The P wave on the ECG represents atrial depolarization, which results in atrial contraction, or atrial systole.

Electrocardiography in suspected myocardial infarction has the main purpose of detecting ischemia or acute coronary injury in emergency department populations coming for symptoms of myocardial infarction (MI). Also, it can distinguish clinically different types of myocardial infarction.

Management of acute coronary syndrome is targeted against the effects of reduced blood flow to the affected area of the heart muscle, usually because of a blood clot in one of the coronary arteries, the vessels that supply oxygenated blood to the myocardium. This is achieved with urgent hospitalization and medical therapy, including drugs that relieve chest pain and reduce the size of the infarct, and drugs that inhibit clot formation; for a subset of patients invasive measures are also employed. Basic principles of management are the same for all types of acute coronary syndrome. However, some important aspects of treatment depend on the presence or absence of elevation of the ST segment on the electrocardiogram, which classifies cases upon presentation to either ST segment elevation myocardial infarction (STEMI) or non-ST elevation acute coronary syndrome (NST-ACS); the latter includes unstable angina and non-ST elevation myocardial infarction (NSTEMI). Treatment is generally more aggressive for STEMI patients, and reperfusion therapy is more often reserved for them. Long-term therapy is necessary for prevention of recurrent events and complications.
Sgarbossa's criteria are a set of electrocardiographic findings generally used to identify myocardial infarction in the presence of a left bundle branch block (LBBB) or a ventricular paced rhythm.

High frequency QRS (HFQRS) refers to the analysis of the high frequency spectral components of the QRS complex in an electrocardiogram (ECG). High frequency analysis of the QRS complex may be useful for detection of coronary artery disease during an exercise stress test. It however requires special software.

