Use of real time monitoring of the heart in an intensive care unit in a German hospital (2015), the monitoring screen above the patient displaying an electrocardiogram and various values of parameters of the heart like heart rate and blood pressure
Electrocardiography is the process of producing an electrocardiogram (ECG or EKG[a]), a recording of the heart's electrical activity through repeated cardiac cycles.[4] It is an electrogram of the heart which is a graph of voltage versus time of the electrical activity of the heart[5] using electrodes placed on the skin. These electrodes detect the small electrical changes that are a consequence of cardiac muscledepolarization followed by repolarization during each cardiac cycle (heartbeat). Changes in the normal ECG pattern occur in numerous cardiac abnormalities, including:
Traditionally, "ECG" usually means a 12-lead ECG taken while lying down as discussed below. However, other devices can record the electrical activity of the heart such as a Holter monitor but also some models of smartwatch are capable of recording an ECG. ECG signals can be recorded in other contexts with other devices.
In a conventional 12-lead ECG, ten electrodes are placed on the patient's limbs and on the surface of the chest. The overall magnitude of the heart's electrical potential is then measured from twelve different angles ("leads") and is recorded over a period of time (usually ten seconds). In this way, the overall magnitude and direction of the heart's electrical depolarization is captured at each moment throughout the cardiac cycle.[11]
The T wave, which represents repolarization of the ventricles.
During each heartbeat, a healthy heart has an orderly progression of depolarization that starts with pacemaker cells in the sinoatrial node, spreads throughout the atrium, and passes through the atrioventricular node down into the bundle of His and into the Purkinje fibers, spreading down and to the left throughout the ventricles.[12] This orderly pattern of depolarization gives rise to the characteristic ECG tracing. To the trained clinician, an ECG conveys a large amount of information about the structure of the heart and the function of its electrical conduction system.[13] Among other things, an ECG can be used to measure the rate and rhythm of heartbeats, the size and position of the heart chambers, the presence of any damage to the heart's muscle cells or conduction system, the effects of heart drugs, and the function of implanted pacemakers.[14]
Medical uses
Normal 12-lead ECGA 12-lead ECG of a 26-year-old male with an incomplete right bundle branch block (RBBB)
The overall goal of performing an ECG is to obtain information about the electrical functioning of the heart. Medical uses for this information are varied and often need to be combined with knowledge of the structure of the heart and physical examination signs to be interpreted. Some indications for performing an ECG include the following:
Chest pain or suspected myocardial infarction (heart attack), such as ST elevated myocardial infarction (STEMI)[15] or non-ST elevated myocardial infarction (NSTEMI)[16]
ECGs can be recorded as short intermittent tracings or continuous ECG monitoring. Continuous monitoring is used for critically ill patients, patients undergoing general anesthesia,[18][17] and patients who have an infrequently occurring cardiac arrhythmia that would unlikely be seen on a conventional ten-second ECG. Continuous monitoring can be conducted by using Holter monitors, internal and external defibrillators and pacemakers, and/or biotelemetry.[19]
Screening
A patient undergoing an ECG
For adults, evidence does not support the use of ECGs among those without symptoms or at low risk of cardiovascular disease as an effort for prevention.[20][21][22] This is because an ECG may falsely indicate the existence of a problem, leading to misdiagnosis, the recommendation of invasive procedures, and overtreatment. However, persons employed in certain critical occupations, such as aircraft pilots,[23] may be required to have an ECG as part of their routine health evaluations. Hypertrophic cardiomyopathy screening may also be considered in adolescents as part of a sports physical out of concern for sudden cardiac death.[24]
Electrocardiograph machines
An ECG electrode
Mechanical cardiographs (apex cardiogram), developed in the 19th century, recorded heart movements by transmitting heart or chest wall motions to a spring and air chamber system. A writing lever traced these movements onto a smoked rotating cylinder, producing a cardiogram. Their accuracy was limited, as they captured all body movements, introducing errors.[25]
Modern day electrocardiograms are recorded by machines that consist of a set of electrodes connected to a central unit.[26]
In the late 19th century, scientists discovered the heart's electrical activity, leading to the electrocardiograph's development. Willem Einthoven's 1903 string galvanometer enabled precise measurement of these signals, revolutionizing cardiography. He received the 1924 Nobel Prize for this work.
Early ECG machines were constructed with analog electronics, where the signal drove a motor to print out the signal onto paper. Today, electrocardiographs use analog-to-digital converters to convert the electrical activity of the heart to a digital signal. Many ECG machines are now portable and commonly include a screen, keyboard, and printer on a small wheeled cart. Recent advancements in electrocardiography include developing even smaller devices for inclusion in fitness trackers and smart watches.[27] These smaller devices often rely on only two electrodes to deliver a single lead I.[28] Portable twelve-lead devices powered by batteries are also available.
Recording an ECG is a safe and painless procedure.[29] The machines are powered by mains power but they are designed with several safety features including an earthed (ground) lead. Other features include:
Defibrillation protection: any ECG used in healthcare may be attached to a person who requires defibrillation and the ECG needs to protect itself from this source of energy.
Electrostatic discharge is similar to defibrillation discharge and requires voltage protection up to 18,000 volts.
Simultaneous lead recordings: earlier designs recorded each lead sequentially, but current models record multiple leads simultaneously.
Most modern ECG machines include automated interpretationalgorithms. This analysis calculates features such as the PR interval, QT interval, corrected QT (QTc) interval, PR axis, QRS axis, rhythm and more. The results from these automated algorithms are considered "preliminary" until verified and/or modified by expert interpretation. Despite recent advances, computer misinterpretation remains a significant problem[update] and can result in clinical mismanagement.[30]
Besides the standard electrocardiograph machine, there are other devices that can record ECG signals. Portable devices have existed since the Holter monitor was introduced in 1962.
Traditionally, these monitors have used electrodes with patches on the skin to record the ECG, but new devices can stick to the chest as a single patch without need for wires, developed by Zio (Zio XT), TZ Medical (Trident), Philips (BioTel) and BardyDx (CAM) among many others. Implantable devices such as the artificial cardiac pacemaker and implantable cardioverter-defibrillator are capable of measuring a "far field" signal between the leads in the heart and the implanted battery/generator that resembles an ECG signal (technically, the signal recorded in the heart is called an electrogram, which is interpreted differently). The development of the Holter monitor led to the creation of the implantable loop recorder, which performs the same function but is an implantable device with batteries that last for years.
Additionally, there are available various Arduino kits with ECG sensor modules and smartwatch devices that are capable of recording an ECG signal as well, such as with the 4th generation Apple Watch (2018), Samsung Galaxy Watch 4 (2021) and newer devices.
Electrodes and leads
Proper placement of the limb electrodes. The limb electrodes can be far down on the limbs or close to the hips/shoulders as long as they are placed symmetrically.Placement of European-color-coded ECG electrodes (using a 10-electrode yoke)Placement of the precordial electrodes
Electrodes are the actual conductive pads attached to the body surface.[32] Any pair of electrodes can measure the electrical potential difference between the two corresponding locations of attachment. Such a pair forms a lead. However, "leads" can also be formed between a physical electrode and a virtual electrode, which is the average of numerous leads. All clinical ECGs use Wilson's central terminal (WCT) as the virtual electrode from which the precordial leads are measured, whose potential is defined as the average potential measured by the three standard limb leads.[33]
Commonly, 10 electrodes attached to the body are used to form 12 ECG leads, with each lead measuring a specific electrical potential difference.[34]
12-lead ECG
Leads are broken down into three types: limb; augmented limb; and precordial or chest. A 12-lead ECG has a total of three limb leads and three augmented limb leads arranged like spokes of a wheel in the coronal plane (vertical), and six precordial leads or chest leads that lie on the perpendicular transverse plane (horizontal).[35]
Electrodes should be placed in standard positions, with 'left' or 'right' referring to anatomical directions, being the patient's left or right. Exceptions due to emergency or other issues should be recorded to avoid erroneous analysis.[36]
The 12 standard ECG leads and electrodes are listed below.[37] All leads are effectively bipolar, with one positive and one negative electrode; the term "unipolar" is not true, nor useful.[33]
Along the same horizontal line as V4 and V5 in the mid-axillary line.
Two types of electrodes in common use are a flat paper-thin sticker and a self-adhesive circular pad. The former are typically used in a single ECG recording while the latter are for continuous recordings as they stick longer. Each electrode consists of an electrically conductive electrolyte gel and a silver/silver chloride conductor.[38] The gel typically contains potassium chloride – sometimes silver chloride as well – to permit electron conduction from the skin to the wire and to the electrocardiogram.[39]
Virtual electrode
The virtual electrode is used to obtain useful measurements from the precordial leads, and also allows the creation of the augmented limb leads.
The virtual electrode is known as Wilson's central terminal (WCT). For the precordial leads, WCT is formed by averaging the three standard limb leads (I, II, and III):
WCT is therefore a virtual electrode which sits slightly posteriorly to the heart. It is a useful point, from which the electrical potential of the precordial leads is measured.[33]
WCT used to be used as a reference for the virtual limb leads, however use in this way produced leads with very small amplitudes. Goldberger's modification is now used to produce each augmented limb lead, aVF, aVR, and aVL, which produces 50% larger amplitude leads than the standard WCT. Goldberger's WCT is formed according to the following:[33]
In a 12-lead ECG, all leads except the limb leads are assumed to be unipolar (aVR, aVL, aVF, V1, V2, V3, V4, V5, and V6). The measurement of a voltage requires two contacts and so, electrically, the unipolar leads are measured from the common lead (negative) and the unipolar lead (positive). This averaging for the common lead and the abstract unipolar lead concept makes for a more challenging understanding and is complicated by sloppy usage of "lead" and "electrode". In fact, instead of being a constant reference, VW has a value that fluctuates throughout the heart cycle. It also does not truly represent the center-of-heart potential due to the body parts the signals travel through.[40] Because voltage is by definition a bipolar measurement between two points, describing an electrocardiographic lead as "unipolar" makes little sense electrically and should be avoided. The American Heart Association states "All leads are effectively 'bipolar,' and the term 'unipolar' in description of the augmented limb leads and the precordial leads lacks precision."[41]
Limb leads
The limb leads and augmented limb leads (Wilson's central terminal is used as the negative pole for the latter in this representation)
Leads I, II and III are called the limb leads. The electrodes that form these signals are located on the limbs – one on each arm and one on the left leg.[42][43] The limb leads form the points of what is known as Einthoven's triangle.[44]
Lead I is the voltage between the (positive) left arm (LA) electrode and right arm (RA) electrode:
Lead II is the voltage between the (positive) left leg (LL) electrode and the right arm (RA) electrode:
Lead III is the voltage between the (positive) left leg (LL) electrode and the left arm (LA) electrode:
Augmented limb leads
Leads aVR, aVL, and aVF are the augmented limb leads. They are derived from the same three electrodes as leads I, II, and III, but they use Goldberger's central terminal as their negative pole. Goldberger's central terminal is a combination of inputs from two limb electrodes, with a different combination for each augmented lead. It is referred to immediately below as "the negative pole".
Lead augmented vector right (aVR) has the positive electrode on the right arm. The negative pole is a combination of the left arm electrode and the left leg electrode:
Lead augmented vector left (aVL) has the positive electrode on the left arm. The negative pole is a combination of the right arm electrode and the left leg electrode:
Lead augmented vector foot (aVF) has the positive electrode on the left leg. The negative pole is a combination of the right arm electrode and the left arm electrode:
Together with leads I, II, and III, augmented limb leads aVR, aVL, and aVF form the basis of the hexaxial reference system, which is used to calculate the heart's electrical axis in the frontal plane.[45]
Older versions of the nodes (VR, VL, VF) use Wilson's central terminal as the negative pole, but the amplitude is too small for the thick lines of old ECG machines. The Goldberger terminals scale up (augments) the Wilson results by 50%, at the cost of sacrificing physical correctness by not having the same negative pole for all three.[46]
Precordial leads
The precordial leads lie in the transverse (horizontal) plane, perpendicular to the other six leads. The six precordial electrodes act as the positive poles for the six corresponding precordial leads: (V1, V2, V3, V4, V5, and V6). Wilson's central terminal is used as the negative pole. Recently, unipolar precordial leads have been used to create bipolar precordial leads that explore the right to left axis in the horizontal plane.[47]
Specialized leads
Additional electrodes may rarely be placed to generate other leads for specific diagnostic purposes. Right-sided precordial leads may be used to better study pathology of the right ventricle or for dextrocardia (and are denoted with an R (e.g., V5R). Posterior leads (V7 to V9) may be used to demonstrate the presence of a posterior myocardial infarction. The Lewis lead or S5-lead (requiring an electrode at the right sternal border in the second intercostal space) can be used to better detect atrial activity in relation to that of the ventricles.[48]
An intracardiac electrogram (ICEG) is essentially an ECG with some added intracardiac leads (that is, inside the heart). The standard ECG leads (external leads) are I, II, III, aVL, V1, and V6. Two to four intracardiac leads are added via cardiac catheterization. The word "electrogram" (EGM) without further specification usually means an intracardiac electrogram.[51]
Lead locations on an ECG report
A standard 12-lead ECG report (an electrocardiograph) shows a 2.5 second tracing of each of the twelve leads. The tracings are most commonly arranged in a grid of four columns and three rows. The first column is the limb leads (I, II, and III), the second column is the augmented limb leads (aVR, aVL, and aVF), and the last two columns are the precordial leads (V1 to V6). Additionally, a rhythm strip may be included as a fourth or fifth row.[45]
The timing across the page is continuous and notes tracings of the 12 leads for the same time period. In other words, if the output were traced by needles on paper, each row would switch which leads as the paper is pulled under the needle. For example, the top row would first trace lead I, then switch to lead aVR, then switch to V1, and then switch to V4, and so none of these four tracings of the leads are from the same time period as they are traced in sequence through time.[52]
Contiguity of leads
Diagram showing the contiguous leads in the same color in the standard 12-lead layout
Each of the 12 ECG leads records the electrical activity of the heart from a different angle, and therefore align with different anatomical areas of the heart. Two leads that look at neighboring anatomical areas are said to be contiguous.[45]
In addition, any two precordial leads next to one another are considered to be contiguous. For example, though V4 is an anterior lead and V5 is a lateral lead, they are contiguous because they are next to one another.
The study of the conduction system of the heart is called cardiac electrophysiology (EP). An EP study is performed via a right-sided cardiac catheterization: a wire with an electrode at its tip is inserted into the right heart chambers from a peripheral vein, and placed in various positions in close proximity to the conduction system so that the electrical activity of that system can be recorded.[citation needed]
Standard catheter positions for an EP study include "high right atrium" or hRA near the sinus node, a "His" across the septal wall of the tricuspid valve to measure bundle of His, a "coronary sinus" into the coronary sinus, and a "right ventricle" in the apex of the right ventricle.[53]
Interpretation
Interpretation of the ECG is fundamentally about understanding the electrical conduction system of the heart. Normal conduction starts and propagates in a predictable pattern, and deviation from this pattern can be a normal variation or be pathological. An ECG does not equate with mechanical pumping activity of the heart; for example, pulseless electrical activity produces an ECG that should pump blood but no pulses are felt (and constitutes a medical emergency and CPR should be performed). Ventricular fibrillation produces an ECG but is too dysfunctional to produce a life-sustaining cardiac output. Certain rhythms are known to have good cardiac output and some are known to have bad cardiac output. Ultimately, an echocardiogram or other anatomical imaging modality is useful in assessing the mechanical function of the heart.[54]
Like all medical tests, what constitutes "normal" is based on population studies. The heartrate range of between 60 and 100 beats per minute (bpm) is considered normal since data shows this to be the usual resting heart rate.[55]
Theory
QRS is upright in a lead when its axis is aligned with that lead's vectorSchematic representation of a normal ECG
Interpretation of the ECG is ultimately that of pattern recognition. In order to understand the patterns found, it is helpful to understand the theory of what ECGs represent. The theory is rooted in electromagnetics and boils down to the four following points:[56]
depolarization of the heart toward the positive electrode produces a positive deflection
depolarization of the heart away from the positive electrode produces a negative deflection
repolarization of the heart toward the positive electrode produces a negative deflection
repolarization of the heart away from the positive electrode produces a positive deflection
Thus, the overall direction of depolarization and repolarization produces positive or negative deflection on each lead's trace. For example, depolarizing from right to left would produce a positive deflection in lead I because the two vectors point in the same direction. In contrast, that same depolarization would produce minimal deflection in V1 and V2 because the vectors are perpendicular, and this phenomenon is called isoelectric.
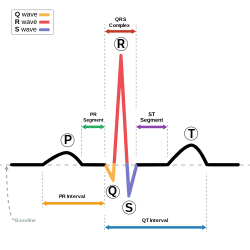
Normal rhythm produces four entities – a P wave, a QRS complex, a T wave, and a U wave – that each have a fairly unique pattern.
The P wave represents atrial depolarization.
The QRS complex represents ventricular depolarization.
The T wave represents ventricular repolarization.
The U wave represents papillary muscle repolarization.
Changes in the structure of the heart and its surroundings (including blood composition) change the patterns of these four entities.
The U wave is not typically seen and its absence is generally ignored. Atrial repolarization is typically hidden in the much more prominent QRS complex and normally cannot be seen without additional, specialized electrodes.
Background grid
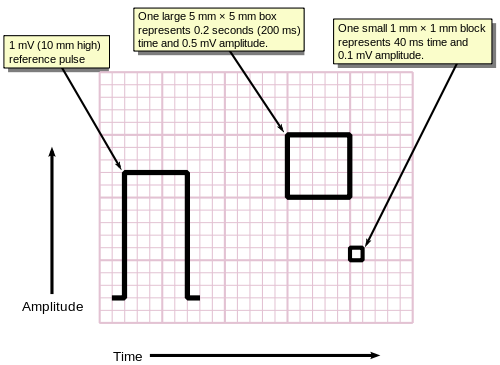
ECGs are normally printed on a grid. The horizontal axis represents time and the vertical axis represents voltage. The standard values on this grid are shown in the adjacent image at 25mm/sec (or 40ms per mm):[57]
A small box is 1mm × 1mm and represents 0.1 mV × 0.04 seconds.
A large box is 5mm × 5mm and represents 0.5 mV × 0.20 seconds.
The "large" box is represented by a heavier line weight than the small boxes.
Measuring time and voltage with ECG graph paper
The standard printing speed in the United States is 25mm per sec (5 big boxes per second), but in other countries it can be 50mm per sec. Faster speeds such as 100 and 200mm per sec are used during electrophysiology studies.
Not all aspects of an ECG rely on precise recordings or having a known scaling of amplitude or time. For example, determining if the tracing is a sinus rhythm only requires feature recognition and matching, and not measurement of amplitudes or times (i.e., the scale of the grids are irrelevant). An example to the contrary, the voltage requirements of left ventricular hypertrophy require knowing the grid scale.
Rate and rhythm
In a normal heart, the heart rate is the rate at which the sinoatrial node depolarizes since it is the source of depolarization of the heart. Heart rate, like other vital signs such as blood pressure and respiratory rate, change with age. In adults, a normal heart rate is between 60 and 100 bpm (normocardic), whereas it is higher in children.[58] A heart rate below normal is called "bradycardia" (<60 in adults) and above normal is called "tachycardia" (>100 in adults). A complication of this is when the atria and ventricles are not in synchrony and the "heart rate" must be specified as atrial or ventricular (e.g., the ventricular rate in ventricular fibrillation is 300–600 bpm, whereas the atrial rate can be normal [60–100] or faster [100–150]).[citation needed]
In normal resting hearts, the physiologic rhythm of the heart is normal sinus rhythm (NSR). Normal sinus rhythm produces the prototypical pattern of P wave, QRS complex, and T wave. Generally, deviation from normal sinus rhythm is considered a cardiac arrhythmia. Thus, the first question in interpreting an ECG is whether or not there is a sinus rhythm. A criterion for sinus rhythm is that P waves and QRS complexes appear 1-to-1, thus implying that the P wave causes the QRS complex.[52]
Once sinus rhythm is established, or not, the second question is the rate. For a sinus rhythm, this is either the rate of P waves or QRS complexes since they are 1-to-1. If the rate is too fast, then it is sinus tachycardia, and if it is too slow, then it is sinus bradycardia.
If it is not a sinus rhythm, then determining the rhythm is necessary before proceeding with further interpretation. Some arrhythmias with characteristic findings:
Absent P waves with "irregularly irregular" QRS complexes are the hallmark of atrial fibrillation.
A "saw tooth" pattern with QRS complexes is the hallmark of atrial flutter.
Determination of rate and rhythm is necessary in order to make sense of further interpretation.
Axis
Diagram showing how the polarity of the QRS complex in leads I, II, and III can be used to estimate the heart's electrical axis in the frontal plane.
The heart has several axes, but the most common by far is the axis of the QRS complex (references to "the axis" imply the QRS axis). Each axis can be computationally determined to result in a number representing degrees of deviation from zero, or it can be categorized into a few types.[59]
The QRS axis is the general direction of the ventricular depolarization wavefront (or mean electrical vector) in the frontal plane. It is often sufficient to classify the axis as one of three types: normal, left deviated, or right deviated. Population data shows that a normal QRS axis is from −30° to 105°, with 0° being along lead I and positive being inferior and negative being superior (best understood graphically as the hexaxial reference system).[60] Beyond +105° is right axis deviation and beyond −30° is left axis deviation (the third quadrant of −90° to −180° is very rare and is an indeterminate axis). A shortcut for determining if the QRS axis is normal is if the QRS complex is mostly positive in lead I and lead II (or lead I and aVF if +90° is the upper limit of normal).[61]
The normal QRS axis is generally down and to the left, following the anatomical orientation of the heart within the chest. An abnormal axis suggests a change in the physical shape and orientation of the heart or a defect in its conduction system that causes the ventricles to depolarize in an abnormal way.[52]
Rarely seen; considered an 'electrical no-man's land'
The extent of a normal axis can be +90° or 105° depending on the source.
Amplitudes and intervals
Animation of a normal ECG waveSchematic representation of a normal ECG
All of the waves on an ECG tracing and the intervals between them have a predictable time duration, a range of acceptable amplitudes (voltages), and a typical morphology. Any deviation from the normal tracing is potentially pathological and therefore of clinical significance.[62]
For ease of measuring the amplitudes and intervals, an ECG is printed on graph paper at a standard scale: each 1mm (one small box on the standard 25mm/s ECG paper) represents 40 milliseconds of time on the x-axis, and 0.1 millivolts on the y-axis.[63]
The P wave represents depolarization of the atria. Atrial depolarization spreads from the SA node towards the AV node, and from the right atrium to the left atrium.
The P wave is typically upright in most leads except for aVR; an unusual P wave axis (inverted in other leads) can indicate an ectopic atrial pacemaker. If the P wave is of unusually long duration, it may represent atrial enlargement. Typically a large right atrium gives a tall, peaked P wave while a large left atrium gives a two-humped bifid P wave.
The PR interval is measured from the beginning of the P wave to the beginning of the QRS complex. This interval reflects the time the electrical impulse takes to travel from the sinus node through the AV node.
A PR interval shorter than 120 ms suggests that the electrical impulse is bypassing the AV node, as in Wolff-Parkinson-White syndrome. A PR interval consistently longer than 200 ms diagnoses first degree atrioventricular block. The PR segment (the portion of the tracing after the P wave and before the QRS complex) is typically completely flat, but may be depressed in pericarditis.
The QRS complex represents the rapid depolarization of the right and left ventricles. The ventricles have a greater muscle mass proportion compared to the atria, hence the QRS complex usually has a much larger amplitude than the P wave.
The QT interval is measured from the beginning of the QRS complex to the end of the T wave. Acceptable ranges vary with heart rate, so it must be corrected to the QTc by dividing by the square root of the RR interval.
A prolonged QTc interval is a risk factor for ventricular tachyarrhythmias and sudden death. Long QT can arise as a genetic syndrome, or as a side effect of certain medications. An unusually short QTc can be seen in severe hypercalcemia.
The U wave is hypothesized to be caused by the repolarization of the interventricular septum. It normally has a low amplitude, and even more often is completely absent.
A very prominent U wave can be a sign of hypokalemia, hypercalcemia or hyperthyroidism.[65]
Time-frequency analysis in ECG signal processing
In electrocardiogram (ECG) signal processing, time-frequency analysis (TFA) is an important technique used to reveal how the frequency characteristics of ECG signals change over time, especially in non-stationary signals such as arrhythmias or transient cardiac events.
Simple to implement, suitable for analyzing steady or near-steady heart rhythms and easy to perform using Fast Fourier Transform (FFT).
Time and frequency resolution are affected by window length, making it difficult to efficiently capture both short-term and long-term variations simultaneously.
Suitable for fully non-stationary and nonlinear signals.
Provides instantaneous frequency distribution.
Susceptible to mode mixing issues.
Detection of transient heart rate variability.
Steps
Step 1: Preprocessing
Signal Denoising: Use wavelet denoising, band-pass filtering (0.5–50 Hz), or Principal Component Analysis (PCA) to remove electromyographic (EMG) noise.
Signal Segmentation: Segment the signal based on heartbeat cycles (e.g., R-wave detection).
Step 2: Select an Appropriate TFA Method
Choose methods such as STFT, WT, or HHT based on the application requirements.
Step 3: Compute the Time-Frequency Spectrum
Calculate the time-frequency distribution using the selected method to generate a time-frequency representation.
Step 4: Feature Extraction
Extract power features from specific frequency bands, such as low-frequency (LF: 0.04–0.15 Hz) and high-frequency (HF: 0.15–0.4 Hz) components.
Step 5: Pattern Recognition or Diagnosis
Apply machine learning or deep learning models to detect or classify cardiac events based on the time-frequency features.
Application scenarios
Heart Rate Variability Analysis (HRV):
Time-frequency analysis helps to separate sympathetic and parasympathetic nervous system activity.
Atrial Fibrillation Detection:
Analyze the time-frequency characteristics of atrial activity.
Ventricular Fibrillation Analysis:
Detect time-frequency changes in high-frequency abnormal components.
Limb leads and electrical conduction through the heart
Formation of limb waveforms during a pulse
The animation shown to the right illustrates how the path of electrical conduction gives rise to the ECG waves in the limb leads. What is green zone? Recall that a positive current (as created by depolarization of cardiac cells) traveling towards the positive electrode and away from the negative electrode creates a positive deflection on the ECG. Likewise, a positive current traveling away from the positive electrode and towards the negative electrode creates a negative deflection on the ECG.[66][67] The red arrow represents the overall direction of travel of the depolarization. The magnitude of the red arrow is proportional to the amount of tissue being depolarized at that instance. The red arrow is simultaneously shown on the axis of each of the 3 limb leads. Both the direction and the magnitude of the red arrow's projection onto the axis of each limb lead is shown with blue arrows. Then, the direction and magnitude of the blue arrows are what theoretically determine the deflections on the ECG. For example, as a blue arrow on the axis for Lead I moves from the negative electrode, to the right, towards the positive electrode, the ECG line rises, creating an upward wave. As the blue arrow on the axis for Lead I moves to the left, a downward wave is created. The greater the magnitude of the blue arrow, the greater the deflection on the ECG for that particular limb lead.[68]
Frames 1–3 depict the depolarization being generated in and spreading through the sinoatrial node. The SA node is too small for its depolarization to be detected on most ECGs. Frames 4–10 depict the depolarization traveling through the atria, towards the atrioventricular node. During frame 7, the depolarization is traveling through the largest amount of tissue in the atria, which creates the highest point in the P wave. Frames 11–12 depict the depolarization traveling through the AV node. Like the SA node, the AV node is too small for the depolarization of its tissue to be detected on most ECGs. This creates the flat PR segment.[69]
Frame 13 depicts an interesting phenomenon in an over-simplified fashion. It depicts the depolarization as it starts to travel down the interventricular septum, through the bundle of His and bundle branches. After the Bundle of His, the conduction system splits into the left bundle branch and the right bundle branch. Both branches conduct action potentials at about 1m/s. However, the action potential starts traveling down the left bundle branch about 5 milliseconds before it starts traveling down the right bundle branch, as depicted by frame 13. This causes the depolarization of the interventricular septum tissue to spread from left to right, as depicted by the red arrow in frame 14. In some cases, this gives rise to a negative deflection after the PR interval, creating a Q wave such as the one seen in lead I in the animation to the right. Depending on the mean electrical axis of the heart, this phenomenon can result in a Q wave in lead II as well.[70][71]
Following depolarization of the interventricular septum, the depolarization travels towards the apex of the heart. This is depicted by frames 15–17 and results in a positive deflection on all three limb leads, which creates the R wave. Frames 18–21 then depict the depolarization as it travels throughout both ventricles from the apex of the heart, following the action potential in the Purkinje fibers. This phenomenon creates a negative deflection in all three limb leads, forming the S wave on the ECG. Repolarization of the atria occurs at the same time as the generation of the QRS complex, but it is not detected by the ECG since the tissue mass of the ventricles is so much larger than that of the atria. Ventricular contraction occurs between ventricular depolarization and repolarization. During this time, there is no movement of charge, so no deflection is created on the ECG. This results in the flat ST segment after the S wave.[72]
Frames 24–28 in the animation depict repolarization of the ventricles. The epicardium is the first layer of the ventricles to repolarize, followed by the myocardium. The endocardium is the last layer to repolarize. The plateau phase of depolarization has been shown to last longer in endocardial cells than in epicardial cells. This causes repolarization to start from the apex of the heart and move upwards. Since repolarization is the spread of negative current as membrane potentials decrease back down to the resting membrane potential, the red arrow in the animation is pointing in the direction opposite of the repolarization. This therefore creates a positive deflection in the ECG, and creates the T wave.[73]
ST elevation myocardial infarctions (STEMIs) have different characteristic ECG findings based on the amount of time elapsed since the MI first occurred. The earliest sign is hyperacute T waves, peaked T waves due to local hyperkalemia in ischemic myocardium. This then progresses over a period of minutes to elevations of the ST segment by at least 1mm. Over a period of hours, a pathologic Q wave may appear and the T wave will invert. Over a period of days the ST elevation will resolve. Pathologic Q waves generally will remain permanently.[74]
The coronary artery that has been occluded can be identified in an STEMI based on the location of ST elevation. The left anterior descending (LAD) artery supplies the anterior wall of the heart, and therefore causes ST elevations in anterior leads (V1 and V2). The LCx supplies the lateral aspect of the heart and therefore causes ST elevations in lateral leads (I, aVL and V6). The right coronary artery (RCA) usually supplies the inferior aspect of the heart, and therefore causes ST elevations in inferior leads (II, III and aVF).[75]
Artifacts
An ECG tracing is affected by patient motion. Some rhythmic motions (such as shivering or tremors) can create the illusion of cardiac arrhythmia.[76] Artifacts are distorted signals caused by a secondary internal or external sources, such as muscle movement or interference from an electrical device.[77][78]
Distortion poses significant challenges to healthcare providers,[77] who employ various techniques[79] and strategies to safely recognize[80] these false signals.[medical citation needed] Accurately separating the ECG artifact from the true ECG signal can have a significant impact on patient outcomes and legal liabilities.[81][unreliable medical source?]
Improper lead placement (for example, reversing two of the limb leads) has been estimated to occur in 0.4% to 4% of all ECG recordings,[82] and has resulted in improper diagnosis and treatment including unnecessary use of thrombolytic therapy.[83][84]
Interpretation
Whitbread, consultant nurse and paramedic, suggests ten rules of the normal ECG, deviation from which is likely to indicate pathology.[85] These have been added to, creating the 15 rules for 12-lead (and 15- or 18-lead) interpretation.[86]
Rule 1: All waves in aVR are negative.
Rule 2: The ST segment (J point) starts on the isoelectric line (except in V1 & V2 where it may be elevated by not greater than 1mm).
Rule 3: The PR interval should be 0.12–0.2 seconds long.
Rule 4: The QRS complex should not exceed 0.11–0.12 seconds.
Rule 5: The QRS and T waves tend to have the same general direction in the limb leads.
Rule 6: The R wave in the precordial (chest) leads grows from V1 to at least V4 where it may or may not decline again.
Rule 7: The QRS is mainly upright in I and II.
Rule 8: The P wave is upright in I II and V2 to V6.
Rule 9: There is no Q wave or only a small q (<0.04 seconds in width) in I, II and V2 to V6.
Rule 10: The T wave is upright in I II and V2 to V6. The end of the T wave should not drop below the isoelectric baseline.
Rule 11: Does the deepest S wave in V1 plus the tallest R wave in V5 or V6 equal >35mm?
Numerous diagnoses and findings can be made based upon electrocardiography, and many are discussed above. Overall, the diagnoses are made based on the patterns. For example, an "irregularly irregular" QRS complex without P waves is the hallmark of atrial fibrillation; however, other findings can be present as well, such as a bundle branch block that alters the shape of the QRS complexes. ECGs can be interpreted in isolation but should be applied – like all diagnostic tests – in the context of the patient. For example, an observation of peaked T waves is not sufficient to diagnose hyperkalemia; such a diagnosis should be verified by measuring the blood potassium level. Conversely, a discovery of hyperkalemia should be followed by an ECG for manifestations such as peaked T waves, widened QRS complexes, and loss of P waves. The following is an organized list of possible ECG-based diagnoses.[87]
An early commercial ECG device (1911)ECG from 1957
In 1872, Alexander Muirhead is reported to have attached wires to the wrist of a patient with fever to obtain an electronic record of their heartbeat.[90]
In 1882, John Burdon-Sanderson working with frogs, was the first to appreciate that the interval between variations in potential was not electrically quiescent and coined the term "isoelectric interval" for this period.[91]
In 1887, Augustus Waller[92] invented an ECG machine consisting of a Lippmann capillary electrometer fixed to a projector. The trace from the heartbeat was projected onto a photographic plate that was itself fixed to a toy train. This allowed a heartbeat to be recorded in real time.
In 1895, Willem Einthoven assigned the letters P, Q, R, S, and T to the deflections in the theoretical waveform he created using equations which corrected the actual waveform obtained by the capillary electrometer to compensate for the imprecision of that instrument. Using letters different from A, B, C, and D (the letters used for the capillary electrometer's waveform) facilitated comparison when the uncorrected and corrected lines were drawn on the same graph.[93] Einthoven probably chose the initial letter P to follow the example set by Descartes in geometry.[93] When a more precise waveform was obtained using the string galvanometer, which matched the corrected capillary electrometer waveform, he continued to use the letters P, Q, R, S, and T,[93] and these letters are still in use today. Einthoven also described the electrocardiographic features of a number of cardiovascular disorders.
In 1897, the string galvanometer was invented by the French engineer Clément Ader.[94]
In 1901, Einthoven, working in Leiden, the Netherlands, used the string galvanometer: the first practical ECG.[95] This device was much more sensitive than the capillary electrometer Waller used.
In 1924, Einthoven was awarded the Nobel Prize in Medicine for his pioneering work in developing the ECG.[96]
By 1927, General Electric had developed a portable apparatus that could produce electrocardiograms without the use of the string galvanometer. This device instead combined amplifier tubes similar to those used in a radio with an internal lamp and a moving mirror that directed the tracing of the electric pulses onto film.[97]
In 1937, Taro Takemi invented a new portable electrocardiograph machine.[98]
In 1942, Emanuel Goldberger increases the voltage of Wilson's unipolar leads by 50% and creates the augmented limb leads aVR, aVL and aVF. When added to Einthoven's three limb leads and the six chest leads we arrive at the 12-lead electrocardiogram that is used today.[99]
In the late 1940s, Rune Elmqvist invented an inkjet printer involving thin jets of ink deflected by electrical potentials from the heart, with good frequency response and direct recording of ECG on paper. The device, called the Mingograf, was sold by Siemens Elema until the 1990s.[100]
Etymology
The word is derived from the Greekelectro, meaning related to electrical activity; kardia, meaning heart; and graph, meaning "to write".[101]
↑ The version with '-K-', more commonly used in American English than in British English, is an early-20th-century loanword from the German acronym EKG for Elektrokardiogramm (electrocardiogram),[1] which reflects that German physicians were pioneers in the field at the time. Today, AMA style and–under its stylistic influence–most American medical publications use ECG instead of EKG.[2] The German term Elektrokardiogramm as well as the English equivalent, electrocardiogram, consist of the Neo-Latin/international scientific vocabulary elements elektro- (cognate electro-) and kardi- (cognate 'cardi-'), the latter from Greek kardia (heart).[3] The '-K-' version is more often retained under circumstances where there may be verbal confusion between ECG and EEG (electroencephalography) due to similar pronunciation.
↑ Bunce, Nicholas H.; Ray, Robin; Patel, Hitesh (2020). "30. Cardiology". In Feather, Adam; Randall, David; Waterhouse, Mona (eds.). Kumar and Clark's Clinical Medicine (10thed.). Elsevier. pp.1033–1038. ISBN978-0-7020-7870-5.
↑ Lilly, Leonard S. (2016). Pathophysiology of Heart Disease: A Collaborative Project of Medical Students and Faculty, 6th Edition. Lippincott Williams & Wilkins. pp.70–78. ISBN978-1-4698-9758-5. OCLC1229852550.
↑ Prabhakararao, Eedara; Dandapat, Samarendra (1 August 2020). "Myocardial Infarction Severity Stages Classification From ECG Signals Using Attentional Recurrent Neural Network". IEEE Sensors Journal. 20 (15): 8711–8720. Bibcode:2020ISenJ..20.8711P. doi:10.1109/JSEN.2020.2984493.
↑ Carrizales-Sepúlveda, Edgar Francisco; Vera-Pineda, Raymundo; Jiménez-Castillo, Raúl Alberto; Treviño-García, Karla Belén; Ordaz-Farías, Alejandro (November 2019). "Toluene toxicity presenting with hypokalemia, profound weakness and U waves in the electrocardiogram". The American Journal of Emergency Medicine. 37 (11): 2120.e1–2120.e3. doi:10.1016/j.ajem.2019.158417. PMID31477355.
↑ Macfarlane, P.W.; Coleman (1995). "Resting 12-Lead Electrode"(PDF). Society for Cardiological Science and Technology. Archived from the original(PDF) on 19 February 2018. Retrieved 21 October 2017.
1 2 3 4 Klingfield, Paul; Gettes, Leonard S.; Bailey, James J.; Childers, Rory; Deal, Barbara J.; Hancock, William; van Herpen, Gerard; Kors, Jan A.; Macfarlane, Peter; Mirvis, David M.; Pahlm, Olle; Rautaharju, Pentti; Wagner, Galen S. (13 March 2007). "Recommendations for the Standardization and Interpretation of the Electrocardiogram: Part I: The Electrocardiogram and Its Technology". AHA/ACC/HRS Scientific Statements. Circulation. 115 (10). American Heart Association: 1306–1324. doi:10.1161/CIRCULATIONAHA.106.180200. PMID17322457.
↑ Kavuru, Madhav S.; Vesselle, Hubert; Thomas, Cecil W. (1987). "Advances in Body Surface Potential Mapping (BSPM) Instrumentation". Pediatric and Fundamental Electrocardiography. Developments in Cardiovascular Medicine. Vol.56. pp.315–327. doi:10.1007/978-1-4613-2323-5_15. ISBN978-1-4612-9428-3.
↑ Kligfield, P; Gettes, LS; Bailey, JJ; Childers, R; Deal, BJ; Hancock, EW; van Herpen, G; Kors, J; Macfarlane, P; Mirvis, DM; Pahlm, O; Rautaharju, P; Wagner, GS. (2007). "Recommendations for the standardization and interpretation of the electrocardiogram: Part I: The electrocardiogram and its technology: A scientific statement from the American Heart Association Electrocardiography and Arrhythmia Committee, Council on Clinical Cardiology; the American College of Cardiology Foundation; and the Heart Rhythm Society". Journal of the American College of Cardiology. 49 (10): 1109–1127. doi:10.1016/j.jacc.2007.01.024. PMID17349896.
↑ Buttner, Robert; Cadogan, Mike (29 January 2022). "Lewis lead". Life in the Fast Lane. Retrieved 2 February 2022.
↑ Meigas, K; Kaik, J; Anier, A (2008). "Device and methods for performing transesophageal stimulation at reduced pacing current threshold". Estonian Journal of Engineering. 57 (2): 154. doi:10.3176/eng.2008.2.05. S2CID42055085.
↑ Sattar, Yasar; Chhabra, Lovely (2022), "Electrocardiogram", StatPearls, Treasure Island (FL): StatPearls Publishing, PMID31747210, retrieved 28 October 2022
↑ Noble, R. Joe; Hillis, J. Stanley; Rothbaum, Donald A. (1990), Walker, H. Kenneth; Hall, W. Dallas; Hurst, J. Willis (eds.), "Electrocardiography", Clinical Methods: The History, Physical, and Laboratory Examinations (3rded.), Butterworths, ISBN978-0-409-90077-4, PMID21250195, retrieved 22 October 2019
↑ Kashou, Anthony H.; Basit, Hajira; Malik, Ahmad (2022), "ST Segment", StatPearls, Treasure Island (FL): StatPearls Publishing, PMID29083566, retrieved 28 October 2022
↑ Lukas, Anton (29 June 2016). "Electrophysiology of Myocardial Cells in the Epicardial, Midmyocardial, and Endocardial Layers of the Ventricle". Journal of Cardiovascular Pharmacology and Therapeutics. 2 (1): 61–72. doi:10.1177/107424849700200108. PMID10684443. S2CID44968291.
↑ Segura-Sampedro, Juan José; Parra-López, Loreto; Sampedro-Abascal, Consuelo; Muñoz-Rodríguez, Juan Carlos (2015). "Atrial Flutter EKG can be useful with the proper Electrophysiological Basis". International Journal of Cardiology. 179: 68–69. doi:10.1016/j.ijcard.2014.10.076. PMID25464416.
↑ Guijarro-Morales A., Gil-Extremera B., Maldonado-Martín A. (1991). "ECG diagnostic errors due to improper connection of the right arm and leg cables". International Journal of Cardiology. 30 (2): 233–235. doi:10.1016/0167-5273(91)90103-v. PMID2010249.{{cite journal}}: CS1 maint: multiple names: authors list (link)
↑ Whitbread, Mark (January 2006). "Reading a normal ECG". British Journal of Cardiac Nursing. 1 (1): 32–33. doi:10.12968/bjca.2006.1.1.20382.
↑ Mallinson, Tom (2 March 2023). "Additional rules for reading an electrocardiogram". Journal of Paramedic Practice. 15 (3): 95–97. doi:10.12968/jpar.2023.15.3.95.
↑ Blackford, John M., MD (1 May 1927). "Electrocardiography: A Short Talk Before the Staff of the Hospital". Clinics of the Virginia Mason Hospital. 6 (1): 28–34.{{cite journal}}: CS1 maint: multiple names: authors list (link)
↑ "Dr. Taro Takemi". Takemi Program in International Health. 27 August 2012. Retrieved 21 October 2017.
This page is based on this Wikipedia article Text is available under the CC BY-SA 4.0 license; additional terms may apply. Images, videos and audio are available under their respective licenses.