Right axis deviation

Last updated
Right axis deviation
Hexaxial reference system.svg
Hexaxial reference system

The electrical axis of the heart is the net direction in which the wave of depolarization travels. It is measured using an electrocardiogram (ECG). Normally, this begins at the sinoatrial node (SA node); from here the wave of depolarisation travels down to the apex of the heart. The hexaxial reference system can be used to visualise the directions in which the depolarisation wave may travel.

Contents

On a hexaxial diagram (see figure 1):

RAD is an ECG finding that arises either as an anatomically normal variant or an indicator of underlying pathology.

Signs, symptoms and risk factors

There are often no symptoms for RAD and it is usually found by chance during an ECG. Many of the symptoms exhibited by patients with RAD are associated with its different causes. The table below displays the four most common causes and the signs, symptoms and risk factors associated with it.[ citation needed ]

Signs and symptomsRisk factors
Lateral myocardial infarctionAnxiety

Chest pain

Fatigue

Shortness of breath [1]

Smoking or Tobacco

Obesity

Gender

Hypertension

Diabetes

Physical inactivity

Age

Alcohol

Right ventricular hypertrophyShortness of breath

Dizziness

Fainting

Chronic lung disease (COPD) [2]

Pulmonary hypertension

Mitral stenosis

Pulmonary embolism

Congenital heart disease

Arrythmogenic right ventricle cardiomyopathy

Fascicular BlockLight-headedness

Fainting

Palpitations [3]

Hereditary bundle branch block
AsymptomaticWolff-Parkinson-White [4]
Other causesVariableEctopic ventricular beats

Drug toxicity (e.g. tricyclic antidepressants [5] )

Hyperkalaemia

Causes

Fascicular block

Blockage of the left posterior fascicle would lead to activation of the anterior portion of the left ventricle followed by activation of the rest of the ventricle in a superior to inferior direction and directed towards the right. This would lead to right axis deviation findings on an ECG. [6] Bifascicular block is a combination of right bundle branch block and either left anterior fascicular block or left posterior fascicular block. Conduction to the ventricle would therefore be via the remaining fascicle. The ECG will show typical features of RBBB plus either left or right axis deviation. [7] [8]

Lateral myocardial infarction

The lateral wall of the left ventricle is supplied by branches of the left anterior descending (LAD) and left circumflex (LCx) arteries. [8] Infarction of the lateral wall will thus lead to deviation of the axis away from the site of infarction. [9]

Right ventricular hypertrophy

Increased thickness of the right ventricle leads to right axis deviation [ citation needed ]

Pre-excitation syndromes

Pre-excitation refers to early activation of the ventricles due to impulses bypassing the AV node via an accessory pathway. [10] Accessory pathways are abnormal conduction pathways formed during cardiac development. An example of pre-excitation syndromes is Wolff Parkinson White syndrome. Here, the presence of a left lateral accessory pathway leads to right-axis deviation. [11]

Ventricular tachycardia

Fascicular tachycardia usually arises from the posterior fascicle of the left bundle branch. They produce QRS complexes of relatively short durations with a right bundle branch block pattern. Tachycardias originating in the anterior left fascicle would lead to right axis deviation.[ citation needed ]

Right ventricular outflow tract tachycardia originates from the outflow tract of the right ventricle or the tricuspid annulus. As it arises from the right ventricle, the impulse spreads inferiorly from beneath the pulmonary valve, and there right axis deviation. [12]

Ventricular ectopy

Ventricular ectopy is when the heartbeat is an abnormal heartbeat where the QRS complex is significantly wider. When the origin of the ectopic heartbeat is in the anterior fascicule then there is right axis deviation. [13]

Pathophysiology

The pathophysiology depends on the specific cause of right axis deviation. Most causes can be attributed to one of four main mechanisms. [14] [15] These include right ventricular hypertrophy, reduced muscle mass of left ventricle, altered conduction pathways and change in the position of the heart in the chest.[ citation needed ]

Right ventricular hypertrophy

Enlargement of right ventricular myocardial mass can result in right axis deviation. There are 2 main reasons for this mechanism. [15] Firstly, more muscle mass will result in greater amplitude of depolarisation of that side of the heart. [15] Secondly, depolarisation of the heart will be slower through the right ventricle relative to the left, and therefore the effects of the right ventricle on the axis of the heart will be dominant. [15]

Left ventricular atrophy

Decrease in myocardial mass of the left ventricle will shift the balance of depolarisation towards the right. For example, scarring and atrophy caused by ischaemia of the left ventricle will cause depolarisation of the left side of the heart to be less forceful. [15] Hence, depolarisation of the right ventricle will be greater in amplitude than left, shifting the axis to the right.[ citation needed ]

Conduction abnormalities

Changes in the conduction pathways of the heart can result in right axis deviation. For example, an accessory pathway from the left atrium to the left ventricle, as in Wolff-Parkinson-White Syndrome, will result in the left ventricle finishing depolarisation earlier than the right. [16] Hence, the right ventricle will have more of an effect on the axis of the heart.[ citation needed ]

Position of heart in the chest

The apex of the heart is normally orientated towards the left. A more vertical orientation of the heart, shifts the axis to the right. Physiologically, this can occur in tall and thin individuals. [16] Pathologically, conditions such as a left-sided pneumothorax and lung hyperinflation (e.g. COPD) [17] can cause rightwards displacement of the heart. The congenital condition of dextrocardia results in right axis deviation.

Diagnosis

ECG showing right axis deviation E197 (CardioNetworks ECGpedia).jpg
ECG showing right axis deviation

In general, a positive (upwards) deflection of an ECG trace demonstrates an electrical activity that moves towards the measuring electrode, whereas a negative (downwards) deflection of an ECG trace demonstrates an electrical activity that moves away from the measuring electrode. The electrical heart axis can be estimated from the ECG by using the quadrant method or degree method. [18]

  1. Quadrant Method: [19] Leads I and II are usually observed. If lead I is positive (translating to 0° on the hexaxial reference system) and lead II is positive (translating to 60°), the electrical heart axis is estimated to fall in the left lower quadrant within the normal range. On the other hand, as shown in Figure 2, if lead I is negative (translating to 180°) and lead II is positive, the electrical heart axis is estimated to fall in the right lower quadrant suggesting a right axis deviation. Similarly, leads I and aVF can be used.
  2. Degree method: First, identify the lead with the smallest QRS complex or isoelectric (flat) QRS complex (lead a). After locating the axis of the lead on the hexaxial reference system, identify the lead which is perpendicular to it (lead b). If lead b is positive, the electrical heart axis can be estimated to lie within the quadrant between axis of lead a and lead b.

A simple tool to quickly identify axis deviation (Figure 3) is the popular mnemonic; Reaching for Right Axis Deviation and Leaving for Left Axis Deviation. This refers to the appearance of leads I and III. If the QRS complex is negative in lead I and positive in lead III, the QRS complexes appear to be "reaching" to touch each other. This signifies right axis deviation. Conversely, if the QRS complex is positive in lead I and negative in lead III. the leads have the appearance of "leaving" each other. If the QRS complex in lead II is also negative, this confirms a left axis deviation.[ citation needed ]

See also

Related Research Articles

<span class="mw-page-title-main">Electrocardiography</span> Examination of the hearts electrical activity

Electrocardiography is the process of producing an electrocardiogram, a recording of the heart's electrical activity through repeated cardiac cycles. It is an electrogram of the heart which is a graph of voltage versus time of the electrical activity of the heart using electrodes placed on the skin. These electrodes detect the small electrical changes that are a consequence of cardiac muscle depolarization followed by repolarization during each cardiac cycle (heartbeat). Changes in the normal ECG pattern occur in numerous cardiac abnormalities, including cardiac rhythm disturbances, inadequate coronary artery blood flow, and electrolyte disturbances.

<span class="mw-page-title-main">Ventricular fibrillation</span> Rapid quivering of the ventricles of the heart

Ventricular fibrillation is an abnormal heart rhythm in which the ventricles of the heart quiver. It is due to disorganized electrical activity. Ventricular fibrillation results in cardiac arrest with loss of consciousness and no pulse. This is followed by sudden cardiac death in the absence of treatment. Ventricular fibrillation is initially found in about 10% of people with cardiac arrest.

<span class="mw-page-title-main">Wolff–Parkinson–White syndrome</span> Medical condition

Wolff–Parkinson–White syndrome (WPWS) is a disorder due to a specific type of problem with the electrical system of the heart involving an accessory pathway able to conduct electrical current between the atria and the ventricles, thus bypassing the atrioventricular node. About 60% of people with the electrical problem developed symptoms, which may include an abnormally fast heartbeat, palpitations, shortness of breath, lightheadedness, or syncope. Rarely, cardiac arrest may occur. The most common type of irregular heartbeat that occurs is known as paroxysmal supraventricular tachycardia.

<span class="mw-page-title-main">Bundle of His</span> Collection of heart muscle cells

The bundle of His (BH) or His bundle (HB) ( "hiss") is a collection of heart muscle cells specialized for electrical conduction. As part of the electrical conduction system of the heart, it transmits the electrical impulses from the atrioventricular node to the point of the apex of the fascicular branches via the bundle branches. The fascicular branches then lead to the Purkinje fibers, which provide electrical conduction to the ventricles, causing the cardiac muscle of the ventricles to contract at a paced interval.

<span class="mw-page-title-main">Third-degree atrioventricular block</span> Medical condition

Third-degree atrioventricular block is a medical condition in which the electrical impulse generated in the sinoatrial node in the atrium of the heart can not propagate to the ventricles.

<span class="mw-page-title-main">Cardiac conduction system</span> Aspect of heart function

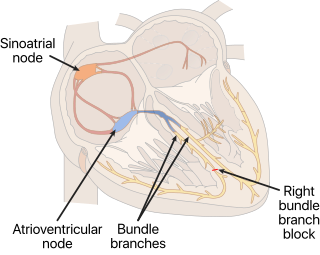
The cardiac conduction system transmits the signals generated by the sinoatrial node – the heart's pacemaker, to cause the heart muscle to contract, and pump blood through the body's circulatory system. The pacemaking signal travels through the right atrium to the atrioventricular node, along the bundle of His, and through the bundle branches to Purkinje fibers in the walls of the ventricles. The Purkinje fibers transmit the signals more rapidly to stimulate contraction of the ventricles.

<span class="mw-page-title-main">Ventricular tachycardia</span> Medical condition of the heart

Ventricular tachycardia is a fast heart rate arising from the lower chambers of the heart. Although a few seconds of VT may not result in permanent problems, longer periods are dangerous; and multiple episodes over a short period of time are referred to as an electrical storm. Short periods may occur without symptoms, or present with lightheadedness, palpitations, or chest pain. Ventricular tachycardia may result in ventricular fibrillation (VF) and turn into cardiac arrest. This conversion of the VT into VF is called the degeneration of the VT. It is found initially in about 7% of people in cardiac arrest.

<span class="mw-page-title-main">AV nodal reentrant tachycardia</span> Medical condition

AV-nodal reentrant tachycardia (AVNRT) is a type of abnormal fast heart rhythm. It is a type of supraventricular tachycardia (SVT), meaning that it originates from a location within the heart above the bundle of His. AV nodal reentrant tachycardia is the most common regular supraventricular tachycardia. It is more common in women than men. The main symptom is palpitations. Treatment may be with specific physical maneuvers, medications, or, rarely, synchronized cardioversion. Frequent attacks may require radiofrequency ablation, in which the abnormally conducting tissue in the heart is destroyed.

<span class="mw-page-title-main">T wave</span> Repolarization of the ventricles in a human heart

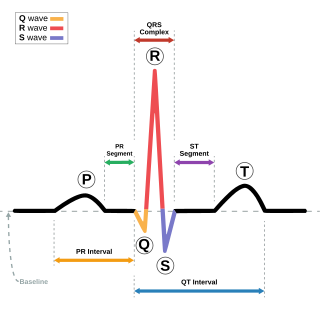
In electrocardiography, the T wave represents the repolarization of the ventricles. The interval from the beginning of the QRS complex to the apex of the T wave is referred to as the absolute refractory period. The last half of the T wave is referred to as the relative refractory period or vulnerable period. The T wave contains more information than the QT interval. The T wave can be described by its symmetry, skewness, slope of ascending and descending limbs, amplitude and subintervals like the Tpeak–Tend interval.

<span class="mw-page-title-main">Bundle branch block</span> Medical condition

A bundle branch block is a defect in one of the bundle branches in the electrical conduction system of the heart.

<span class="mw-page-title-main">QRS complex</span> Represents ventricular depolarization, which results in ventricular contraction

The QRS complex is the combination of three of the graphical deflections seen on a typical electrocardiogram. It is usually the central and most visually obvious part of the tracing. It corresponds to the depolarization of the right and left ventricles of the heart and contraction of the large ventricular muscles.

<span class="mw-page-title-main">Right bundle branch block</span> Heart block in the right ventricle

A right bundle branch block (RBBB) is a heart block in the right bundle branch of the electrical conduction system.

<span class="mw-page-title-main">Left bundle branch block</span> Medical condition

Left bundle branch block (LBBB) is a conduction abnormality in the heart that can be seen on an electrocardiogram (ECG). In this condition, activation of the left ventricle of the heart is delayed, which causes the left ventricle to contract later than the right ventricle.

An accessory pathway is an additional electrical connection between two parts of the heart. These pathways can lead to abnormal heart rhythms or arrhythmias associated with symptoms of palpitations. Some pathways may activate a region of ventricular muscle earlier than would normally occur, referred to as pre-excitation, and this may be seen on an electrocardiogram. The combination of an accessory pathway that causes pre-excitation with arrhythmias is known as Wolff-Parkinson-White syndrome.

<span class="mw-page-title-main">Bifascicular block</span> Conduction abnormality in the heart

Bifascicular block is a conduction abnormality in the heart where two of the three main fascicles of the His/Purkinje system are blocked.

<span class="mw-page-title-main">Left anterior fascicular block</span> Medical condition

Left anterior fascicular block (LAFB) is an abnormal condition of the left ventricle of the heart, related to, but distinguished from, left bundle branch block (LBBB).

A left posterior fascicular block (LPFB), also known as left posterior hemiblock (LPH), is a condition where the left posterior fascicle, which travels to the inferior and posterior portion of the left ventricle, does not conduct the electrical impulses from the atrioventricular node. The wave-front instead moves more quickly through the left anterior fascicle and right bundle branch, leading to a right axis deviation seen on the ECG.

<span class="mw-page-title-main">Intraventricular block</span> Medical condition

An intraventricular block is a heart conduction disorder — heart block of the ventricles of the heart. An example is a right bundle branch block, right fascicular block, bifascicular block, trifascicular block.

<span class="mw-page-title-main">ST depression</span> Depression of the ST segment on an electrocardiogram

ST depression refers to a finding on an electrocardiogram, wherein the trace in the ST segment is abnormally low below the baseline.

<span class="mw-page-title-main">Left axis deviation</span> Heart condition

In electrocardiography, left axis deviation (LAD) is a condition wherein the mean electrical axis of ventricular contraction of the heart lies in a frontal plane direction between −30° and −90°. This is reflected by a QRS complex positive in lead I and negative in leads aVF and II.

References

  1. Kirchberger, Inge; Heier, Margit; Kuch, Bernhard; Scheidt, Wolfgang von; Meisinger, Christa (2012). "Presenting symptoms of myocardial infarction predict short- and long-term mortality: The MONICA/KORA Myocardial Infarction Registry". American Heart Journal. 164 (6): 856–861. doi: 10.1016/j.ahj.2012.06.026 . PMID   23194485.
  2. Agarwal, R.L.; Kumar, Dinesh; Gurpreet; Agarwal, D.K.; Chabra, G.S. (2008-01-01). "Diagnostic Values of Electrocardiogram in Chronic Obstructive Pulmonary Disease (COPD)". Lung India. 25 (2): 78–81. doi: 10.4103/0970-2113.44125 . ISSN   0970-2113. PMC   2822322 . PMID   20165655.
  3. Topol, Eric J.; Califf, Robert M. (2007-01-01). Textbook of Cardiovascular Medicine. Lippincott Williams & Wilkins. ISBN   9780781770125.
  4. Steurer, G.; Frey, B.; Gürsoy, S.; Tsakonas, K.; Celiker, A.; Andries, E.; Kuck, K.; Brugada, P. (1994-11-01). "Cardiac depolarization and repolarization in Wolff-Parkinson-White syndrome". American Heart Journal. 128 (5): 908–911. doi:10.1016/0002-8703(94)90588-6. ISSN   0002-8703. PMID   7942483.
  5. Thanacoody, H. K. Ruben; Thomas, Simon H. L. (2005-01-01). "Tricyclic antidepressant poisoning : cardiovascular toxicity". Toxicological Reviews. 24 (3): 205–214. doi:10.2165/00139709-200524030-00013. ISSN   1176-2551. PMID   16390222. S2CID   44532041.
  6. Kusumoto, Fred M. (2009-04-21). ECG Interpretation: From Pathophysiology to Clinical Application. Springer Science & Business Media. ISBN   9780387888804.
  7. Burns, Ed. "Lateral STEMI". Life In The Fast Lane. Retrieved 2016-11-12.
  8. 1 2 Burns, Ed (2015-07-04). "Bifascicular Block". Life In The Fast Lane. Retrieved 2015-11-12.
  9. Chugh, S. N. (2014-05-14). Textbook of Clinical Electrocardiography. Jaypee Brothers Publishers. ISBN   9789350906088.
  10. Burns, Ed (2016-05-31). "Pre-excitation Syndromes". Life In The Fast Lane. Retrieved 2016-11-12.
  11. Lilly, Leonard S. (2015-06-25). Braunwald's Heart Disease Review and Assessment. Elsevier Health Sciences. ISBN   9780323375405.
  12. Bennett, David H. (2006-09-29). Cardiac Arrhythmias 7th Edition: Practical Notes on Interpretation and Treatment. CRC Press. ISBN   9781444113464.
  13. Conover, Mary Boudreau (2003-01-01). Understanding Electrocardiography. Elsevier Health Sciences. ISBN   978-0323019057.
  14. Kossmann, Charles E.; Berger, Adolph R.; Brumlik, Joseph; Briller, Stanley A. (February 1948). "An analysis of causes of right axis deviation based partly on endocardial potentials of the hypertrophied right ventricle". American Heart Journal. 35 (2): 309–335. doi:10.1016/0002-8703(48)90108-2. PMID   18901116.
  15. 1 2 3 4 5 Hall, John E. (2016). Guyton and Hall Textbook of Medical Physiology (13 ed.). Elsevier. pp. 144–147. ISBN   978-1-4557-7016-8.
  16. 1 2 Kuhn, Lisa; Rose, Louise (December 2008). "ECG Interpretation Part 1: Understanding Mean Electrical Axis". Journal of Emergency Nursing. 34 (6): 530–534. CiteSeerX   10.1.1.666.5964 . doi:10.1016/j.jen.2008.01.007. PMID   19022076.
  17. Harrigan, Richard A (May 18, 2002). "Conditions affecting the right side of the heart - ProQuest". BMJ. 324 (7347): 1201–1204. doi:10.1136/bmj.324.7347.1201. PMC   1123164 . PMID   12016190 . Retrieved November 12, 2016.
  18. M Allen, Diane; et al. (2011). ECG Made Incredibly Easy (PDF). Lippincott Williams & Wilkins. pp. 264–271. ISBN   978-1-60831-289-4 . Retrieved 12 November 2016.
  19. Burns, Ed (2016-06-28). "ECG Axis Interpretation". Life in the Fast Lane. Retrieved 12 November 2016.