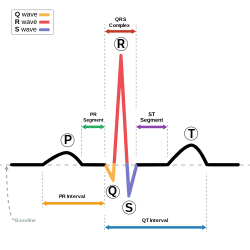
Schematic representation of a normal sinus rhythm ECG wave. Diagram showing how the polarity of the QRS complex in leads I, II, and III can be used to estimate the heart's electrical axis in the frontal plane.
The QRS complex is the combination of three of the graphical deflections seen on a typical electrocardiogram (ECG or EKG). It is usually the central and most visually obvious part of the tracing. It corresponds to the depolarization of the right and left ventricles of the heart and contraction of the large ventricular muscles.
In adults, the QRS complex normally lasts 80 to 100 ms; in children it may be shorter. The Q, R, and S waves occur in rapid succession, do not all appear in all leads, and reflect a single event and thus are usually considered together. A Q wave is any downward deflection immediately following the P wave. An R wave follows as an upward deflection, and the S wave is any downward deflection after the R wave. The T wave follows the S wave, and in some cases, an additional U wave follows the T wave.
To measure the QRS interval start at the end of the PR interval (or beginning of the Q wave) to the end of the S wave. Normally this interval is 0.08 to 0.10 seconds. When the duration is longer it is considered a wide QRS complex.
Any abnormality of conduction takes longer and causes "widened" QRS complexes, sometimes called cardiac aberrancy. In bundle branch block, there can be an abnormal second upward deflection within the QRS complex. In this case, such a second upward deflection is referred to as R′ (pronounced "R prime"). This would be described as an RSR′ pattern.
Ventricles contain more muscle mass than the atria. Therefore, the QRS complex is considerably larger than the P wave. The QRS complex is often used to determine the axis of the electrocardiogram, although it is also possible to determine a separate P wave axis.
Large amplitude might indicate of left ventricular hypertrophy[9]
Q wave
Normal Q waves, when present, represent depolarization of the interventricular septum. For this reason, they are referred to as septal Q waves and can be appreciated in the lateral leads I, aVL, V5 and V6.
Pathologic Q waves occur when the electrical signal passes through stunned or scarred heart muscle; as such, they are usually markers of previous myocardial infarctions, with subsequent fibrosis. A pathologic Q wave is defined as having a deflection amplitude of 25% or more of the subsequent R wave, or being > 0.04 s (40ms) in width and > 2 mm in amplitude. However, diagnosis requires the presence of this pattern in more than one corresponding lead.
R wave progression
Looking at the precordial leads, the R wave usually progresses from showing an rS-type complex in V1 with an increasing R and a decreasing S wave when moving toward the left side. There is usually a qR-type of complex in V5 and V6, with the R-wave amplitude usually taller in V5 than in V6. It is normal to have a narrow QS and rSr' patterns in V1, and this is also the case for qRs and R patterns in V5 and V6. The transition zone is where the QRS complex changes from predominantly negative to predominantly positive (R/S ratio becoming >1), and this usually occurs at V3 or V4. It is normal to have the transition zone at V2 (called "early transition") and at V5 (called "delayed transition").[10] In biomedical engineering, the maximum amplitude in the R wave is usually called "R peak amplitude", or just "R peak".[11][12] Accurate R peak detection is essential in signal processing equipment for heart rate measurement and it is the main feature used for arrhythmia detection.[13][14]
The definition of poor R wave progression (PRWP) varies in the literature. It may be defined, for example, as R wave of less than 2–4mm in leads V3 or V4 and/or presence of a reversed R wave progression, which is defined as R in V4 < R in V3 or R in V3 < R in V2 or R in V2 < R in V1, or any combination of these.[10]Poor R wave progression is commonly attributed to anterior myocardial infarction, but it may also be caused by left bundle branch block, Wolff–Parkinson–White syndrome, right and left ventricular hypertrophy, or a faulty ECG recording technique.[10]
R wave peak time
R wave peak time (RWPT) represents the time from the onset of QRS complex to the peak of R wave, which is usually measured in aVL and V5 or V6 leads.[15]
R-peak time for right ventricle is measured from leads V1 or V2, where upper range of normal is 35 ms. R wave peak time for left ventricle is measured from lead V5 or V6 and 45 ms is the upper range of normal.[6] R wave peak time is considered to be prolonged if it's more than 45 ms.
J-point
The point where the QRS complex meets the ST segment is the J-point. The J-point is easy to identify when the ST segment is horizontal and forms a sharp angle with the last part of the QRS complex. However, when the ST segment is sloped or the QRS complex is wide, the two features do not form a sharp angle and the location of the J-point is less clear. There is no consensus on the precise location of the J-point in these circumstances.[16] Two possible definitions are:
The "first point of inflection of the upstroke of the S wave"[16]
The point at which the ECG trace becomes more horizontal than vertical[17]
Terminology
Various QRS complexes with nomenclature.
Not every QRS complex contains a Q wave, an R wave, and an S wave. By convention, any combination of these waves can be referred to as a QRS complex. However, correct interpretation of difficult ECGs requires exact labeling of the various waves. Some authors use lowercase and capital letters, depending on the relative size of each wave. For example, an Rs complex would be positively deflected, while an rS complex would be negatively deflected. If both complexes were labeled RS, it would be impossible to appreciate this distinction without viewing the actual ECG.
Monomorphic or polymorphic
Monomorphic refers to all QRS waves in a single lead being similar in shape. Polymorphic means that the QRS change from complex to complex.[18] These terms are used in the description of ventricular tachycardia.
Algorithms
A common algorithm used for QRS complex detection is the Pan-Tompkins[19] algorithm (or method); another is based on the Hilbert transform.[20][21][22][23] Numerous other algorithms have been proposed and investigated.[24] In recent research, heart beat detection methods based on visibility graphs have been introduced, enabling fast and sample-precise R-peak annotation even in noisy ECG.[25][26]
↑ Kim SH, Kim CH, Savastyuk E, Kochiev T, Kim HS, Kim TS (2009). "Windowed Nonlinear Energy Operator-based First-arrival Pulse Detection for Ultrasound Transmission Computed Tomography". In Lim CT, Hong JG (eds.). 13th International Conference on Biomedical Engineering. IFMBE Proceedings. Vol.23. Springer. pp.468–471 (469). doi:10.1007/978-3-540-92841-6_115. ISBN978-3-540-92840-9.
↑ Singh HR, Sharma R, Sahgal N, Sethi P, Kushwah R, Kachhawa P (2010). "An improved method of measurement of ECG parameters for online medical diagnosis". Studies in Health Technology and Informatics. 156 (Medical and Care Compunetics 6): 40–46. doi:10.3233/978-1-60750-565-5-40. PMID20543337.
↑ Koka, Taulant; Muma, Michael (2022). "Fast and Sample Accurate R-Peak Detection for Noisy ECG Using Visibility Graphs". 2022 44th Annual International Conference of the IEEE Engineering in Medicine & Biology Society (EMBC). pp.121–126. doi:10.1109/embc48229.2022.9871266. ISBN978-1-7281-2782-8. PMID36086455.
↑ Emrich, Jonas; Koka, Taulant; Wirth, Sebastian; Muma, Michael (2023). "Accelerated Sample-Accurate R-Peak Detectors Based on Visibility Graphs". 2023 31st European Signal Processing Conference (EUSIPCO). pp.1090–1094. doi:10.23919/eusipco58844.2023.10290007. ISBN978-9-4645-9360-0.
This page is based on this Wikipedia article Text is available under the CC BY-SA 4.0 license; additional terms may apply. Images, videos and audio are available under their respective licenses.