
ST elevation refers to a finding on an electrocardiogram wherein the trace in the ST segment is abnormally high above the baseline.
ST elevation refers to a finding on an electrocardiogram wherein the trace in the ST segment is abnormally high above the baseline.
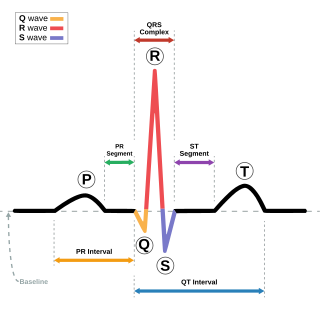
The ST segment starts from the J point (termination of QRS complex and the beginning of ST segment) and ends with the T wave. The ST segment is the plateau phase, in which the majority of the myocardial cells had gone through depolarization but not repolarization. The ST segment is the isoelectric line because there is no voltage difference across cardiac muscle cell membrane during this state. Any distortion in the shape, duration, or height of the cardiac action potential can distort the ST segment. [1]


An ST elevation is considered significant if the vertical distance inside the ECG trace and the baseline at a point 0.04 seconds after the J-point is at least 0.1 mV (usually representing 1 mm or 1 small square) in a limb lead or 0.2 mV (2 mm or 2 small squares) in a precordial lead. [2] The baseline is either the PR interval or the TP interval. [3] This measure has a false positive rate of 15-20% (which is slightly higher in women than men) and a false negative rate of 20-30%. [4]

When there is a blockage of the coronary artery, there will be lack of oxygen supply to all three layers of cardiac muscle (transmural ischemia). The leads facing the injured cardiac muscle cells will record the action potential as ST elevation during systole while during diastole, there will be depression of the PR segment and the PT segment. Since PR and PT interval are regarded as baseline, ST segment elevation is regarded as a sign of myocardial ischemia. The opposing leads (such as V3 and V4 versus posterior leads V7-V9) always show reciprocal ST segment changes (ST elevation in one lead is followed by ST depression in the opposing lead). This is highly specific for myocardial infarction. An upsloping, convex ST segment is highly predictive of a myocardial infarction (Pardee sign) while a concave ST elevation is less suggestive and can be found in other non-ischaemic causes. [1] Following infarction, ventricular aneurysm can develop, which leads to persistent ST elevation, loss of S wave, and T wave inversion. [1]
Weakening of the electrical activity of the cardiac muscles causes the decrease in height of the R wave in those leads facing it. In opposing leads, it manifests as Q wave. However, Q waves may be found in healthy individuals at lead I, aVL, V5 and V6 due to left to right depolarisation. [1]
In these conditions, there will mostly be concave ST elevations in almost all the leads except for aVR and V1. These two leads, ST depression will be seen because they are the opposing leads of the cardiac axis. PR segment depression is highly suggestive of pericarditis. R wave in most cases will be unaltered. In two weeks after pericarditis, there will be upward concave ST elevation, positive T wave, and PR depression. After several more weeks, PR and ST segments normalised with flattened T wave. At last, there will be T wave inversion which will take weeks or months to vanish. [1]
The topology and distribution of the affected areas depend on the underlying condition. Thus, ST elevation may be present on all or some leads of ECG.[ citation needed ]
It can be associated with:
Electrocardiography is the process of producing an electrocardiogram, a recording of the heart's electrical activity. It is an electrogram of the heart which is a graph of voltage versus time of the electrical activity of the heart using electrodes placed on the skin. These electrodes detect the small electrical changes that are a consequence of cardiac muscle depolarization followed by repolarization during each cardiac cycle (heartbeat). Changes in the normal ECG pattern occur in numerous cardiac abnormalities, including cardiac rhythm disturbances, inadequate coronary artery blood flow, and electrolyte disturbances.

The electrical conduction system of the heart transmits signals generated usually by the sinoatrial node to cause contraction of the heart muscle. The pacemaking signal generated in the sinoatrial node travels through the right atrium to the atrioventricular node, along the Bundle of His and through bundle branches to cause contraction of the heart muscle. This signal stimulates contraction first of the right and left atrium, and then the right and left ventricles. This process allows blood to be pumped throughout the body.
Pericarditis is inflammation of the pericardium, the fibrous sac surrounding the heart. Symptoms typically include sudden onset of sharp chest pain, which may also be felt in the shoulders, neck, or back. The pain is typically less severe when sitting up and more severe when lying down or breathing deeply. Other symptoms of pericarditis can include fever, weakness, palpitations, and shortness of breath. The onset of symptoms can occasionally be gradual rather than sudden.
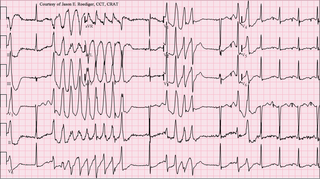
Torsades de pointes, torsade de pointes or torsades des pointes (TdP) is a specific type of abnormal heart rhythm that can lead to sudden cardiac death. It is a polymorphic ventricular tachycardia that exhibits distinct characteristics on the electrocardiogram (ECG). It was described by French physician François Dessertenne in 1966. Prolongation of the QT interval can increase a person's risk of developing this abnormal heart rhythm, occurring in between 1% and 10% of patients who receive QT-prolonging antiarrhythmic drugs.

A cardiac stress test is a cardiological test that measures the heart's ability to respond to external stress in a controlled clinical environment. The stress response is induced by exercise or by intravenous pharmacological stimulation.

In electrocardiography, the T wave represents the repolarization of the ventricles. The interval from the beginning of the QRS complex to the apex of the T wave is referred to as the absolute refractory period. The last half of the T wave is referred to as the relative refractory period or vulnerable period. The T wave contains more information than the QT interval. The T wave can be described by its symmetry, skewness, slope of ascending and descending limbs, amplitude and subintervals like the Tpeak–Tend interval.
The QRS complex is the combination of three of the graphical deflections seen on a typical electrocardiogram. It is usually the central and most visually obvious part of the tracing. It corresponds to the depolarization of the right and left ventricles of the heart and contraction of the large ventricular muscles.

Unstable angina (UA), also called crescendo angina, is a type of angina pectoris that is irregular. It is also classified as a type of acute coronary syndrome (ACS).

Acute pericarditis is a type of pericarditis usually lasting less than 6 weeks. It is the most common condition affecting the pericardium.

Takotsubo cardiomyopathy or Takotsubo syndrome (TTS), also known as stress cardiomyopathy, is a type of non-ischemic cardiomyopathy in which there is a sudden temporary weakening of the muscular portion of the heart. It usually appears after a significant stressor, either physical or emotional; when caused by the latter, the condition is sometimes called broken heart syndrome. Examples of physical stressors that can cause TTS are sepsis, shock, and pheochromocytoma, and emotional stressors include bereavement, divorce, or the loss of a job. Reviews suggest that of patients diagnosed with the condition, about 70–80% recently experienced a major stressor, including 41–50% with a physical stressor and 26–30% with an emotional stressor. TTS can also appear in patients who have not experienced major stressors.

A myocardial infarction (MI), commonly known as a heart attack, occurs when blood flow decreases or stops to the coronary artery of the heart, causing damage to the heart muscle. The most common symptom is chest pain or discomfort which may travel into the shoulder, arm, back, neck or jaw. Often it occurs in the center or left side of the chest and lasts for more than a few minutes. The discomfort may occasionally feel like heartburn. Other symptoms may include shortness of breath, nausea, feeling faint, a cold sweat or feeling tired. About 30% of people have atypical symptoms. Women more often present without chest pain and instead have neck pain, arm pain or feel tired. Among those over 75 years old, about 5% have had an MI with little or no history of symptoms. An MI may cause heart failure, an irregular heartbeat, cardiogenic shock or cardiac arrest.

Vectorcardiography (VCG) is a method of recording the magnitude and direction of the electrical forces that are generated by the heart by means of a continuous series of vectors that form curving lines around a central point.

ST depression refers to a finding on an electrocardiogram, wherein the trace in the ST segment is abnormally low below the baseline.

The P wave on the ECG represents atrial depolarization, which results in atrial contraction, or atrial systole.

Electrocardiography in suspected myocardial infarction has the main purpose of detecting ischemia or acute coronary injury in emergency department populations coming for symptoms of myocardial infarction (MI). Also, it can distinguish clinically different types of myocardial infarction.
Myocardial infarction complications may occur immediately following a heart attack, or may need time to develop. After an infarction, an obvious complication is a second infarction, which may occur in the domain of another atherosclerotic coronary artery, or in the same zone if there are any live cells left in the infarct.
A diagnosis of myocardial infarction is created by integrating the history of the presenting illness and physical examination with electrocardiogram findings and cardiac markers. A coronary angiogram allows visualization of narrowings or obstructions on the heart vessels, and therapeutic measures can follow immediately. At autopsy, a pathologist can diagnose a myocardial infarction based on anatomopathological findings.

Management of acute coronary syndrome is targeted against the effects of reduced blood flow to the afflicted area of the heart muscle, usually because of a blood clot in one of the coronary arteries, the vessels that supply oxygenated blood to the myocardium. This is achieved with urgent hospitalization and medical therapy, including drugs that relieve chest pain and reduce the size of the infarct, and drugs that inhibit clot formation; for a subset of patients invasive measures are also employed. Basic principles of management are the same for all types of acute coronary syndrome. However, some important aspects of treatment depend on the presence or absence of elevation of the ST segment on the electrocardiogram, which classifies cases upon presentation to either ST segment elevation myocardial infarction (STEMI) or non-ST elevation acute coronary syndrome (NST-ACS); the latter includes unstable angina and non-ST elevation myocardial infarction (NSTEMI). Treatment is generally more aggressive for STEMI patients, and reperfusion therapy is more often reserved for them. Long-term therapy is necessary for prevention of recurrent events and complications.

Benign early repolarization also known as early repolarization is found on ECG in about 1% of those with chest pain. It is diagnosed based on an elevated J-point / ST elevation where the ST segment is concave up. It is believed to be a normal variant.
Sgarbossa's criteria are a set of electrocardiographic findings generally used to identify myocardial infarction in the presence of a left bundle branch block (LBBB) or a ventricular paced rhythm.