Magnetoencephalography (MEG) is a functional neuroimaging technique for mapping brain activity by recording magnetic fields produced by electrical currents occurring naturally in the brain, using very sensitive magnetometers. Arrays of SQUIDs (superconducting quantum interference devices) are currently the most common magnetometer, while the SERF (spin exchange relaxation-free) magnetometer is being investigated for future machines.[1][2] Applications of MEG include basic research into perceptual and cognitive brain processes, localizing regions affected by pathology before surgical removal, determining the function of various parts of the brain, and neurofeedback. This can be applied in a clinical setting to find locations of abnormalities as well as in an experimental setting to simply measure brain activity.[3]
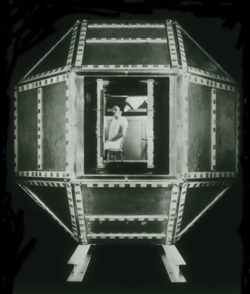
Dr. Cohen's shielded room at MIT, in which first MEG was measured with a SQUIDFirst MEG measured with SQUID, in Dr. Cohen's room at MIT
MEG signals were first measured by University of Illinois physicist David Cohen in 1968,[4] before the availability of the SQUID, using a copper induction coil as the detector. To reduce the magnetic background noise, the measurements were made in a magnetically shielded room. The coil detector was barely sensitive enough, resulting in poor, noisy MEG measurements that were difficult to use. Later, Cohen built a much better shielded room at MIT, and used one of the first SQUID detectors, just developed by James E. Zimmerman, a researcher at Ford Motor Company,[5] to again measure MEG signals.[6] This time the signals were almost as clear as those of EEG. This stimulated the interest of physicists who had been looking for uses of SQUIDs. Subsequent to this, various types of spontaneous and evoked MEGs began to be measured.
At first, a single SQUID detector was used to successively measure the magnetic field at a number of points around the subject's head. This was cumbersome, and, in the 1980s, MEG manufacturers began to arrange multiple sensors into arrays to cover a larger area of the head.[7] Present-day MEG arrays are set in a helmet-shaped vacuum flask that typically contain 300 sensors, covering most of the head. In this way, MEGs of a subject or patient can now be accumulated rapidly and efficiently.
Recent developments attempt to increase portability of MEG scanners by using spin exchange relaxation-free (SERF) magnetometers. SERF magnetometers are relatively small, as they do not require bulky cooling systems to operate. At the same time, they feature sensitivity equivalent to that of SQUIDs. In 2012, it was demonstrated that MEG could work with a chip-scale atomic magnetometer (CSAM, type of SERF).[8] More recently, in 2017, researchers built a working prototype that uses SERF magnetometers installed into portable individually 3D-printed helmets,[2] which they noted in interviews could be replaced with something easier to use in future, such as a bike helmet.
The basis of the MEG signal
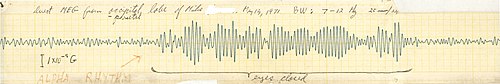
Synchronized neuronal currents induce weak magnetic fields. The brain's magnetic field, measuring at 10 femtotesla (fT) for cortical activity and 103 fT for the human alpha rhythm, is considerably smaller than the ambient magnetic noise in an urban environment, which is on the order of 108 fT or 0.1 μT. The essential problem of biomagnetism is, thus, the weakness of the signal relative to the sensitivity of the detectors, and to the competing environmental noise.
Origin of the brain's magnetic field. The electric current also produces the EEG signal.
The MEG (and EEG) signals derive from the net effect of ionic currents flowing in the dendrites of neurons during synaptic transmission. In accordance with Maxwell's equations, any electrical current will produce a magnetic field, and it is this field that is measured. The net currents can be thought of as current dipoles,[1] i.e. currents with a position, orientation, and magnitude, but which don't follow the spatial extent of the actual currents in the neural tissue, but arise from their summation. According to the right-hand rule, a current dipole gives rise to a magnetic field that points around the axis of its vector component.
To generate a signal that is detectable, approximately 50,000 active neurons are needed.[9] Since current dipoles must have similar orientations to generate magnetic fields that reinforce each other, it is often the layer of pyramidal cells, which are situated perpendicular to the cortical surface, that gives rise to measurable magnetic fields. Bundles of these neurons that are orientated tangentially to the scalp surface project measurable portions of their magnetic fields outside of the head, and these bundles are typically located in the sulci. Researchers are experimenting with various signal processing methods in the search for methods that detect deep brain (i.e., non-cortical) signal, but no clinically useful method is currently available.
It is worth noting that action potentials do not usually produce an observable field, mainly because the currents associated with action potentials flow in opposite directions and the magnetic fields cancel out. However, action fields have been measured from peripheral nerve system.
Magnetic shielding
Since the magnetic signals emitted by the brain are on the order of a few femtoteslas, shielding from external magnetic signals, including the Earth's magnetic field, is necessary. Appropriate magnetic shielding can be obtained by constructing rooms made of aluminium and mu-metal for reducing high-frequency and low-frequency noise, respectively.
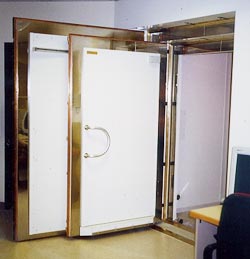
Entrance to MSR, showing the separate shielding layers
Magnetically shielded room (MSR)
A magnetically shielded room (MSR) model consists of three nested main layers. Each of these layers is made of a pure aluminium layer plus a high-permeability ferromagnetic layer, similar in composition to molybdenum permalloy. The ferromagnetic layer is supplied as 1mm sheets, while the innermost layer is composed of four sheets in close contact, and the outer two layers are composed of three sheets each. Magnetic continuity is maintained by overlay strips. Insulating washers are used in the screw assemblies to ensure that each main layer is electrically isolated. This helps eliminate radio frequency radiation, which would degrade SQUID performance. Electrical continuity of the aluminium is also maintained by aluminium overlay strips to ensure ACeddy current shielding, which is important at frequencies greater than 1Hz. The junctions of the inner layer are often electroplated with silver or gold to improve conductivity of the aluminium layers.[10]
Active shielding system
Active systems are designed for three-dimensional noise cancellation. To implement an active system, low-noise fluxgate magnetometers are mounted at the center of each surface and oriented orthogonally to it. This negatively feeds a DC amplifier through a low-pass network with a slow falloff to minimize positive feedback and oscillation. Built into the system are shaking and degaussing wires. Shaking wires increase the magnetic permeability, while the permanent degaussing wires are applied to all surfaces of the inner main layer to degauss the surfaces.[4] Moreover, noise cancellation algorithms can reduce both low-frequency and high-frequency noise. Modern systems have a noise floor of around 2–3fT/Hz0.5 above 1Hz.
The challenge posed by MEG is to determine the location of electric activity within the brain from the induced magnetic fields outside the head. Problems such as this, where model parameters (the location of the activity) have to be estimated from measured data (the SQUID signals) are referred to as inverse problems (in contrast to forward problems[11] where the model parameters (e.g. source location) are known and the data (e.g. the field at a given distance) is to be estimated.) The primary difficulty is that the inverse problem does not have a unique solution (i.e., there are infinite possible "correct" answers), and the problem of defining the "best" solution is itself the subject of intensive research.[12] Possible solutions can be derived using models involving prior knowledge of brain activity.
The source models can be either over-determined or under-determined. An over-determined model may consist of a few point-like sources ("equivalent dipoles"), whose locations are then estimated from the data. Under-determined models may be used in cases where many different distributed areas are activated ("distributed source solutions"): there are infinitely many possible current distributions explaining the measurement results, but the most likely is selected. Localization algorithms make use of given source and head models to find a likely location for an underlying focal field generator.
One type of localization algorithm for overdetermined models operates by expectation-maximization: the system is initialized with a first guess. A loop is started, in which a forward model is used to simulate the magnetic field that would result from the current guess. The guess is adjusted to reduce the discrepancy between the simulated field and the measured field. This process is iterated until convergence.
Another common technique is beamforming, wherein a theoretical model of the magnetic field produced by a given current dipole is used as a prior, along with second-order statistics of the data in the form of a covariance matrix, to calculate a linear weighting of the sensor array (the beamformer) via the Backus-Gilbert inverse. This is also known as a linearly constrained minimum variance (LCMV) beamformer. When the beamformer is applied to the data, it produces an estimate of the power in a "virtual channel" at the source location.
The extent to which the constraint-free MEG inverse problem is ill-posed cannot be overemphasized. If one's goal is to estimate the current density within the human brain with say a 5mm resolution then it is well established that the vast majority of the information needed to perform a unique inversion must come not from the magnetic field measurement but rather from the constraints applied to the problem. Furthermore, even when a unique inversion is possible in the presence of such constraints said inversion can be unstable. These conclusions are easily deduced from published works.[13]
Magnetic source imaging
The source locations can be combined with magnetic resonance imaging (MRI) images to create magnetic source images (MSI). The two sets of data are combined by measuring the location of a common set of fiducial points marked during MRI with lipid markers and marked during MEG with electrified coils of wire that give off magnetic fields. The locations of the fiducial points in each data set are then used to define a common coordinate system so that superimposing the functional MEG data onto the structural MRI data ("coregistration") is possible.
A criticism of the use of this technique in clinical practice is that it produces colored areas with definite boundaries superimposed upon an MRI scan: the untrained viewer may not realize that the colors do not represent a physiological certainty, not because of the relatively low spatial resolution of MEG, but rather some inherent uncertainty in the probability cloud derived from statistical processes. However, when the magnetic source image corroborates other data, it can be of clinical utility.
Dipole model source localization
A widely accepted source-modeling technique for MEG involves calculating a set of equivalent current dipoles (ECDs), which assumes the underlying neuronal sources to be focal. This dipole fitting procedure is non-linear and over-determined, since the number of unknown dipole parameters is smaller than the number of MEG measurements.[14] Automated multiple dipole model algorithms such as multiple signal classification (MUSIC) and multi-start spatial and temporal modeling (MSST) are applied to the analysis of MEG responses. The limitations of dipole models for characterizing neuronal responses are (1) difficulties in localizing extended sources with ECDs, (2) problems with accurately estimating the total number of dipoles in advance, and (3) dependency on dipole location, especially depth in the brain.
Distributed source models
Unlike multiple-dipole modeling, distributed source models divide the source space into a grid containing a large number of dipoles. The inverse problem is to obtain the dipole moments for the grid nodes.[15] As the number of unknown dipole moments is much greater than the number of MEG sensors, the inverse solution is highly underdetermined, so additional constraints are needed to reduce ambiguity of the solution. The primary advantage of this approach is that no prior specification of the source model is necessary. However, the resulting distributions may be difficult to interpret, because they only reflect a "blurred" (or even distorted) image of the true neuronal source distribution. The matter is complicated by the fact that spatial resolution depends strongly on various parameters such as brain area, depth, orientation, number of sensors etc.[16]
Independent component analysis (ICA)
Independent component analysis (ICA) is another signal processing solution that separates different signals that are statistically independent in time. It is primarily used to remove artifacts such as blinking, eye muscle movement, facial muscle artifacts, cardiac artifacts, etc. from MEG and EEG signals that may be contaminated with outside noise.[17] However, ICA has poor resolution of highly correlated brain sources.
Use in the field
Over 100 MEG systems are known to operate worldwide, with Japan possessing the greatest number of MEG systems per capita and the United States possessing the greatest overall number of MEG systems. A very small number of systems worldwide are designed for infant and/or fetal recordings.
In research, MEG's primary use is the measurement of time courses of activity. MEG can resolve events with a precision of 10 milliseconds or faster, while functional magnetic resonance imaging (fMRI), which depends on changes in blood flow, can at best resolve events with a precision of several hundred milliseconds. MEG also accurately pinpoints sources in primary auditory, somatosensory, and motor areas. For creating functional maps of human cortex during more complex cognitive tasks, MEG is most often combined with fMRI, as the methods complement each other. Neuronal (MEG) and hemodynamic fMRI data do not necessarily agree, in spite of the tight relationship between local field potentials (LFP) and blood oxygenation level-dependent (BOLD) signals. MEG and BOLD signals may originate from the same source (though the BOLD signals are filtered through the hemodynamic response).
MEG is also being used to better localize responses in the brain. The openness of the MEG setup allows external auditory and visual stimuli to be easily introduced. Some movement by the subject is also possible as long as it does not jar the subject's head. The responses in the brain before, during, and after the introduction of such stimuli/movement can then be mapped with greater spatial resolution than was previously possible with EEG.[18] Psychologists are also taking advantage of MEG neuroimaging to better understand relationships between brain function and behavior. For example, a number of studies have been done comparing the MEG responses of patients with psychological troubles to control patients. There has been great success isolating unique responses in patients with schizophrenia, such as auditory gating deficits to human voices.[19] MEG is also being used to correlate standard psychological responses, such as the emotional dependence of language comprehension.[20]
A large part of the difficulty and cost of using MEG is the need for manual analysis of the data. Progress has been made in analysis by computer, comparing a patient's scans with those drawn from a large database of normal scans, with the potential to reduce cost greatly.[23]
Brain connectivity and neural oscillations
Based on its perfect temporal resolution, magnetoencephalography (MEG) is now heavily used to study oscillatory activity in the brain, both in terms of local neural synchrony and cross-area synchronisation. As an example for local neural synchrony, MEG has been used to investigate alpha rhythms in various targeted brain regions, such as in visual[24][25] or auditory cortex.[26] Other studies have used MEG to study the neural interactions between different brain regions (e.g., between frontal cortex and visual cortex).[27] Magnetoencephalography can also be used to study changes in neural oscillations across different stages of consciousness, such as in sleep.[28]
Focal epilepsy
The clinical uses of MEG are in detecting and localizing pathological activity in patients with epilepsy, and in localizing eloquent cortex for surgical planning in patients with brain tumors or intractable epilepsy. The goal of epilepsy surgery is to remove the epileptogenic tissue while sparing healthy brain areas.[29] Knowing the exact position of essential brain regions (such as the primary motor cortex and primary sensory cortex, visual cortex, and areas involved in speech production and comprehension) helps to avoid surgically induced neurological deficits. Direct cortical stimulation and somatosensory evoked potentials recorded on electrocorticography (ECoG) are considered the gold standard for localizing essential brain regions. These procedures can be performed either intraoperatively or from chronically indwelling subdural grid electrodes. Both are invasive.
Noninvasive MEG localizations of the central sulcus obtained from somatosensory evoked magnetic fields show strong agreement with these invasive recordings.[30][31][32] MEG studies assist in clarification of the functional organization of primary somatosensory cortex and to delineate the spatial extent of hand somatosensory cortex by stimulation of the individual digits. This agreement between invasive localization of cortical tissue and MEG recordings shows the effectiveness of MEG analysis and indicates that MEG may substitute invasive procedures in the future.
Fetal
MEG has been used to study cognitive processes such as vision, audition, and language processing in fetuses and newborns.[33] Only two bespoke MEG systems, designed specifically for fetal recordings, operate worldwide.[34] The first was installed at the University of Arkansas in 2000, and the second was installed at the University of Tübingen in 2008. Both devices are referred to as SQUID arrays for reproductive assessment (SARA) and utilize a concave sensor array whose shape compliments the abdomen of a pregnant woman. Fetal recordings of cortical activity are feasible with a SARA device from a gestational age of approximately 25 weeks onward until birth. Although built for fetal recordings, SARA systems can also record from infants placed in a cradle head-first toward the sensory array.[34] A third high density custom-made unit with similar whole abdomen coverage has been installed in 2002 at the University of Kansas Medical Center to assess fetal electrophysiology.[35][36] While only a small number of devices worldwide are capable of fetal MEG recordings as of 2023, the proliferation of optically pumped magnetometers for MEG in neuroscience research[37] will likely result in a greater number of research centers capable of recording and publishing fetal MEG data in the near future.[34]
Traumatic brain injury
MEG can be used to identify traumatic brain injury, which is particularly common among soldiers exposed to explosions. Such injuries are not easily diagnosed by other methods, as the symptoms (e.g. sleep disturbances, memory problems) overlap with those from frequent co-comorbidities such as post-traumatic stress disorder (PTSD).[23]
Comparison with related techniques
MEG has been in development since the 1960s but has been greatly aided by recent advances in computing algorithms and hardware, and promises improved spatial resolution coupled with extremely high temporal resolution (better than 1 ms). Since the MEG signal is a direct measure of neuronal activity, its temporal resolution is comparable with that of intracranial electrodes.
MEG complements other brain activity measurement techniques such as electroencephalography (EEG), positron emission tomography (PET), and fMRI. Its strengths consist in independence of head geometry compared to EEG (unless ferromagneticimplants are present), non-invasiveness, use of no ionizing radiation, as opposed to PET and high temporal resolution as opposed to fMRI.
MEG in comparison to EEG
Although EEG and MEG signals originate from the same neurophysiological processes, there are important differences.[38] Magnetic fields are less distorted than electric fields by the skull and scalp, which results in a better spatial resolution of the MEG. Whereas scalp EEG is sensitive to both tangential and radial components of a current source in a spherical volume conductor, MEG detects only its tangential components. Scalp EEG can, therefore, detect activity both in the sulci and at the top of the cortical gyri, whereas MEG is most sensitive to activity originating in sulci. EEG is, therefore, sensitive to activity in more brain areas, but activity that is visible in MEG can also be localized with more accuracy.
Scalp EEG is sensitive to extracellular volume currents produced by postsynaptic potentials. MEG detects intracellular currents associated primarily with these synaptic potentials because the field components generated by volume currents tend to cancel out in a spherical volume conductor.[39] The decay of magnetic fields as a function of distance is more pronounced than for electric fields. Therefore, MEG is more sensitive to superficial cortical activity, which makes it useful for the study of neocortical epilepsy. Finally, MEG is reference-free, while scalp EEG relies on a reference that, when active, makes interpretation of the data difficult.
↑Yamamoto T, Williamson SJ, Kaufman L, Nicholson C, Llinas R: Magnetic localization of neuronal activity in the human brain. Proc Natl Acad Sci 85:8732-8736,1988[9]
↑Hämäläinen MS, Ilmoniemi RJ (January 1994). "Interpreting magnetic fields of the brain: minimum norm estimates". Medical & Biological Engineering & Computing. 32 (1): 35–42. doi:10.1007/BF02512476. PMID8182960. S2CID6796187.
↑Molins A, Stufflebeam SM, Brown EN, Hämäläinen MS (September 2008). "Quantification of the benefit from integrating MEG and EEG data in minimum ℓ2-norm estimation". NeuroImage. 42 (3): 1069–77. doi:10.1016/j.neuroimage.2008.05.064. PMID18602485. S2CID6462818.
↑Jung TP, Makeig S, Westerfield M, Townsend J, Courchesne E, Sejnowski TJ (October 2000). "Removal of eye activity artifacts from visual event-related potentials in normal and clinical subjects". Clinical Neurophysiology. 111 (10): 1745–58. CiteSeerX10.1.1.164.9941. doi:10.1016/S1388-2457(00)00386-2. PMID11018488. S2CID11044416.
↑Cui R, Cunnington R, Beisteiner R, Deecke L (2012). "Effects of force-load on cortical activity preceding voluntary finger movement". Neurology, Psychiatry and Brain Research. 18 (3): 97–104. doi:10.1016/j.npbr.2012.03.001.
↑Hirano Y, Hirano S, Maekawa T, Obayashi C, Oribe N, Monji A, etal. (March 2010). "Auditory gating deficit to human voices in schizophrenia: a MEG study". Schizophrenia Research. 117 (1): 61–7. doi:10.1016/j.schres.2009.09.003. PMID19783406. S2CID7845180.
↑Ihara A, Wei Q, Matani A, Fujimaki N, Yagura H, Nogai T, etal. (January 2012). "Language comprehension dependent on emotional context: a magnetoencephalography study". Neuroscience Research. 72 (1): 50–8. doi:10.1016/j.neures.2011.09.011. PMID22001763. S2CID836242.
↑de Vries E, Baldauf D (October 2019). "Attentional Weighting in the Face Processing Network: A Magnetic Response Image-guided Magnetoencephalography Study Using Multiple Cyclic Entrainments". Journal of Cognitive Neuroscience. 31 (10): 1573–1588. doi:10.1162/jocn_a_01428. hdl:11572/252722. PMID31112470. S2CID160012572.
↑Luders HO (1992). Epilepsy Surgery. New York Raven Press.
↑Sutherling WW, Crandall PH, Darcey TM, Becker DP, Levesque MF, Barth DS (November 1988). "The magnetic and electric fields agree with intracranial localizations of somatosensory cortex". Neurology. 38 (11): 1705–14. doi:10.1212/WNL.38.11.1705. PMID3185905. S2CID8828767.
↑Rowley HA, Roberts TP (November 1995). "Functional localization by magnetoencephalography". Neuroimaging Clinics of North America. 5 (4): 695–710. doi:10.1016/S1052-5149(25)00331-4. PMID8564291.
↑Gallen CC, Hirschkoff EC, Buchanan DS (May 1995). "Magnetoencephalography and magnetic source imaging. Capabilities and limitations". Neuroimaging Clinics of North America. 5 (2): 227–49. doi:10.1016/S1052-5149(25)00292-8. PMID7640886.
Suk J, Ribary U, Cappell J, Yamamoto T, Llinás R (March 1991). "Anatomical localization revealed by MEG recordings of the human somatosensory system". Electroencephalography and Clinical Neurophysiology. 78 (3): 185–96. doi:10.1016/0013-4694(91)90032-y. PMID1707790.
This page is based on this Wikipedia article Text is available under the CC BY-SA 4.0 license; additional terms may apply. Images, videos and audio are available under their respective licenses.