Elections to Trafford Council were held on 2 May 1996. One-third of the council was up for election, with each successful candidate to serve a four-year term of office, expiring in 2000. The Labour Party gained overall control of the council, from no overall control. [1]
Trafford is a metropolitan borough of Greater Manchester, England, with an estimated population of 235,493 in 2017. It covers 41 square miles (106 km2) and includes the areas of Old Trafford, Stretford, Urmston, Altrincham, Partington and Sale. The borough was formed in 1974 as a merger of the metropolitan boroughs of Altrincham, Sale, and Stretford, the urban districts of Bowdon, Hale and Urmston and part of Bucklow Rural District. The River Mersey flows through the borough, separating North Trafford from South Trafford, and the historic counties of Lancashire and Cheshire.
The Labour Party is a centre-left political party in the United Kingdom which has been described as an alliance of social democrats, democratic socialists and trade unionists. The party's platform emphasises greater state intervention, social justice and strengthening workers' rights.
In the context of local authorities in the United Kingdom, the term no overall control refers to a situation in which no single political group achieves a majority of seats; and is analogous to a hung parliament. Of the 310 councils who had members up for election in the 2007 local elections, 85 resulted in a NOC administration.
After the election, the composition of the council was as follows:
Party | Seats | +/- | |
---|---|---|---|
Labour | 35 | +6 | |
Conservative | 23 | -6 | |
Liberal Democrat | 5 | 0 | |
Labour gain from NOC |
Party | Candidate | Votes | % | ± | |
---|---|---|---|---|---|
Conservative | S. M. O'Bierne* | 1,676 | 49.3 | +6.2 | |
Labour | S. D. McNee | 1,399 | 41.2 | -7.9 | |
Liberal Democrat | J. B. Weightman | 322 | 9.5 | +1.2 | |
Majority | 277 | 8.2 | +2.2 | ||
Turnout | 3,397 | 38.2 | -5.9 | ||
Conservative hold | Swing |
Party | Candidate | Votes | % | ± | |
---|---|---|---|---|---|
Conservative | D. Merrell* | 2,150 | 61.3 | +1.1 | |
Labour | M. A. Busteed | 692 | 19.8 | -3.1 | |
Liberal Democrat | R. M. Elliott | 668 | 19.0 | +2.1 | |
Majority | 1,458 | 41.5 | +4.3 | ||
Turnout | 3,510 | 38.2 | -0.2 | ||
Conservative hold | Swing |
Party | Candidate | Votes | % | ± | |
---|---|---|---|---|---|
Conservative | K. Bullock* | 1,767 | 47.2 | +9.5 | |
Labour | H. K. Western | 1,660 | 44.4 | -9.2 | |
Liberal Democrat | P. A. Stubbs | 314 | 8.4 | -0.3 | |
Majority | 107 | 2.9 | -13.0 | ||
Turnout | 3,741 | 43.7 | -1.1 | ||
Conservative hold | Swing |
Party | Candidate | Votes | % | ± | |
---|---|---|---|---|---|
Conservative | C. J. J. Lynch | 1,626 | 49.0 | -0.9 | |
Labour | J. A. Lloyd | 1,190 | 35.8 | +8.7 | |
Liberal Democrat | K. Clarke | 505 | 15.2 | +1.6 | |
Majority | 436 | 13.1 | -9.7 | ||
Turnout | 3,321 | 42.1 | -2.7 | ||
Conservative hold | Swing |
Party | Candidate | Votes | % | ± | |
---|---|---|---|---|---|
Labour | H. Faulkner* | 1,394 | 82.6 | +5.3 | |
Independent | F. Holland | 149 | 8.8 | -13.9 | |
Conservative | H. L. Wilde | 145 | 8.6 | +8.6 | |
Majority | 993 | 58.8 | +4.2 | ||
Turnout | 1,688 | 27.5 | -5.6 | ||
Labour hold | Swing |
Party | Candidate | Votes | % | ± | |
---|---|---|---|---|---|
Labour | P. A. Dunnico | 1,367 | 64.8 | -15.9 | |
Independent | M. Ali | 374 | 17.7 | +17.7 | |
Conservative | A. J. McDonald | 370 | 17.5 | -1.8 | |
Majority | 993 | 47.0 | -14.5 | ||
Turnout | 2,111 | 29.2 | -3.8 | ||
Labour hold | Swing |
Party | Candidate | Votes | % | ± | |
---|---|---|---|---|---|
Conservative | F. H. Eadie* | 1,643 | 57.6 | +2.0 | |
Labour | S. Hesford | 1,211 | 42.4 | -2.0 | |
Majority | 432 | 15.1 | +3.8 | ||
Turnout | 2,854 | 41.8 | -2.9 | ||
Conservative hold | Swing |
Party | Candidate | Votes | % | ± | |
---|---|---|---|---|---|
Conservative | J. K. Ackerley* | 1,697 | 50.2 | +7.7 | |
Labour | F. Mottley | 1,686 | 49.8 | -0.4 | |
Majority | 11 | 0.3 | -7.4 | ||
Turnout | 3,383 | 43.0 | -3.8 | ||
Conservative hold | Swing |
Party | Candidate | Votes | % | ± | |
---|---|---|---|---|---|
Conservative | E. V. Ward* | 1,534 | 42.5 | +2.7 | |
Labour | M. G. H. Barker | 1,506 | 41.7 | -1.9 | |
Liberal Democrat | A. Vernon | 571 | 15.8 | -0.8 | |
Majority | 28 | 0.8 | -3.1 | ||
Turnout | 3,611 | 46.2 | -3.4 | ||
Conservative hold | Swing |
Party | Candidate | Votes | % | ± | |
---|---|---|---|---|---|
Conservative | B. L. Hepburn | 2,119 | 59.7 | +1.9 | |
Liberal Democrat | C. S. Fink | 960 | 27.0 | -8.9 | |
Labour | R. E. Lucas | 473 | 13.3 | -1.3 | |
Majority | 1,159 | 32.6 | -0.7 | ||
Turnout | 3,552 | 42.1 | -2.2 | ||
Conservative hold | Swing |
Party | Candidate | Votes | % | ± | |
---|---|---|---|---|---|
Labour | T. S. Faltermeyer | 1,544 | 59.1 | -2.0 | |
Conservative | K. G. Summerfield* | 1,068 | 40.9 | +2.0 | |
Majority | 476 | 18.2 | -3.9 | ||
Turnout | 2,612 | 35.4 | -3.7 | ||
Labour gain from Conservative | Swing | ||||
Party | Candidate | Votes | % | ± | |
---|---|---|---|---|---|
Conservative | J. Tolhurst* | 1,878 | 50.1 | +3.2 | |
Labour | A. Guttridge | 1,318 | 35.1 | -0.2 | |
Liberal Democrat | R. J. Thompson | 554 | 14.8 | +3.9 | |
Majority | 560 | 14.9 | +3.2 | ||
Turnout | 3,750 | 38.3 | -5.6 | ||
Conservative hold | Swing |
Party | Candidate | Votes | % | ± | |
---|---|---|---|---|---|
Labour | J. Williams* | 1,307 | 66.8 | +0.1 | |
Conservative | E. J. Kelson | 650 | 33.2 | -0.1 | |
Majority | 657 | 33.6 | +0.2 | ||
Turnout | 1,957 | 32.4 | -4.6 | ||
Labour hold | Swing |
Party | Candidate | Votes | % | ± | |
---|---|---|---|---|---|
Labour | R. O. Griffin | 1,540 | 43.6 | +3.0 | |
Liberal Democrat | D. M. Browne | 1,171 | 33.1 | -0.8 | |
Conservative | L. M. L. Burton | 822 | 23.3 | -2.2 | |
Majority | 369 | 10.4 | +3.7 | ||
Turnout | 3,533 | 45.8 | -2.9 | ||
Labour gain from Conservative | Swing | ||||
Party | Candidate | Votes | % | ± | |
---|---|---|---|---|---|
Labour | H. F. Busteed | 1,499 | 48.7 | -4.4 | |
Conservative | D. R. Baldwin* | 1,169 | 38.0 | +0.3 | |
Liberal Democrat | M. E. Clarke | 410 | 13.3 | +4.1 | |
Majority | 330 | 10.7 | -4.7 | ||
Turnout | 3,078 | 40.3 | -3.5 | ||
Labour gain from Conservative | Swing | ||||
Party | Candidate | Votes | % | ± | |
---|---|---|---|---|---|
Labour | K. C. Harper | 1,915 | 62.3 | -2.5 | |
Conservative | M. O. Joyce | 922 | 30.0 | -5.2 | |
Liberal Democrat | D. J. Kelly | 235 | 7.6 | +7.6 | |
Majority | 993 | 32.3 | +2.7 | ||
Turnout | 3,072 | 35.2 | -4.0 | ||
Labour gain from Conservative | Swing | ||||
Party | Candidate | Votes | % | ± | |
---|---|---|---|---|---|
Labour | P. Dolan | 1,899 | 62.3 | -3.9 | |
Conservative | H. Walker* | 1,151 | 37.7 | +3.9 | |
Majority | 748 | 24.5 | -7.9 | ||
Turnout | 3,050 | 40.1 | -2.8 | ||
Labour gain from Conservative | Swing | ||||
Party | Candidate | Votes | % | ± | |
---|---|---|---|---|---|
Labour | A. Bates* | 1,312 | 76.3 | -1.9 | |
Conservative | C. J. Levenston | 381 | 22.2 | +2.0 | |
Independent | K. J. Martin | 27 | 1.6 | +0.1 | |
Majority | 931 | 54.1 | -3.9 | ||
Turnout | 1,720 | 28.0 | -5.5 | ||
Labour hold | Swing |
Party | Candidate | Votes | % | ± | |
---|---|---|---|---|---|
Conservative | A. K. Davies* | 1,453 | 41.0 | +3.6 | |
Liberal Democrat | C. Smith | 1,257 | 35.4 | -4.9 | |
Labour | A. P. Roberts | 836 | 23.6 | +1.3 | |
Majority | 196 | 5.5 | -2.6 | ||
Turnout | 3,546 | 40.8 | -3.4 | ||
Conservative hold | Swing |
Party | Candidate | Votes | % | ± | |
---|---|---|---|---|---|
Labour | W. Clarke | 1,961 | 61.9 | -0.6 | |
Conservative | A. Smith | 1,208 | 38.1 | +0.6 | |
Majority | 753 | 23.8 | -1.1 | ||
Turnout | 3,169 | 43.1 | -4.9 | ||
Labour gain from Conservative | Swing | ||||
Party | Candidate | Votes | % | ± | |
---|---|---|---|---|---|
Liberal Democrat | R. Bowker* | 2,377 | 59.5 | +11.7 | |
Conservative | H. Scholar | 961 | 24.1 | -7.2 | |
Labour | S. N. Humby | 657 | 16.4 | -4.5 | |
Majority | 1,416 | 35.4 | +19.0 | ||
Turnout | 3,995 | 42.5 | 0 | ||
Liberal Democrat hold | Swing |
One third of City of Bradford Metropolitan District Council is elected each year, followed by one year without election.
One third of Calderdale Metropolitan Borough Council in West Yorkshire, England is elected each year, followed by one year without election.
Bristol City Council is the local authority of Bristol, England. The council is a unitary authority, and is unusual in the United Kingdom in that its executive function is controlled by a directly elected mayor of Bristol. Bristol has 35 wards, electing a total of 70 councillors.
Elections to Rochdale Council were held on 7 May 1998. One third of the council was up for election and the Labour party kept overall control of the council where they defeated the Liberal Democrats in 1996.
Elections to Sheffield City Council were held on 7 May 1998. One third of the council was up for election and the Labour party kept overall control of the council.
Sheffield City Council elections took place on Thursday 3 May 2007 with one third of council seats up for election; one in each ward. Since the previous election, Liberal Democrat Martin Davis defected, sitting as an independent. This set of elections saw the Conservatives lose the only seat they had on the council since 1996, and the party have not had any councillors elected to Sheffield City Council in any elections since.
The 1998 Tunbridge Wells Borough Council election took place on 7 May 1998 to elect members of Tunbridge Wells Borough Council in Kent, England. One third of the council was up for election and the Conservative party gained overall control of the council from no overall control.
Elections to Stevenage Council were held on 2 May 1996. One third of the council was up for election and the Labour party stayed in overall control of the council. The council was one of a number where the Conservatives lost their last seats.
The 1998 City of Lincoln Council election took place on 7 May 1998 to elect members of Lincoln District Council in Lincolnshire, England. One third of the council was up for election and the Labour party stayed in overall control of the Council.
Elections to Wolverhampton Metropolitan Borough Council were held on 2 May 1996. One third of the council was up for election and the Labour Party retained overall control of the Council, gaining seven seats at the expense of the Conservative group.
Elections to Trafford Council were held on 7 May 1992. One-third of the council was up for election, with each successful candidate to serve a four-year term of office, expiring in 1996. The Conservative party retained overall control of the council.
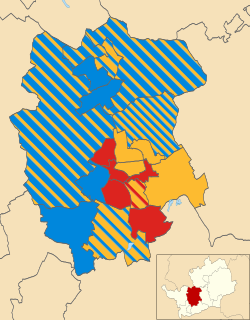
The 1999 St Albans City and District Council election took place on 6 May 1999 to elect members of St Albans City and District Council in Hertfordshire, England. The whole council was up for election with boundary changes since the last election in 1998 increasing the number of seats by 1. The Liberal Democrats lost overall control of the council to no overall control.
Elections to Manchester Council were held on Thursday, 7 May 1992. One third of the council was up for election, with each successful candidate to serve a four-year term of office, expiring in 1996. The Labour Party retained overall control of the Council.
Elections to Manchester Council were held on Thursday, 2 May 1996. One third of the council was up for election, with each successful candidate to serve a four-year term of office, expiring in 2000. There were also two vacancies being contested; one in Blackley and the other in Woodhouse Park. The Labour Party retained overall control of the Council.
The 1999 Solihull Metropolitan Borough Council election took place on 6 May 1999 to elect members of Solihull Metropolitan Borough Council in the West Midlands, England. One third of the council was up for election and the council stayed under no overall control.
The 1998 Eastbourne Borough Council election took place on 7 May 1998 to elect members of Eastbourne Borough Council in East Sussex, England. One third of the council was up for election and the Liberal Democrats stayed in overall control of the council.
The Solihull Metropolitan Borough Council elections were held on Thursday, 2 May 1996, with one third of the council to be elected. The council remained under no overall control, with the Conservatives and Independent Ratepayer and Residents no longer holding enough seats to continue their coalition. Voter turnout was 35.4%.
The 1996 Bolton Metropolitan Borough Council election took place on 2 May 1996 to elect members of Bolton Metropolitan Borough Council in Greater Manchester, England. One third of the council was up for election and the Labour party kept overall control of the council
Elections to Liverpool City Council were held on 2 May 1996. One third of the council was up for election and the Labour party achieved overall control of the council.