Elections to Vale of White Horse District Council were held on 3 May 2007. The whole council was up for election and the council stayed under Liberal Democrat control with an increased majority. Turnout was significantly higher in many wards than it was in 2003.
The Vale of White Horse is a local government district of Oxfordshire in England. Located south of the River Thames, it is within the historic county boundaries of Berkshire.
Non-metropolitan districts, or colloquially "shire districts", are a type of local government district in England. As created, they are sub-divisions of non-metropolitan counties in a two-tier arrangement.
Composition of the council following the 2007 election:
Party | Seats | Gains | Losses | Net gain/loss | Seats % | Votes % | Votes | +/− | |
---|---|---|---|---|---|---|---|---|---|
Liberal Democrat | 34 | 7 | 2 | +5 | 67 | 45.6 | 32,119 | ||
Conservative | 17 | 2 | 6 | -4 | 33 | 45.5 | 32,089 | ||
Labour | 0 | 0 | 0 | - | 0 | 5.9 | 4,178 | ||
Green | 0 | 0 | 0 | - | 0 | 1.8 | 1,270 | ||
UKIP | 0 | 0 | 0 | - | 0 | 1.2 | 854 | ||
Party | Candidate | Votes | % | ± | |
---|---|---|---|---|---|
Liberal Democrat | Anthony De Vere | 784 | |||
Liberal Democrat | Julie Mayhew-Archer | 777 | |||
Conservative | Andrew Hoare | 510 | |||
Conservative | Jennifer Standen | 505 | |||
Labour | Rachel Eden | 156 | |||
Majority | |||||
Turnout | |||||
Party | Candidate | Votes | % | ± | |
---|---|---|---|---|---|
Liberal Democrat | Mary De Vere | 485 | |||
Liberal Democrat | Paul Burton | 462 | |||
Conservative | Paul Campbell | 388 | |||
Conservative | Elwyn McKeown | 379 | |||
Labour | David Banner | 118 | |||
Green | Hazel Hornblow | 86 | |||
Majority | |||||
Turnout | |||||
Party | Candidate | Votes | % | ± | |
---|---|---|---|---|---|
Liberal Democrat | Janet Morgan | 991 | |||
Liberal Democrat | Timothy Smith | 964 | |||
Conservative | Peter Jones | 777 | |||
Conservative | Sandy Lovatt | 758 | |||
Labour | Brian Jeffries | 119 | |||
Majority | |||||
Turnout | |||||
Party | Candidate | Votes | % | ± | |
---|---|---|---|---|---|
Liberal Democrat | Richard Gibson | 802 | |||
Liberal Democrat | Jim Halliday | ||||
Conservative | Monica Lovatt | 551 | |||
Conservative | Jackie Carpenter | 543 | |||
Green | Dorothy Shaw | 155 | |||
Labour | Bridget Wilkinson | 90 | |||
Majority | |||||
Turnout | |||||
Party | Candidate | Votes | % | ± | |
---|---|---|---|---|---|
Liberal Democrat | Angela Lawrence | 781 | |||
Liberal Democrat | Laurel Symons' | 744 | |||
Conservative | Guy Rogers | 560 | |||
Conservative | Mohammed Yusuf | 473 | |||
Labour | Denise Watt | 151 | |||
Majority | |||||
Turnout | |||||
Party | Candidate | Votes | % | ± | |
---|---|---|---|---|---|
Liberal Democrat | Samantha Bowring | 805 | |||
Liberal Democrat | Beth Flemming | 744 | |||
Conservative | Charles Badcock | 698 | |||
Conservative | Marylin Badcock | 677 | |||
Majority | |||||
Turnout | |||||
Party | Candidate | Votes | % | ± | |
---|---|---|---|---|---|
Liberal Democrat | Alison Rooke | 904 | |||
Liberal Democrat | Pat Lonergan | 845 | |||
Conservative | Patrick Clipperton | 662 | |||
Conservative | Maurice Shea | 606 | |||
Majority | |||||
Turnout | |||||
Party | Candidate | Votes | % | ± | |
---|---|---|---|---|---|
Liberal Democrat | Stuart Hoddinott | 1,142 | |||
Liberal Democrat | Judy Roberts | 1,139 | |||
Liberal Democrat | John Woodford | 1,020 | |||
Conservative | Ian Gearing | 790 | |||
Conservative | David Calvert | 672 | |||
Conservative | Malcolm Walls | 669 | |||
UKIP | Pam Gee | 385 | |||
Green | Marie Spragg | 300 | |||
UKIP | Jacqueline Jones | 263 | |||
UKIP | Peter Jones | 206 | |||
Majority | |||||
Turnout | |||||
Party | Candidate | Votes | % | ± | |
---|---|---|---|---|---|
Liberal Democrat | Richard Farrell | 463 | |||
Conservative | Robert Manley | 314 | |||
Majority | |||||
Turnout | |||||
Party | Candidate | Votes | % | ± | |
---|---|---|---|---|---|
Conservative | Yvonne Constance | 650 | |||
Liberal Democrat | James Sibbald | 115 | |||
Labour | James Douglas | 106 | |||
Majority | |||||
Turnout | |||||
Party | Candidate | Votes | % | ± | |
---|---|---|---|---|---|
Liberal Democrat | Richard Weber | 503 | |||
Conservative | David Price | 178 | |||
Green | Ruth Johnson | 53 | |||
Majority | |||||
Turnout | |||||
Party | Candidate | Votes | % | ± | |
---|---|---|---|---|---|
Conservative | Matthew Barber | 1,272 | |||
Conservative | Alison Thomson | 1,244 | |||
Conservative | Roger Cox | 1,154 | |||
Labour | Alan Victor | 462 | |||
Labour | Stephen Leniec | 459 | |||
Liberal Democrat | Alan Bennett | 313 | |||
Liberal Democrat | Patrick O'Leary | 262 | |||
Majority | |||||
Turnout | |||||
Party | Candidate | Votes | % | ± | |
---|---|---|---|---|---|
Liberal Democrat | Andrew Crawford | 562 | |||
Conservative | Valerie Clure | 332 | |||
Labour | Micheal Juer | 57 | |||
Majority | |||||
Turnout | |||||
Party | Candidate | Votes | % | ± | |
---|---|---|---|---|---|
Liberal Democrat | Zoe Patrick | 1,127 | |||
Conservative | James McGee | 1,067 | |||
Liberal Democrat | Sue Marchant | 895 | |||
Conservative | Kate Precious | 859 | |||
Conservative | Jeremy Renwick | 819 | |||
Liberal Democrat | Ian weeden | 794 | |||
Labour | Richard Ackers | 294 | |||
Labour | Chris Davenport | 196 | |||
Labour | Zoe Parker | 186 | |||
Majority | |||||
Turnout | |||||
Party | Candidate | Votes | % | ± | |
---|---|---|---|---|---|
Conservative | Terence Cox | 578 | |||
Liberal Democrat | Robert Graham | 133 | |||
Labour | John Mathews | 59 | |||
Majority | |||||
Turnout | |||||
Party | Candidate | Votes | % | ± | |
---|---|---|---|---|---|
Conservative | Margaret Turner | 948 | 36.3 | ||
Conservative | Reg Waite | 872 | 33.4 | ||
Green | Nicolas Freestone | 226 | 8.7 | ||
Liberal Democrat | Jean Kent | 201 | 7.7 | ||
Labour | Frank Treml | 181 | 6.9 | ||
Liberal Democrat | Peter Kent | 181 | 6.9 | ||
Majority | |||||
Turnout | |||||
Party | Candidate | Votes | % | ± | |
---|---|---|---|---|---|
Conservative | Micheal Murray | 625 | |||
Liberal Democrat | Terry Fraser | 607 | |||
Liberal Democrat | Mike Green | 530 | |||
Conservative | Harry Richardson | 515 | |||
Majority | |||||
Turnout | |||||
Party | Candidate | Votes | % | ± | |
---|---|---|---|---|---|
Liberal Democrat | Jerry Patterson | 815 | |||
Conservative | Gareth Jennings | 780 | |||
Conservative | Arash Fatemian | 765 | |||
Liberal Democrat | Bernard Auton | 752 | |||
Majority | |||||
Turnout | |||||
Party | Candidate | Votes | % | ± | |
---|---|---|---|---|---|
Conservative | Melinda Tilley | 463 | |||
Labour | Ann Tompson | 119 | |||
Liberal Democrat | Lindy Farrell | 90 | |||
Majority | |||||
Turnout | |||||
Party | Candidate | Votes | % | ± | |
---|---|---|---|---|---|
Conservative | Anthony Hayward | 593 | |||
Liberal Democrat | Edward Last | 216 | |||
Majority | |||||
Turnout | |||||
Party | Candidate | Votes | % | ± | |
---|---|---|---|---|---|
Liberal Democrat | Jane Hanna | 550 | |||
Conservative | Leslie Mitchell | 386 | |||
Majority | |||||
Turnout | |||||
Party | Candidate | Votes | % | ± | |
---|---|---|---|---|---|
Liberal Democrat | Jenny Shepard | 879 | |||
Liberal Democrat | David Quinlan | 862 | |||
Conservative | Eric Batts | 538 | |||
Conservative | Basil England | 470 | |||
Green | Robert Cowley | 284 | |||
Majority | |||||
Turnout | |||||
Party | Candidate | Votes | % | ± | |
---|---|---|---|---|---|
Liberal Democrat | Robin Johnston | 534 | |||
Conservative | Denis Standen | 301 | |||
Green | Christopher Henderson | 76 | |||
Majority | |||||
Turnout | |||||
Party | Candidate | Votes | % | ± | |
---|---|---|---|---|---|
Conservative | Elaine Ware | 914 | |||
Conservative | Peter Saunders | 873 | |||
Liberal Democrat | Frank Mullin | 489 | |||
Liberal Democrat | Bjorn Watson | 442 | |||
Majority | |||||
Turnout | |||||
Party | Candidate | Votes | % | ± | |
---|---|---|---|---|---|
Conservative | Robert Sharp | 397 | |||
Labour | Peter Gill | 264 | |||
Liberal Democrat | Brian Sadler | 70 | |||
Majority | |||||
Turnout | |||||
Party | Candidate | Votes | % | ± | |
---|---|---|---|---|---|
Liberal Democrat | Chris Wise | 887 | |||
Liberal Democrat | Val Shaw | 846 | |||
Conservative | Julian Wheatland | 487 | |||
Conservative | Stephen Pritchard | 376 | |||
Majority | |||||
Turnout | |||||
Party | Candidate | Votes | % | ± | |
---|---|---|---|---|---|
Conservative | Gervase Duffield | 418 | |||
Liberal Democrat | Simon Thompson | 172 | |||
Green | David Sherwood | 90 | |||
Majority | |||||
Turnout | |||||
Party | Candidate | Votes | % | ± | |
---|---|---|---|---|---|
Liberal Democrat | Jim Moley | 1,089 | |||
Liberal Democrat | Julia Reynolds | 1,018 | |||
Conservative | Edwin Goldsmith | 961 | |||
Conservative | Eddy Goldsmith | 892 | |||
Conservative | John Morgan | 873 | |||
Liberal Democrat | Lorraine Todd | 831 | |||
Labour | Steve Quinton | 273 | |||
Labour | Ed Mitchell | 225 | |||
Labour | Julie Davenport | 220 | |||
Majority | |||||
Turnout | |||||
Party | Candidate | Votes | % | ± | |
---|---|---|---|---|---|
Liberal Democrat | Jennifer Hannaby | 553 | |||
Liberal Democrat | Joyce Hutchinson | 474 | |||
Conservative | John Amys | 426 | |||
Conservative | Ben Griffin | 394 | |||
Labour | Stuart Taylor | 227 | |||
Labour | Jean Nunn-Price | 216 | |||
Majority | |||||
Turnout | |||||
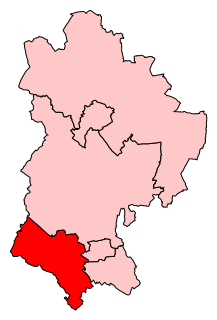
South West Bedfordshire is a constituency represented in the House of Commons of the UK Parliament. As with all constituencies of the UK Parliament, it elects one Member of Parliament by the first past the post system of election.
As a result of the Fifth Periodical Review of the Boundary Commission for Scotland, Scotland is covered by 59 constituencies of the House of Commons of the United Kingdom Parliament - 19 Burgh constituencies and 40 County constituencies. Constituencies marked * appear on the Central Area Enlargement.
Guildford Council in Surrey, England is elected every four years.
The Waverley Borough Council of Waverley, Surrey, is elected every four years.
Hertfordshire County Council in England is elected every four years. Since the last boundary changes, that took effect for the 2001 election, 77 councillors are elected for single member districts.
Elections to the City of Edinburgh Council were held on 3 May 2007 the same day as the Scottish Parliament general election. The election was the first one using 17 new wards created as a results of the Local Governance (Scotland) Act 2004, each ward will elect three or four councillors using the single transferable vote system a form of proportional representation. The new wards replace 58 single-member wards which used the plurality system of election.
Elections to the Highland Council were held on 3 May 2007; the same day as elections to the Scottish Parliament and to the 31 other councils in Scotland. Previous elections to the Council had been conducted using the single member plurality system. Changes implemented by the Local Governance (Scotland) Act 2004 meant that future local government elections were to be conducted using the Single Transferable Vote, beginning with those in 2007. The 80 Highland Councillors were now to be elected from 22 wards, returning either three or four members.
The 2007 council elections in Guildford saw the Conservatives retain control over Guildford Borough Council. Full results for each ward can be found at Guildford Council election, full results, 2007.
Elections for Oxford City Council were held on Thursday 6 May 2010. As Oxford City Council is elected by halves, one seat in each of the 24 wards was up for election.
Elections for Redbridge London Borough Council were held on 6 May 2010. The 2010 General Election and other local elections took place on the same day.
The first election to Herefordshire Council occurred on 4 May 2000, following the council's reconstitution as a unitary authority in 1998; following Herefordshire's separation from the short lived administrative county of Hereford and Worcester formed by a merger of Herefordshire and Worcestershire in 1974. All 37 wards were contested - each electing either one or two members to the council.
Elections to Test Valley Borough Council were held on 5 May 2011, the same day as the United Kingdom Alternative Vote referendum, 2011. The Conservatives maintained control of the council, with an increased majority.
The 2011 council elections in Guildford saw the Conservatives retain control over Guildford Borough Council with an increased majority of 20 seats. Full results for each ward can be found at Guildford Council election, full results, 2011.
The 2003 elections for Guildford Borough Council were the first, and as of 2011 the only, full election for Guildford Borough Council conducted by an all postal ballot. The result saw the Conservatives win a majority of seats on Guildford Borough Council for the first time since losing their majority in the 1991 election.
The elections for Oxford City Council took place on Thursday 22 May 2014. As Oxford City Council is elected by halves, one seat in each of the 24 wards is up for election, apart from in Summertown ward where both seats are up for election following the resignation of Councillor Stuart McCready on 3 April 2014.
The 2017 Cornwall Council election was held on 4 May 2017 as part of the 2017 local elections in the United Kingdom. 122 councillors were elected from the 121 electoral divisions of Cornwall Council, which returned either one or two councillors each by first-past-the-post voting for a four-year term of office. Although originally scheduled to take place on the same day, the election in the Bodmin St Petroc ward was countermanded following the death of Liberal Democrat candidate Steve Rogerson and was held on 8 June.
An election to Ceredigion County Council were held on 4 May 2017 as part of wider local elections across Wales. It was preceded by the 2012 election and the next election is scheduled to take place in 2022.
Elections to Scottish Borders Council were held on 4 May 2017, the same day as the other Scottish local government elections. The election used the 11 wards created as a result of the Local Governance (Scotland) Act 2004, with each ward electing three or four Councillors using the single transferable vote system, a form of proportional representation, with 34 councillors elected.
The 2017 Highland Council election was held on 4 May 2017 to elect members of Highland Council. The election used the 21 wards created under the Local Governance (Scotland) Act 2004; each ward elected three or four councillors using the single transferable vote system. A total of 74 councillors were elected, six less than in 2012.
Elections to Mid Bedfordshire District Council were held in May 2007. These were the last elections to council, with all 53 seats being up for election. Councillors elected would serve a two-year term, expiring in 2009, when Mid Bedfordshire District Council was replaced by Central Bedfordshire Council. The Conservative Party retained overall control of the council, winning 37 of 53 seats on the council. The Conservatives won 8 seats unopposed, as did an Independent candidate in one ward.