Walsall (UK Parliament constituency)

Last updated

Walsall
Former Borough constituency
for the House of Commons
18321955
Seatsone
Created from Walsall North and Walsall South

Walsall was a borough constituency centred on the town of Walsall in the West Midlands of England. It returned one Member of Parliament (MP) to the House of Commons of the Parliament of the United Kingdom, elected by the first past the post voting system.

Contents

Boundaries

Throughout its existence, the seat included the entirety of the County Borough of Walsall. In 1955, it was split into Walsall North and Walsall South [1]

Members of Parliament

ElectionMemberParty
1832 Charles Smith Forster Tory [2]
1834 Conservative [2]
1837 Francis Finch Radical [2] [3]
February 1841 John Neilson Gladstone Conservative [2]
June 1841 Robert Scott Whig [2] [4]
1847 Edward Littleton Whig [5] [6] [7]
1852 Sir Charles Forster Radical [8] [9] [5] [7]
1859 Liberal
1891 by-election Edward Thomas Holden Liberal
1892 Frank James Conservative
1893 by-election Sir Arthur Hayter Liberal
1895 Sydney Gedge Conservative
1900 Sir Arthur Hayter Liberal
1906 Edward Marten Dunne Liberal
January 1910 Sir Richard Cooper Conservative
1918 National
1922 Pat Collins Liberal
1924 William Preston Conservative
1925 by-election
1929 John James McShane Labour
1931 Joseph Leckie Liberal
1935 Liberal National
1938 by-election Sir George Schuster Liberal National
1945 William Wells Labour
1955 constituency abolished: see Walsall North and Walsall South

Elections

Elections in the 1830s

General election 1832: Walsall [10] [2]
PartyCandidateVotes%
Tory Charles Smith Forster 304 56.8
Radical George de Bosco Attwood23143.2
Majority7313.6
Turnout 53589.6
Registered electors 597
Tory win (new seat)
General election 1835: Walsall [10] [2]
PartyCandidateVotes%
Conservative Charles Smith Forster Unopposed
Registered electors 578
Conservative hold
General election 1837: Walsall [10] [2]
PartyCandidateVotes%
Radical Francis Finch 316 51.6
Conservative Charles Smith Forster 29648.4
Majority203.2
Turnout 61282.0
Registered electors 746
Radical gain from Conservative

Elections in the 1840s

Finch resigned by accepting the office of Steward of the Chiltern Hundreds, causing a by-election.

By-election, 2 February 1841: Walsall [10] [2]
PartyCandidateVotes%±%
Conservative John Neilson Gladstone 362 51.9 +3.5
Radical John Benjamin Smith 33548.13.5
Majority273.8N/A
Turnout 69786.3+4.3
Registered electors 808
Conservative gain from Radical Swing +3.5
General election 1841: Walsall [10] [2]
PartyCandidateVotes%±%
Whig Robert Wellbeloved Scott 334 51.7 New
Conservative John Neilson Gladstone 31248.30.1
Majority223.4N/A
Turnout 64680.02.0
Registered electors 808
Whig gain from Radical Swing N/A
General election 1847: Walsall [10]
PartyCandidateVotes%±%
Whig Edward Littleton 289 41.6 10.1
Radical Charles Forster 28240.6New
Conservative William Henry Cooke [11] 12417.830.5
Majority71.02.4
Turnout 69581.2+1.2
Registered electors 856
Whig hold Swing +2.6

Elections in the 1850s

General election 1852: Walsall [10]
PartyCandidateVotes%±%
Radical Charles Forster Unopposed
Registered electors 1,026
Radical gain from Whig
General election 1857: Walsall [10]
PartyCandidateVotes%±%
Radical Charles Forster Unopposed
Registered electors 1,188
Radical hold
General election 1859: Walsall [10]
PartyCandidateVotes%±%
Liberal Charles Forster 495 56.4 New
Conservative Charles Bagnall [12] 38343.6New
Majority11212.8N/A
Turnout 87880.4N/A
Registered electors 1,092
Liberal hold Swing

Elections in the 1860s

General election 1865: Walsall [10]
PartyCandidateVotes%±%
Liberal Charles Forster Unopposed
Registered electors 1,296
Liberal hold
General election 1868: Walsall [10]
PartyCandidateVotes%±%
Liberal Charles Forster Unopposed
Registered electors 6,047
Liberal hold

Elections in the 1870s

General election 1874: Walsall [10]
PartyCandidateVotes%±%
Liberal Charles Forster 3,364 66.0 N/A
Conservative William Morrison Bell [13] 1,73134.0New
Majority1,63332.0N/A
Turnout 5,09558.7N/A
Registered electors 8,684
Liberal hold

Elections in the 1880s

General election 1880: Walsall [10]
PartyCandidateVotes%±%
Liberal Charles Forster Unopposed
Registered electors 9,537
Liberal hold
General election 1885: Walsall [14]
PartyCandidateVotes%±%
Liberal Charles Forster 5,112 59.8 N/A
Conservative Frank James 3,43540.2New
Majority1,67719.6N/A
Turnout 8,54779.6N/A
Registered electors 10,742
Liberal hold Swing N/A
General election 1886: Walsall [14]
PartyCandidateVotes%±%
Liberal Charles Forster Unopposed
Liberal hold

Elections in the 1890s

Forster's death caused a by-election.

By-election, 12 Aug 1891: Walsall [14]
PartyCandidateVotes%±%
Liberal Edward Holden 4,899 52.9 N/A
Conservative Frank James 4,36047.1New
Majority5395.8N/A
Turnout 9,25979.1N/A
Registered electors 11,712
Liberal hold Swing N/A
General election 1892: Walsall [14]
PartyCandidateVotes%±%
Conservative Frank James 5,226 51.2 N/A
Liberal Edward Holden 4,98948.8N/A
Majority2372.4N/A
Turnout 10,21585.7N/A
Registered electors 11,915
Conservative gain from Liberal Swing N/A

The election was declared void on petition.

Charles Ritchie Charles Thomson Ritchie headshot.jpg
Charles Ritchie
By-election, 9 Feb 1893: Walsall [14]
PartyCandidateVotes%±%
Liberal Arthur Hayter 5,235 50.4 +1.6
Conservative Charles Ritchie 5,15649.61.6
Majority790.8N/A
Turnout 10,39187.8+2.1
Registered electors 11,838
Liberal gain from Conservative Swing +1.6
Sydney Gedge Sydney Gedge.jpg
Sydney Gedge
General election 1895: Walsall [14]
PartyCandidateVotes%±%
Conservative Sydney Gedge 5,145 51.6 +0.4
Liberal Arthur Hayter 4,82848.40.4
Majority3173.2+0.8
Turnout 9,97390.5+4.8
Registered electors 11,015
Conservative hold Swing +0.4

Elections in the 1900s

Arthur Hayter Arthur Hayter, 1st Baron Haversham.jpg
Arthur Hayter
General election 1900: Walsall [14]
PartyCandidateVotes%±%
Liberal Arthur Hayter 5,610 51.5 +3.1
Conservative Sydney Gedge 5,28548.53.1
Majority3253.0N/A
Turnout 10,89584.85.7
Registered electors 12,851
Liberal gain from Conservative Swing +3.1
General election 1906: Walsall [14]
PartyCandidateVotes%±%
Liberal Edward Dunne 7,092 54.6 +3.1
Conservative Bernall Bagshawe5,89345.4-3.1
Majority1,1999.2+6.2
Turnout 12,98591.9+7.1
Registered electors 14,127
Liberal hold Swing +3.1

Elections in the 1910s

General election January 1910: Walsall [14]
PartyCandidateVotes%±%
Conservative Richard Cooper 7,290 51.9 +6.5
Liberal Edward Dunne 6,74548.16.5
Majority5453.8N/A
Turnout 14,03595.4+3.5
Registered electors 14,713
Conservative gain from Liberal Swing +6.5
General election December 1910: Walsall [14]
PartyCandidateVotes%±%
Conservative Richard Cooper 7,174 52.9 +1.0
Liberal John Morgan6,38547.1-1.0
Majority7895.8+2.0
Turnout 13,55992.2-3.2
Registered electors 14,713
Conservative hold Swing +1.0

General Election 1914–15: Another General Election was required to take place before the end of 1915. The political parties had been making preparations for an election to take place and by the July 1914, the following candidates had been selected;

W.H. Brown William Henry Brown.jpg
W.H. Brown
General election 1918: Walsall [16]
PartyCandidateVotes%±%
National Richard Cooper 14,491 52.3 0.6
Labour Joseph Thickett 8,33630.0New
Liberal William Henry Brown4,91417.729.4
Majority6,15522.3N/A
Turnout 27,74164.727.5
National gain from Unionist Swing N/A

Elections in the 1920s

Pat Collins 1921 Pat Collins.jpg
Pat Collins
General election 1922: Walsall [17]
PartyCandidateVotes%±%
Liberal Pat Collins 14,674 38.6 +20.9
Unionist Alice Cooper14,34937.8-14.5
Labour Robert Dennison 8,94623.6-6.4
Majority3250.8N/A
Turnout 37,969
Liberal gain from National Swing +17.7
General election 6 December 1923: Walsall [17]
PartyCandidateVotes%±%
Liberal Pat Collins 16,304 43.5 +4.9
Unionist Sydney Kersland Lewis14,14137.8-0.0
Labour Arthur Carr Osburn7,00718.7-4.9
Majority2,1635.7+4.9
Turnout 37,45282.6
Liberal hold Swing -2.4
General election 1924: Walsall [17]
PartyCandidateVotes%±%
Unionist William Preston 15,168 37.9 +0.1
Liberal Pat Collins 12,73431.8-11.7
Labour Lothian Small 11,47428.7+10.0
Independent J J Lynch6221.6New
Majority2,4346.1N/A
Turnout 39,998
Unionist gain from Liberal Swing
1925 Walsall by-election [17]
PartyCandidateVotes%±%
Unionist William Preston 14,793 38.2 +0.3
Liberal Thomas Macnamara 12,30031.8+0.0
Labour Lothian Small 11,61030.0+1.3
Majority2,4936.4+0.3
Turnout 38,70383.4
Unionist hold Swing +0.1
General election 1929: Walsall [17]
PartyCandidateVotes%±%
Labour John McShane 20,524 39.6 +9.6
Unionist William Preston 15,81830.6-7.6
Liberal Thomas Macnamara 15,42529.8-2.0
Majority4,7069.0N/A
Turnout 51,76785.9+2.9
Labour gain from Unionist Swing +8.6

Elections in the 1930s

General election 1931: Walsall [16]
PartyCandidateVotes%±%
Liberal Joseph Leckie 30,507 56.0 +26.2
Labour John McShane 23,95244.0+4.4
Majority6,55512.0N/A
Turnout 54,45986.3+0.4
Liberal gain from Labour Swing +10.9
General election 1935: Walsall [16]
PartyCandidateVotes%±%
National Liberal Joseph Leckie 28,563 57.5 +1.5
Labour William Graham19,59439.5-4.5
Christian SocialistJ A Harper1,4803.0New
Majority8,95918.0+6.0
Turnout 49,63775.3-11.0
National Liberal hold Swing +3.0
1938 Walsall by-election [16]
PartyCandidateVotes%±%
National Liberal George Schuster 28,720 57.1 -0.4
Labour George Jeger 21,56242.9+0.4
Majority7,15814.2-0.8
Turnout 50,28275.9+0.6
National Liberal hold Swing -0.4

Elections in the 1940s

General Election 1939–40:

Another General Election was required to take place before the end of 1940. The political parties had been making preparations for an election and by the end of the Autumn of 1939, the following candidates had been selected;

General election 1945: Walsall [16]
PartyCandidateVotes%±%
Labour William Wells 28,324 53.9 +14.4
National Liberal George Schuster 24,19746.1-11.4
Majority4,1277.8N/A
Turnout 52,52176.2+0.9
Labour gain from National Liberal Swing

Elections in the 1950s

General election 1950: Walsall [19] [20]
PartyCandidateVotes%±%
Labour William Wells 36,483 56.0 +2.1
National Liberal John Barlow 28,70044.0-2.1
Majority7,78312.0+4.2
Turnout 65,18386.2+10.0
Labour hold Swing
General election 1951: Walsall [19]
PartyCandidateVotes%±%
Labour William Wells 33,556 52.3 -3.7
Conservative Frank Roper23,08336.0-8.0
Liberal Barbara Lewis 7,51711.7New
Majority10,47316.3+4.3
Turnout 64,15683.1-3.1
Labour hold Swing

Related Research Articles

<span class="mw-page-title-main">Bury St Edmunds (UK Parliament constituency)</span> Parliamentary constituency in the United Kingdom since 1801

Bury St Edmunds is a constituency represented in the House of Commons of the UK Parliament since 2015 by Jo Churchill, a Conservative.

<span class="mw-page-title-main">Blackburn (UK Parliament constituency)</span> Parliamentary constituency in the United Kingdom, 1955 onwards

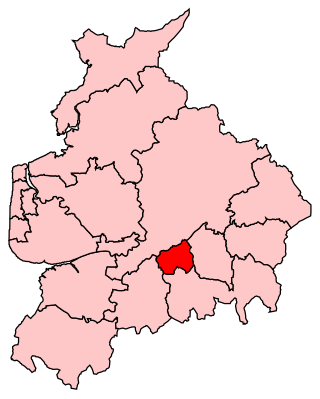
Blackburn is a constituency in Lancashire, England, which has been represented in the House of Commons of the UK Parliament since 2015 by Kate Hollern of the Labour Party. From 1979 to 2015, it was represented by Jack Straw who served under the Labour leaders of Neil Kinnock and John Smith and the Labour governments of Tony Blair and Gordon Brown.

<span class="mw-page-title-main">Lincoln (UK Parliament constituency)</span> Parliamentary constituency in the United Kingdom, 1885 onwards

Lincoln is a constituency in Lincolnshire, England represented in the House of Commons of the UK Parliament since 2019 by Karl McCartney, a Conservative Party politician.

<span class="mw-page-title-main">Lichfield (UK Parliament constituency)</span> Parliamentary constituency in the United Kingdom, 1997 onwards

Lichfield is a constituency in Staffordshire represented in the House of Commons of the UK Parliament since its 1997 recreation by Michael Fabricant, a Conservative.

<span class="mw-page-title-main">Ludlow (UK Parliament constituency)</span> Parliamentary constituency in the UK

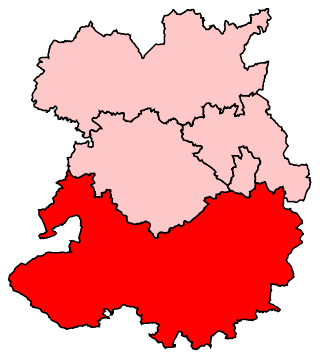
Ludlow is a constituency in Shropshire represented in the House of Commons of the UK Parliament since 2005 by Philip Dunne, a member of the Conservative Party.

Greenock was a burgh constituency represented in the House of Commons of the Parliament of the United Kingdom from 1832 until 1974, when it was abolished and its area was merged into the new Greenock and Port Glasgow constituency.

<span class="mw-page-title-main">Lancaster (UK Parliament constituency)</span> Parliamentary constituency in the United Kingdom, 1885–1997

Lancaster was a constituency of the House of Commons of the Parliament of England then of the Parliament of Great Britain from 1707 to 1800 and of the Parliament of the United Kingdom from 1801 to 1867, centred on the historic city of Lancaster in north-west England. It was represented by two Members of Parliament until the constituency was disenfranchised for corruption in 1867.

Grantham was a Parliamentary constituency in Lincolnshire, England.

Sunderland was a borough constituency of the House of Commons, created by the Reform Act 1832 for the 1832 general election. It elected two Members of Parliament (MPs) by the bloc vote system of election. It was split into the single-member seats of Sunderland North and Sunderland South for the 1950 general election.

<span class="mw-page-title-main">Warrington (UK Parliament constituency)</span> Parliamentary constituency in the United Kingdom, 1832–1983

Warrington was a parliamentary constituency in the United Kingdom. From 1832 to 1983 it returned one Member of Parliament (MP) to the House of Commons of the Parliament of the United Kingdom.

Shrewsbury was a parliamentary constituency in England, centred on the town of Shrewsbury in Shropshire.

<span class="mw-page-title-main">Isle of Thanet (UK Parliament constituency)</span>

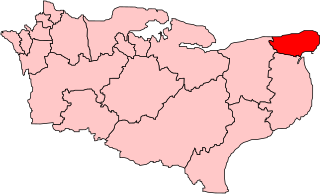
Isle of Thanet was a county constituency which returned one Member of Parliament (MP) to the House of Commons of the Parliament of the United Kingdom from 1885, until it was abolished for the February 1974 general election.

Flintshire was a parliamentary constituency in North-East Wales which generally returned one Member of Parliament (MP) to the House of Commons, latterly that of the Parliament of the United Kingdom, from 1542 until it was abolished for the 1950 general election.

Hythe was a constituency centred on the town of Hythe in Kent. It returned two Members of Parliament to the House of Commons until 1832, when its representation was reduced to one member. The constituency was abolished for the 1950 general election, and replaced with the new Folkestone and Hythe constituency.

The Hartlepools was a borough constituency represented in the House of Commons of the UK Parliament. The constituency became Hartlepool in 1974. The seat's name reflected the representation of both old Hartlepool and West Hartlepool.

Rochester was a parliamentary constituency in Kent. It returned two members of parliament (MPs) to the House of Commons of England from 1295 to 1707, then to the House of Commons of Great Britain from 1708 to 1800, and finally to the House of Commons of the Parliament of the United Kingdom from 1801 until the 1885 general election, when its representation was reduced to one seat.

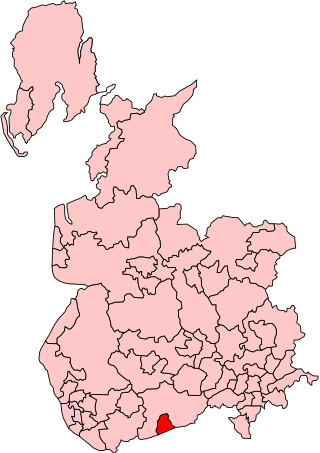
Bury was a borough constituency centred on the town of Bury in Lancashire. It returned one Member of Parliament (MP) to the House of Commons of the Parliament of the United Kingdom.

Oldham was a parliamentary constituency centred on the town of Oldham, England. It returned two Members of Parliament (MPs) to the House of Commons of the Parliament of the United Kingdom. The constituency was created by the Great Reform Act of 1832 and was abolished for the 1950 general election when it was split into the Oldham East and Oldham West constituencies.

<span class="mw-page-title-main">East Norfolk (UK Parliament constituency)</span> Parliamentary constituency in the United Kingdom 1832-1868 & 1885-1950

East Norfolk was a constituency in the county of Norfolk that returned two members of parliament to the House of Commons of the Parliament of the United Kingdom from 1832 until 1868. It was re-established in 1885 with representation of one member. That seat was abolished in 1950.

East Worcestershire was a county constituency in the county of Worcestershire, represented in the House of Commons of the Parliament of the United Kingdom.

References

  1. Craig, F.W.S., ed. (1972). Boundaries of parliamentary constituencies 1985-1972. Chichester, Sussex: Political Reference Publications. ISBN   0-900178-09-4.
  2. 1 2 3 4 5 6 7 8 9 10 Stooks Smith, Henry (1845). The Parliaments of England, from 1st George I., to the Present Time. Vol II: Oxfordshire to Wales Inclusive. London: Simpkin, Marshall, & Co. p. 50. Retrieved 12 December 2018 via Google Books.
  3. "State of Polls, & Members Returned" . Worcester Journal. 27 July 1837. p. 3. Retrieved 21 December 2018 via British Newspaper Archive.
  4. "Members Returned" . Norfolk Chronicle. 3 July 1841. p. 2. Retrieved 21 December 2018 via British Newspaper Archive.
  5. 1 2 "The General Election" . Morning Post. 29 July 1847. pp. 2–4. Retrieved 15 July 2018 via British Newspaper Archive.
  6. Miller, Henry (2015). Politics Personified: Portraiture, Caricature and Visual Culture in Britain, c. 1830-80. Manchester: Manchester University Press. p. 145. ISBN   978-0-7190-9084-4 . Retrieved 15 July 2018 via Google Books.
  7. 1 2 "Walsall" . Globe. 29 July 1847. pp. 1–2. Retrieved 15 July 2018 via British Newspaper Archive.
  8. "The Elections and their Results" . Manchester Times. 10 July 1852. pp. 6–7. Retrieved 15 July 2018 via British Newspaper Archive.
  9. "The Elections" . Morning Post. 30 July 1847. p. 4. Retrieved 15 July 2018 via British Newspaper Archive.
  10. 1 2 3 4 5 6 7 8 9 10 11 12 13 Craig, F. W. S., ed. (1977). British Parliamentary Election Results 1832-1885 (e-book) (1st ed.). London: Macmillan Press. p. 317. ISBN   978-1-349-02349-3.
  11. "The Elections" . Hereford Journal. 21 July 1847. p. 2. Retrieved 22 December 2018 via British Newspaper Archive.
  12. "Walsall Election" . Walsall Free Press and General Advertiser. 21 May 1859. p. 1. Retrieved 15 July 2018 via British Newspaper Archive.
  13. "The General Election" . The Morning Post . 31 January 1874. pp. 2–3. Retrieved 22 January 2018 via British Newspaper Archive.
  14. 1 2 3 4 5 6 7 8 9 10 Craig, F. W. S., ed. (1974). British Parliamentary Election Results: 1885-1918. London: Macmillan Press. p. 201. ISBN   9781349022984.
  15. Black Country History
  16. 1 2 3 4 5 British parliamentary election results 1918-1949 by FWS Craig
  17. 1 2 3 4 5 British Parliamentary Election Results 1918-1949, FWS Craig
  18. Report of the Annual Conference, 1939
  19. 1 2 British parliamentary election results 1950-1973 by FWS Craig
  20. The Times' Guide to the House of Commons. 1950.

Sources