The 2002 Walsall Metropolitan Borough Council election took place on 2 May 2002 to elect members of Walsall Metropolitan Borough Council in the West Midlands, England. One third of the council was up for election and the council stayed under no overall control. [1]
The Metropolitan Borough of Walsall is a local government district in the West Midlands, England, with the status of a metropolitan borough. It is named after its largest settlement, Walsall, but covers a larger area which also includes the towns of Aldridge, Bloxwich, Brownhills, Darlaston and Willenhall. The borough had an estimated population of 254,500 in 2007.
The West Midlands is a metropolitan county in western-central England with a 2014 estimated population of 2,808,356, making it the second most populous county in England after Greater London. It came into existence as a metropolitan county in 1974 after the passage of the Local Government Act 1972, formed from parts of Staffordshire, Worcestershire and Warwickshire. The county itself is a NUTS 2 region within the wider NUTS 1 region of the same name. The county consists of seven metropolitan boroughs: the City of Birmingham, the City of Coventry and the City of Wolverhampton, as well as the boroughs of Dudley, Sandwell, Solihull and Walsall.
England is a country that is part of the United Kingdom. It shares land borders with Wales to the west and Scotland to the north-northwest. The Irish Sea lies west of England and the Celtic Sea lies to the southwest. England is separated from continental Europe by the North Sea to the east and the English Channel to the south. The country covers five-eighths of the island of Great Britain, which lies in the North Atlantic, and includes over 100 smaller islands, such as the Isles of Scilly and the Isle of Wight.
After the election, the composition of the council was
The Labour Party is a centre-left political party in the United Kingdom which has been described as an alliance of social democrats, democratic socialists and trade unionists. The party's platform emphasises greater state intervention, social justice and strengthening workers' rights.
The Conservative Party, officially the Conservative and Unionist Party, is a centre-right political party in the United Kingdom. The governing party since 2010, it is the largest in the House of Commons, with 313 Members of Parliament, and also has 249 members of the House of Lords, 18 members of the European Parliament, 31 Members of the Scottish Parliament, 12 members of the Welsh Assembly, eight members of the London Assembly and 8,916 local councillors.
The Liberal Democrats are a liberal political party in the United Kingdom. They have 11 Members of Parliament in the House of Commons, 96 members of the House of Lords, one member of the European Parliament, five Members of the Scottish Parliament and one member in the Welsh Assembly and London Assembly. At the height of its influence, the party formed a coalition government with the Conservative Party from 2010 to 2015 with its leader Nick Clegg serving as Deputy Prime Minister. It is currently led by Sir Vince Cable.
Before the election the council was run by a coalition between the Conservative and Liberal Democrat parties, after Labour had run the council from 1995 to 2000. [2] The candidates at the election were 20 each from the Labour and Conservative parties, 10 Liberal Democrats, 7 independents, 4 UK Independence Party and 3 Green Party. [2]
The UK Independence Party is a hard Eurosceptic, right-wing political party in the United Kingdom. It currently has one representative in the House of Lords and three Members of the European Parliament (MEPs). It has three Assembly Members (AMs) in the National Assembly for Wales and one member in the London Assembly. The party reached its greatest level of success in the mid-2010s, when it gained two Members of Parliament and was the largest UK party in the European Parliament.
The Green Party of England and Wales is a green, left-wing political party in England and Wales. Headquartered in London, since September 2018, its co-leaders are Siân Berry and Jonathan Bartley. The Green Party has one representative in the House of Commons, one in the House of Lords, and three in the European Parliament. In addition, it has various councillors in UK local government and two members of the London Assembly.
A significant issue at the election was a report from the Audit Commission in January 2002, which had made many criticisms of the council, with the council having almost been taken over by the national government 2 months before the election. [2]
The Audit Commission was a statutory corporation in the United Kingdom. The Commission’s primary objective was to appoint auditors to a range of local public bodies in England, set the standards for auditors and oversee their work. The Commission closed on 31 March 2015, with its functions being transferred to the voluntary, not-for-profit or private sector.
Party | Seats | Gains | Losses | Net gain/loss | Seats % | Votes % | Votes | +/− | |
---|---|---|---|---|---|---|---|---|---|
Labour | 12 | +1 | 60.0 | 39.9 | 21,734 | ||||
Conservative | 6 | -1 | 30.0 | 41.2 | 22,439 | ||||
Liberal Democrat | 2 | 0 | 10.0 | 9.4 | 5,137 | ||||
Independent | 0 | 0 | 0 | 5.1 | 2,758 | ||||
Socialist Alliance | 0 | 0 | 0 | 2.0 | 1,086 | ||||
UKIP | 0 | 0 | 0 | 1.5 | 841 | ||||
Green | 0 | 0 | 0 | 0.8 | 460 | ||||
Party | Candidate | Votes | % | ± | |
---|---|---|---|---|---|
Conservative | John O'Hare | 2,020 | 58.0 | ||
Labour | Carol Rose | 649 | 18.6 | ||
Liberal Democrat | Josephine Levine | 474 | 13.6 | ||
Independent | David Boulton | 340 | 9.8 | ||
Majority | 1,371 | 39.4 | |||
Turnout | 3,483 | 35.6 | |||
Party | Candidate | Votes | % | ± | |
---|---|---|---|---|---|
Conservative | Keith Sears | 1,789 | 63.7 | ||
Labour | Violet Upton | 1,020 | 36.3 | ||
Majority | 769 | 27.4 | |||
Turnout | 2,809 | 27.8 | |||
Party | Candidate | Votes | % | ± | |
---|---|---|---|---|---|
Labour | Ayshea Johnson | 1,431 | 63.5 | ||
Conservative | Doris Silvester | 821 | 36.5 | ||
Majority | 610 | 27.1 | |||
Turnout | 2,252 | 23.3 | |||
Party | Candidate | Votes | % | ± | |
---|---|---|---|---|---|
Labour | Joan Barton | 1,417 | 61.8 | ||
Conservative | Mohammed Arshad | 763 | 33.3 | ||
Socialist Alliance | Azra Jabbar | 113 | 4.9 | ||
Majority | 654 | 28.5 | |||
Turnout | 2,293 | 24.0 | |||
Party | Candidate | Votes | % | ± | |
---|---|---|---|---|---|
Labour | Robert Robinson | 903 | 59.3 | ||
Conservative | Alan Venables | 303 | 19.9 | ||
Socialist Alliance | Peter Smith | 135 | 8.9 | ||
Independent | Michael Taylor | 106 | 7.0 | ||
Liberal Democrat | Wendy Evans | 77 | 5.1 | ||
Majority | 600 | 39.4 | |||
Turnout | 1,524 | 19.8 | |||
Party | Candidate | Votes | % | ± | |
---|---|---|---|---|---|
Labour | Kathleen Phillips | 1,169 | 48.3 | ||
Conservative | Anthony Harris | 840 | 34.7 | ||
Independent | Annette Taylor | 307 | 12.7 | ||
Liberal Democrat | Amina Walters | 103 | 4.3 | ||
Majority | 329 | 13.6 | |||
Turnout | 2,419 | 29.3 | |||
Party | Candidate | Votes | % | ± | |
---|---|---|---|---|---|
Labour | George Worley | 1,167 | 46.4 | ||
Conservative | Desmond Pitt | 975 | 38.8 | ||
Independent | Kerrie Pitt | 191 | 7.6 | ||
Liberal Democrat | Peter Hughes | 183 | 7.3 | ||
Majority | 192 | 7.6 | |||
Turnout | 2,516 | 27.7 | |||
Party | Candidate | Votes | % | ± | |
---|---|---|---|---|---|
Labour | John Bird | 1,253 | 53.3 | ||
Conservative | Robert Culbert | 1,097 | 46.7 | ||
Majority | 156 | 6.6 | |||
Turnout | 2,350 | 24.9 | |||
Party | Candidate | Votes | % | ± | |
---|---|---|---|---|---|
Labour | Graham Wilkes | 1,302 | 70.2 | ||
Conservative | Rose Martin | 553 | 29.8 | ||
Majority | 749 | 40.4 | |||
Turnout | 1,855 | 21.6 | |||
Party | Candidate | Votes | % | ± | |
---|---|---|---|---|---|
Conservative | Arthur Clarke | 1,545 | 51.6 | ||
Labour | Ann Wilson | 1,062 | 35.5 | ||
Green | Richard Clarke | 239 | 8.0 | ||
UKIP | Jenny Mayo | 147 | 4.9 | ||
Majority | 483 | 16.1 | |||
Turnout | 2,993 | 29.4 | |||
Party | Candidate | Votes | % | ± | |
---|---|---|---|---|---|
Conservative | Barry Sanders | 1,860 | 44.0 | ||
Independent | Cecil Wood | 896 | 21.2 | ||
Labour | Robert Matthews | 877 | 20.7 | ||
Liberal Democrat | Daniel Barker | 465 | 11.0 | ||
Green | Robert Walter | 133 | 3.1 | ||
Majority | 964 | 22.9 | |||
Turnout | 4,231 | 39.4 | |||
Party | Candidate | Votes | % | ± | |
---|---|---|---|---|---|
Labour | Waheed Saleem | 1,657 | 45.6 | ||
Conservative | Mohammed Arif | 1,191 | 32.8 | ||
Socialist Alliance | Cyril Leaker | 782 | 21.5 | ||
Majority | 466 | 12.8 | |||
Turnout | 3,630 | 37.2 | |||
Party | Candidate | Votes | % | ± | |
---|---|---|---|---|---|
Conservative | Garry Perry | 2,516 | 60.1 | ||
Liberal Democrat | Linda Dickens | 830 | 19.8 | ||
Labour | Paul Higgens | 736 | 17.6 | ||
UKIP | Anthony Lenton | 106 | 2.5 | ||
Majority | 1,686 | 40.3 | |||
Turnout | 4,188 | 36.8 | |||
Party | Candidate | Votes | % | ± | |
---|---|---|---|---|---|
Labour | Martin Harrower | 1,021 | 39.8 | ||
Conservative | Christopher Towe | 912 | 35.6 | ||
Independent | Edmund Newman | 632 | 24.6 | ||
Majority | 109 | 4.2 | |||
Turnout | 2,565 | 36.0 | |||
Party | Candidate | Votes | % | ± | |
---|---|---|---|---|---|
Labour | Norman Matthews | 1,356 | 61.4 | ||
Conservative | Mark Dabbs | 568 | 25.7 | ||
Independent | Peter Ruston | 286 | 12.9 | ||
Majority | 788 | 35.7 | |||
Turnout | 2,210 | 29.6 | |||
Party | Candidate | Votes | % | ± | |
---|---|---|---|---|---|
Liberal Democrat | Eileen Pitt | 1,158 | 53.4 | ||
Labour | Gareth Walker | 626 | 28.9 | ||
Conservative | Cerwyn Edwards | 383 | 17.7 | ||
Majority | 532 | 24.6 | |||
Turnout | 2,167 | 24.0 | |||
Party | Candidate | Votes | % | ± | |
---|---|---|---|---|---|
Labour | Richard Worrall | 1,484 | 49.1 | ||
Conservative | Wahid Ali | 1,054 | 34.9 | ||
Liberal Democrat | Martin Barker | 207 | 6.8 | ||
UKIP | Derek Bennett | 133 | 4.4 | ||
Green | Gerard Hawley | 88 | 2.9 | ||
Socialist Alliance | Stephanie Peart | 56 | 1.9 | ||
Majority | 430 | 14.2 | |||
Turnout | 3,022 | 37.0 | |||
Party | Candidate | Votes | % | ± | |
---|---|---|---|---|---|
Conservative | Michael Bird | 2,301 | 65.1 | ||
Labour | Thomas Charlton | 777 | 22.0 | ||
UKIP | Stephen Grey | 455 | 12.9 | ||
Majority | 1,524 | 43.1 | |||
Turnout | 3,533 | 32.9 | |||
Party | Candidate | Votes | % | ± | |
---|---|---|---|---|---|
Liberal Democrat | Arthur Bentley | 1,225 | 56.8 | ||
Labour | Carol Creaney | 589 | 27.3 | ||
Conservative | Susan Turner | 343 | 15.9 | ||
Majority | 636 | 29.5 | |||
Turnout | 2,157 | 22.8 | |||
Party | Candidate | Votes | % | ± | |
---|---|---|---|---|---|
Labour | Harold Withnall | 1,238 | 54.8 | ||
Conservative | Steven Turner | 605 | 26.8 | ||
Liberal Democrat | Anne Willoughby | 415 | 18.4 | ||
Majority | 633 | 28.0 | |||
Turnout | 2,258 | 23.0 | |||
The 1998 Walsall Metropolitan Borough Council election took place on 7 May 1998 to elect members of Walsall Metropolitan Borough Council in the West Midlands, England. One third of the council was up for election and the council stayed under no overall control.
The 2006 Camden Council election took place on 4 May 2006 to elect members of Camden London Borough Council in London, England. The whole council was up for election and the Labour Party lost overall control of the council to no overall control.
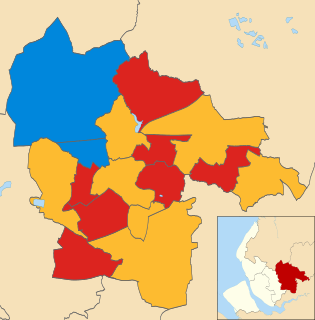
The 2007 St Helens Metropolitan Borough Council election took place on 3 May 2007 to elect members of St Helens Metropolitan Borough Council in Merseyside, England. One third of the council was up for election and the council stayed under no overall control.
The 2010 Walsall Metropolitan Borough Council election took place on 6 May 2010 to elect members of Walsall Metropolitan Borough Council in the West Midlands, England. One third of the council was up for election and the Conservative party stayed in overall control of the council.
The 2002 Solihull Metropolitan Borough Council election took place on 2 May 2002 to elect members of Solihull Metropolitan Borough Council in the West Midlands, England. One third of the council was up for election and the Conservative party stayed in overall control of the council.
The 2008 Sandwell Metropolitan Borough Council election took place on 1 May 2008 to elect members of Sandwell Metropolitan Borough Council in the West Midlands, England. One third of the council was up for election and the Labour party stayed in overall control of the council.
The 2008 Maidstone Borough Council election took place on 1 May 2008 to elect members of Maidstone Borough Council in Kent, England. One third of the council was up for election and the Conservative party gained overall control of the council from no overall control.
The 2002 Basingstoke and Deane Council election took place on 2 May 2002 to elect members of Basingstoke and Deane Borough Council in Hampshire, England. The whole council was up for election with boundary changes since the last election in 2000 increasing the number of seats by 3. The council stayed under no overall control.
The 2011 Sandwell Metropolitan Borough Council election took place on 5 May 2011 to elect members of Sandwell Metropolitan Borough Council in the West Midlands, England. One third of the council was up for election and the Labour party stayed in overall control of the council.
The 1999 Walsall Metropolitan Borough Council election took place on 6 May 1999 to elect members of Walsall Metropolitan Borough Council in the West Midlands, England. One third of the council was up for election and the Labour party gained overall control of the council from no overall control.
The 2000 Walsall Metropolitan Borough Council election took place on 4 May 2000 to elect members of Walsall Metropolitan Borough Council in the West Midlands, England. One third of the council was up for election and the Labour party lost overall control of the council to no overall control.
The 2003 Walsall Metropolitan Borough Council election took place on 1 May 2003 to elect members of Walsall Metropolitan Borough Council in the West Midlands, England. One third of the council was up for election and the council stayed under no overall control.
The 2004 Walsall Metropolitan Borough Council election took place on 10 June 2004 to elect members of Walsall Metropolitan Borough Council in the West Midlands, England. The whole council was up for election with boundary changes since the last election in 2003. The Conservative party gained overall control of the council from no overall control.
The 2006 Walsall Metropolitan Borough Council election took place on 4 May 2006 to elect members of Walsall Metropolitan Borough Council in the West Midlands, England. One third of the council was up for election and the Conservative party stayed in overall control of the council.
The 2007 Walsall Metropolitan Borough Council election took place on 3 May 2007 to elect members of Walsall Metropolitan Borough Council in the West Midlands, England. One third of the council was up for election and the Conservative party stayed in overall control of the council.
The 2008 Walsall Metropolitan Borough Council election took place on 1 May 2008 to elect members of Walsall Metropolitan Borough Council in the West Midlands, England. One third of the council was up for election and the Conservative party stayed in overall control of the council.
The 2011 Walsall Metropolitan Borough Council election took place on 5 May 2011 to elect members of Walsall Metropolitan Borough Council in the West Midlands, England. One third of the council was up for election and the Conservative party lost overall control of the council to no overall control.
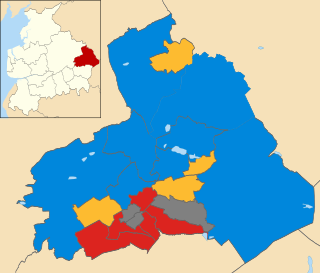
The 2011 Pendle Borough Council election took place on 5 May 2011 to elect members of Pendle Borough Council in Lancashire, England. One third of the council was up for election and the council stayed under no overall control.
The 2011 St Helens Metropolitan Borough Council election took place on 5 May 2011 to elect members of St Helens Metropolitan Borough Council in Merseyside, England. One third of the council was up for election and the Labour party stayed in overall control of the council.