The 2003 Wealden District Council election took place on 1 May 2003 to elect members of Wealden District Council in East Sussex, England. The whole council was up for election with boundary changes since the last election in 1999 reducing the number of seats by 3. [1] The Conservative party stayed in overall control of the council. [2]
Wealden is a local government district in East Sussex, England: its name comes from the Weald, the remnant forest which was once unbroken and occupies much of the centre and north of this area. The term is cognate with Wald, forest or wood in German.
Non-metropolitan districts, or colloquially "shire districts", are a type of local government district in England. As created, they are sub-divisions of non-metropolitan counties in a two-tier arrangement.
East Sussex is a county in South East England. It is bordered by the counties of Kent to the north and east, Surrey to the north west and West Sussex to the west, and to the south by the English Channel.
At the last election in 1999 the Conservatives won 34 seats, compared to 22 for the Liberal Democrats and 2 independents. [3] In November 2003 the Conservatives gained 2 seats from the Liberal Democrats in a by-election in Uckfield, [4] but the Liberal Democrats took one seat back in the same ward in a June 2002 by-election. [5]
The Liberal Democrats are a liberal political party in the United Kingdom. It is currently led by Vince Cable. They have 11 Members of Parliament in the House of Commons, 96 members of the House of Lords, one member of the European Parliament, five Members of the Scottish Parliament and one member in the Welsh Assembly and London Assembly. At the height of its influence, the party formed a coalition government with the Conservative Party from 2010 to 2015 with its leader Nick Clegg serving as Deputy Prime Minister.
The Liberal Democrats also lost seats after 2 Hailsham councillors, Nick and Madeline Ellwood, were expelled from the party, and a further 2, John Glover and Ian Haffenden, resigned from the party in protest. [6] The 4 councillors who resigned formed a Wealden Independents party, while the leader of the Liberal Democrat group on the council, Allan Thurley, stepped down over the expulsions and was succeeded by Eddie Rice. [7]
Hailsham is a civil parish and the largest of the five towns in the Wealden district of East Sussex, England. It is mentioned in the Domesday Book, where it is called Hamelesham. The town of Hailsham has a history of industry and agriculture.
A Councillor is a member of a local government council.
A total of 133 candidates stood for the 55 seats in 35 wards being contested, after boundary changes reduced the number of seats from 58. [3] [8] The changes increased the number of seats in Crowborough and Uckfield, while combining some of the rural seats. [3]
Crowborough is a town and civil parish in the Wealden district of East Sussex, England. It is situated in the Weald, at the edge of Ashdown Forest, in the High Weald Area of Outstanding National Beauty. It is 7 miles (11 km) south-west of Royal Tunbridge Wells and 35 miles (56 km) south of London. It has road and rail links and is served by a town council. It is the most populous inland town in East Sussex, with over 20,000 people.
In general, a rural area or countryside is a geographic area that is located outside towns and cities. The Health Resources and Services Administration of the U.S. Department of Health and Human Services defines the word rural as encompassing "...all population, housing, and territory not included within an urban area. Whatever is not urban is considered rural."
A major issue at the election was council tax after it increased by 18%, 5.1% of which was due to Wealden Council. [3] The Conservatives blamed the increase on the government providing a poor grant to the council, while the Liberal Democrats called for the council tax to be replaced by a local income tax. [3] Another issue was housing with the Conservatives called for more land to be released for low cost housing, but the Liberal Democrats attacked the number of houses to be built, saying the infrastructure needed to be improved first. [3] Both the Labour party and local independents also campaigned against the 1,300 houses to be built in Hailsham, with the independents saying more houses should be built in the north of the council area. [3]
An income tax is a tax imposed on individuals or entities (taxpayers) that varies with respective income or profits. Income tax generally is computed as the product of a tax rate times taxable income. Taxation rates may vary by type or characteristics of the taxpayer.
Affordable housing is housing which is deemed affordable to those with a median household income or below as rated by the national government or a local government by a recognized housing affordability index. Most of the literature on affordable housing refers to mortgages and number of forms that exist along a continuum – from emergency shelters, to transitional housing, to non-market rental, to formal and informal rental, indigenous housing, and ending with affordable home ownership.
The Labour Party is a centre-left political party in the United Kingdom that has been described as an alliance of social democrats, democratic socialists and trade unionists. The party's platform emphasises greater state intervention, social justice and strengthening workers' rights.
The Conservatives said they would tackle littering and continue the household recycling scheme, while the Liberal Democrats called for policing to be improved and for the council to be modernised. [3] Meanwhile, Labour aimed to win their first seat on the council in Uckfield and called for the council to abolish the reduction in council tax for second homes. [3] [9]
Recycling is the process of converting waste materials into new materials and objects. It is an alternative to "conventional" waste disposal that can save material and help lower greenhouse gas emissions. Recycling can prevent the waste of potentially useful materials and reduce the consumption of fresh raw materials, thereby reducing: energy usage, air pollution, and water pollution.
The Conservatives stayed in control of the council with 34 seats, while the Liberal Democrats took 15 seats and independents won 6. [10] Few seats changed parties, with the Conservatives keeping a 13-seat majority. [8] The changes that did happen included the Liberal Democrat group leader Eddie Rice losing his seat in Rotherfield and the Liberal Democrats were also defeated in Polegate South, where Ivy Scarborough, a Residents Association candidate was successful. [10] [11] Independents were also successful in Crowborough and Hailsham, while Labour failed to take any seats. [10] Overall turnout at the election was 35%, up from 33.5% in 1999. [12]
Party | Seats | Gains | Losses | Net gain/loss | Seats % | Votes % | Votes | +/− | |
---|---|---|---|---|---|---|---|---|---|
Conservative | 34 | -1 | 61.8 | 49.4 | 31,769 | ||||
Liberal Democrat | 15 | -2 | 27.3 | 35.0 | 22,515 | ||||
Independent | 6 | 0 | 10.9 | 9.5 | 6,142 | ||||
Labour | 0 | 0 | 0 | 3.9 | 2,534 | ||||
Green | 0 | 0 | 0 | 1.9 | 1,246 | ||||
UKIP | 0 | 0 | 0 | 0.2 | 137 |
3 Conservative candidates were unopposed at the election. [13]
Party | Candidate | Votes | % | ± | |
---|---|---|---|---|---|
Conservative | Keith Whitehead | 673 | 67.3 | ||
Liberal Democrat | Caroline Adcock | 327 | 32.7 | ||
Majority | 346 | 34.6 | |||
Turnout | 1,000 | 49.5 |
Party | Candidate | Votes | % | ± | |
---|---|---|---|---|---|
Conservative | Patricia Kennedy | 904 | |||
Conservative | Norman Buck | 862 | |||
Green | Peter Selby | 357 | |||
Independent | Ken Ogden | 314 | |||
Liberal Democrat | Graham Morgan | 293 | |||
Turnout | 2,730 | 36.2 |
Party | Candidate | Votes | % | ± | |
---|---|---|---|---|---|
Conservative | Sylvia Tidy | unopposed |
Party | Candidate | Votes | % | ± | |
---|---|---|---|---|---|
Conservative | Jonica Fox | 511 | 69.0 | ||
Liberal Democrat | Michael Bryant | 177 | 23.9 | ||
Green | Jennifer Evans | 53 | 7.2 | ||
Majority | 334 | 45.1 | |||
Turnout | 741 | 38.2 |
Party | Candidate | Votes | % | ± | |
---|---|---|---|---|---|
Liberal Democrat | Carolyn Clark | 555 | |||
Liberal Democrat | Ian Mein | 540 | |||
Conservative | Anthony Edwards | 422 | |||
Conservative | Neil Waller | 408 | |||
Labour | Derek Sivers | 118 | |||
Turnout | 2,043 | 27.5 |
Party | Candidate | Votes | % | ± | |
---|---|---|---|---|---|
Independent | Ian McKirgan | 222 | 39.0 | ||
Liberal Democrat | Peter Bucklitsch | 221 | 38.8 | ||
Conservative | Brian Hewitt | 126 | 22.1 | ||
Majority | 1 | 0.2 | |||
Turnout | 569 | 28.8 |
Party | Candidate | Votes | % | ± | |
---|---|---|---|---|---|
Independent | Chantal Wilson | 1,038 | |||
Conservative | Hector Munro | 671 | |||
Liberal Democrat | Nigel Mahony | 328 | |||
Labour | Sonja Le Vay | 201 | |||
Independent | Michael Wallman | 131 | |||
Turnout | 2,369 | 35.8 |
Party | Candidate | Votes | % | ± | |
---|---|---|---|---|---|
Conservative | Richard Broughton-Tompkins | 458 | 75.3 | ||
Liberal Democrat | Hilary Lyon | 103 | 16.9 | ||
Labour | Jean McCarthy | 47 | 7.7 | ||
Majority | 355 | 58.4 | |||
Turnout | 608 | 32.0 |
Party | Candidate | Votes | % | ± | |
---|---|---|---|---|---|
Conservative | Diane Phillips | 814 | |||
Conservative | Antony Quin | 812 | |||
Liberal Democrat | Edward Willis | 394 | |||
Labour | Brendan Clegg | 238 | |||
Turnout | 2,258 | 32.2 |
Party | Candidate | Votes | % | ± | |
---|---|---|---|---|---|
Conservative | Sylvia Martin | 1,052 | |||
Conservative | Bernard Brown | 1,024 | |||
Liberal Democrat | John Stevens | 571 | |||
Turnout | 2,647 | 39.6 |
Party | Candidate | Votes | % | ± | |
---|---|---|---|---|---|
Conservative | Brian West | 612 | 67.8 | ||
Liberal Democrat | Robert Hillman | 290 | 32.2 | ||
Majority | 322 | 35.7 | |||
Turnout | 902 | 46.9 |
Party | Candidate | Votes | % | ± | |
---|---|---|---|---|---|
Conservative | Rowena Moore | 708 | |||
Conservative | Raymond Parsons | 668 | |||
Liberal Democrat | Linda Graham | 526 | |||
Labour | Norma McNamara | 270 | |||
Turnout | 2,172 | 33.5 |
Party | Candidate | Votes | % | ± | |
---|---|---|---|---|---|
Conservative | John Gore | 563 | 64.9 | ||
Liberal Democrat | Susanna Mockridge | 168 | 19.4 | ||
UKIP | Keith Riddle | 137 | 15.8 | ||
Majority | 395 | 45.5 | |||
Turnout | 868 | 42.2 |
Party | Candidate | Votes | % | ± | |
---|---|---|---|---|---|
Conservative | Christopher Abergavenny | 827 | |||
Conservative | Lynda Myers | 822 | |||
Liberal Democrat | Briony Taylor | 431 | |||
Green | Keith Obbard | 404 | |||
Labour | Michael Clare | 179 | |||
Turnout | 2,663 | 38.6 |
Party | Candidate | Votes | % | ± | |
---|---|---|---|---|---|
Liberal Democrat | Paul Holbrook | 494 | |||
Liberal Democrat | Laura Murphy | 434 | |||
Conservative | Richard West | 425 | |||
Conservative | John Ball | 419 | |||
Independent | John Glover | 348 | |||
Independent | Madeleine Ellwood | 344 | |||
Labour | Steven Jordan | 146 | |||
Turnout | 2,610 | 32.1 |
Party | Candidate | Votes | % | ± | |
---|---|---|---|---|---|
Conservative | Nigel Coltman | 170 | 33.7 | ||
Liberal Democrat | Brian Cock | 128 | 25.3 | ||
Labour | Dudley Rose | 113 | 22.4 | ||
Independent | William Crittenden | 94 | 18.6 | ||
Majority | 42 | 8.3 | |||
Turnout | 505 | 26.6 |
Party | Candidate | Votes | % | ± | |
---|---|---|---|---|---|
Independent | Geoffrey Rowe | 713 | |||
Independent | Jonathan Ellwood | 702 | |||
Independent | Ian Haffenden | 685 | |||
Liberal Democrat | Sharon Cottingham | 572 | |||
Conservative | Sybil Bentley | 567 | |||
Liberal Democrat | Edward Powell | 554 | |||
Liberal Democrat | Gavin Blake-Coggins | 551 | |||
Conservative | Jeffery Bentley-Astor | 524 | |||
Conservative | John Kent | 511 | |||
Turnout | 5,379 | 28.7 |
Party | Candidate | Votes | % | ± | |
---|---|---|---|---|---|
Conservative | Jeremy Hollins | unopposed |
Party | Candidate | Votes | % | ± | |
---|---|---|---|---|---|
Conservative | Janice Dunk | 443 | 69.9 | ||
Liberal Democrat | John Evans | 191 | 30.1 | ||
Majority | 252 | 39.7 | |||
Turnout | 634 | 34.8 |
Party | Candidate | Votes | % | ± | |
---|---|---|---|---|---|
Conservative | Richard Angel | 1,082 | |||
Conservative | Margaret Kirkpatrick | 1,063 | |||
Conservative | Veronica Oakes | 996 | |||
Liberal Democrat | David Hall | 447 | |||
Green | Timothy Rayner | 432 | |||
Turnout | 4,020 | 28.2 |
Party | Candidate | Votes | % | ± | |
---|---|---|---|---|---|
Liberal Democrat | John Blake | 817 | |||
Liberal Democrat | David White | 732 | |||
Conservative | Barby Dashwood-Hall | 583 | |||
Conservative | Brian Smith | 528 | |||
Turnout | 2,660 | 36.9 |
Party | Candidate | Votes | % | ± | |
---|---|---|---|---|---|
Conservative | Andrew Long | 477 | 63.1 | ||
Liberal Democrat | Graham Love | 279 | 36.9 | ||
Majority | 198 | 26.2 | |||
Turnout | 756 | 36.5 |
Party | Candidate | Votes | % | ± | |
---|---|---|---|---|---|
Conservative | Susan Stedman | 381 | 56.9 | ||
Liberal Democrat | Richard Benson | 289 | 43.1 | ||
Majority | 92 | 13.7 | |||
Turnout | 670 | 33.2 |
Party | Candidate | Votes | % | ± | |
---|---|---|---|---|---|
Conservative | Brian Redman | 459 | 54.3 | ||
Liberal Democrat | Allan Thurley | 387 | 45.7 | ||
Majority | 72 | 8.5 | |||
Turnout | 846 | 41.7 |
Party | Candidate | Votes | % | ± | |
---|---|---|---|---|---|
Conservative | Pamela Doodes | unopposed |
Party | Candidate | Votes | % | ± | |
---|---|---|---|---|---|
Conservative | Dianne Dear | 1,245 | |||
Conservative | John Vincent | 1,233 | |||
Conservative | Linda McKeever | 1,135 | |||
Liberal Democrat | Laura Parker | 793 | |||
Liberal Democrat | Christine Thomas | 781 | |||
Turnout | 5,187 | 29.7 |
Party | Candidate | Votes | % | ± | |
---|---|---|---|---|---|
Liberal Democrat | Roy Martin | 888 | |||
Liberal Democrat | Christina Berry | 802 | |||
Independent | Gerald Carter | 478 | |||
Independent | John Harmer | 453 | |||
Conservative | Anne Hampson | 160 | |||
Conservative | Michael Hampson | 152 | |||
Turnout | 2,933 | 37.7 |
Party | Candidate | Votes | % | ± | |
---|---|---|---|---|---|
Independent | Ivy Scarborough | 349 | 45.7 | ||
Liberal Democrat | Patrick Trowell | 241 | 31.6 | ||
Conservative | Michael Richards | 173 | 22.7 | ||
Majority | 108 | 14.2 | |||
Turnout | 763 | 38.7 |
Party | Candidate | Votes | % | ± | |
---|---|---|---|---|---|
Conservative | David Logan | 379 | 47.4 | ||
Liberal Democrat | Edwin Rice | 365 | 45.7 | ||
Independent | David Heritage | 55 | 6.9 | ||
Majority | 14 | 1.8 | |||
Turnout | 799 | 41.7 |
Party | Candidate | Votes | % | ± | |
---|---|---|---|---|---|
Conservative | Claire Dowling | 425 | 52.7 | ||
Liberal Democrat | Michael Cooper | 308 | 38.2 | ||
Labour | Eileen Wolley | 73 | 9.1 | ||
Majority | 117 | 14.5 | |||
Turnout | 806 | 35.1 |
Party | Candidate | Votes | % | ± | |
---|---|---|---|---|---|
Liberal Democrat | Ian Nottage | 339 | 54.2 | ||
Labour | Ian Smith | 144 | 23.0 | ||
Conservative | Daphne Mainprice | 143 | 22.8 | ||
Majority | 195 | 31.2 | |||
Turnout | 626 | 31.0 |
Party | Candidate | Votes | % | ± | |
---|---|---|---|---|---|
Liberal Democrat | Paul Sparks | 632 | |||
Liberal Democrat | Alan Whittaker | 520 | |||
Conservative | Michael Heap | 356 | |||
Labour | Duncan Bennett | 250 | |||
Labour | Leonard Ashby | 246 | |||
Turnout | 2,004 | 27.8 |
Party | Candidate | Votes | % | ± | |
---|---|---|---|---|---|
Liberal Democrat | Anthony Parker | 483 | 57.2 | ||
Conservative | Silvia Buck | 310 | 36.7 | ||
Labour | Jane 'Espinasse | 51 | 6.0 | ||
Majority | 173 | 20.5 | |||
Turnout | 844 | 39.1 |
Party | Candidate | Votes | % | ± | |
---|---|---|---|---|---|
Conservative | Anna Monaghan | 767 | |||
Conservative | Robert Hodgson | 734 | |||
Liberal Democrat | Emma Sanderson-Nash | 395 | |||
Liberal Democrat | Rosalyn Bucklitsch | 324 | |||
Labour | Jane Zacharzewski | 144 | |||
Turnout | 2,364 | 32.0 |
Party | Candidate | Votes | % | ± | |
---|---|---|---|---|---|
Liberal Democrat | Stephen Shing | 1,770 | |||
Liberal Democrat | Anthony Seabrook | 1,559 | |||
Liberal Democrat | Andrew Watkins | 1,516 | |||
Conservative | David Burtenshaw | 1,043 | |||
Conservative | Guy Woodford | 1,000 | |||
Conservative | Raymond Ingram | 949 | |||
Independent | Margaret Piper | 216 | |||
Labour | Patricia Brinson | 123 | |||
Labour | Helen Sedgewick | 114 | |||
Labour | Gillian Roles | 77 | |||
Turnout | 8,367 | 48.7 |
A by-election was held in Uckfield Ridgewood on 16 September 2004 and was held for the Liberal Democrats by Robert Sweetland with a 185-vote majority. [14] [15]
Party | Candidate | Votes | % | ± | |
---|---|---|---|---|---|
Liberal Democrat | Robert Sweetland | 380 | 60.4 | +3.2 | |
Conservative | Jacob Vince | 195 | 31.0 | -5.7 | |
Labour | Leonard Ashby | 54 | 8.6 | +2.6 | |
Majority | 185 | 29.4 | +8.9 | ||
Turnout | 629 | 28.6 | +8.1 | ||
Liberal Democrat hold | Swing |
A by-election was held in Pevensey and Westham on 29 September 2005 after the death of the previous councillor John Vincent. [14] [16] The seat was held for the Conservatives by Kevin Balsdon with a 760-vote majority. [13] [17]
Party | Candidate | Votes | % | ± | |
---|---|---|---|---|---|
Conservative | Kevin Balsdon | 1,229 | 66.7 | +5.6 | |
Liberal Democrat | Christine Thomas | 469 | 25.5 | -13.4 | |
Labour | Robert Walker | 143 | 7.8 | +7.8 | |
Majority | 760 | 41.2 | |||
Turnout | 1,841 | 25.7 | -4.0 | ||
Conservative hold | Swing |
A by-election was held in Crowoborough North on 6 April 2006 and was held for the Conservatives by Timothy Tyler with a 279-vote majority. [14] [18]
Party | Candidate | Votes | % | ± | |
---|---|---|---|---|---|
Conservative | Timothy Tyler | 417 | 52.5 | +22.5 | |
Liberal Democrat | Peter Bucklitsch | 138 | 17.4 | +2.7 | |
Independent | Paul Scott | 103 | 13.0 | -33.4 | |
Labour | Jean McCarthy | 94 | 11.8 | +2.8 | |
Independent | Colin Stocks | 43 | 5.4 | +5.4 | |
Majority | 279 | 35.1 | |||
Turnout | 795 | 20.1 | -15.7 | ||
Conservative hold | Swing |
A by-election was held in Uckfield New Town on 29 June 2006 after the death of the Liberal Democrat councillor Ian Nottage. [14] [19] The seat was held for the Liberal Democrats by Julia Hey with a 170-vote majority. [20]
Party | Candidate | Votes | % | ± | |
---|---|---|---|---|---|
Liberal Democrat | Julia Hey | 381 | 57.6 | +3.4 | |
Conservative | Marion Rowland | 211 | 31.9 | +9.1 | |
Green | Samantha Bryant | 69 | 10.4 | +10.4 | |
Majority | 170 | 25.7 | -5.5 | ||
Turnout | 661 | 32.5 | +1.5 | ||
Liberal Democrat hold | Swing |
Polegate is a town and civil parish in the Wealden District of East Sussex, England, United Kingdom. It is located five miles (8 km) north of the seaside resort of Eastbourne and is part of the greater area of that town. Although once a railway settlement, its importance as such has now waned by route closures. The civil parish of Polegate had a population of 8,586 on the 2011 census, 41.2% aged 65 and over.
Wealden is a constituency represented in the House of Commons of the UK Parliament since 2015 by Nus Ghani, a Conservative. Ghani was the first Muslim woman to be elected as a Conservative member of Parliament.
Eastbourne is a constituency for the House of Commons of the UK Parliament. It was created as one of nine in Sussex in 1885, since when the seat has reduced in geographic size reflecting the growth of its main settlement, Eastbourne.
The 2003 Worthing Borough Council election took place on 1 May 2003 to elect members of Worthing Borough Council in West Sussex, England. One third of the council was up for election and the Liberal Democrats lost overall control of the council to no overall control. Overall turnout was 28.61%.
The 2007 Pendle Borough Council election took place on 3 May 2007 to elect members of Pendle Borough Council in Lancashire, England. One third of the council was up for election and the Liberal Democrats stayed in overall control of the council.
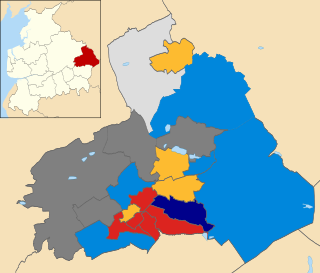
The 2008 Pendle Borough Council election took place on 1 May 2008 to elect members of Pendle Borough Council in Lancashire, England. One third of the council was up for election and the Liberal Democrats lost overall control of the council to no overall control.
The 2003 Derbyshire Dales District Council election took place on 1 May 2003 to elect members of Derbyshire Dales District Council in Derbyshire, England. The whole council was up for election with boundary changes since the last election in 1999. The Conservative party stayed in overall control of the council.
The 2003 Eastbourne Borough Council election took place on 1 May 2003 to elect members of Eastbourne Borough Council in East Sussex, England. One third of the council was up for election and the Liberal Democrats stayed in overall control of the council.
The 2006 Eastbourne Council election took place on 4 May 2006 to elect members of Eastbourne Borough Council in East Sussex, England. One third of the council was up for election and the Conservative party stayed in overall control of the council.
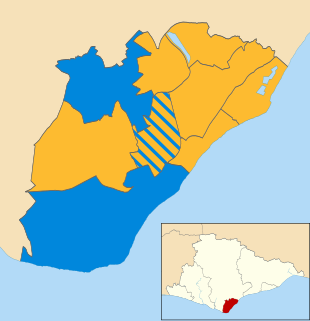
The 2007 Eastbourne Borough Council election took place on 3 May 2007 to elect members of Eastbourne Borough Council in East Sussex, England. The whole council was up for election and the Liberal Democrats gained overall control of the council from the Conservative party.
The 1999 Wealden District Council election took place on 6 May 1999 to elect members of Wealden District Council in East Sussex, England. The whole council was up for election and the Conservative party stayed in overall control of the council.
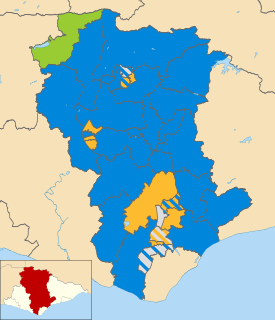
The 2007 Wealden District Council election took place on 3 May 2007 to elect members of Wealden District Council in East Sussex, England. The whole council was up for election and the Conservative party stayed in overall control of the council.
The 2011 Wealden District Council election took place on 5 May 2011 to elect members of Wealden District Council in East Sussex, England. The whole council was up for election and the Conservative party stayed in overall control of the council.
The 2003 Rother District Council election took place on 1 May 2003 to elect members of Rother District Council in East Sussex, England. The whole council was up for election after boundary changes reduced the number of seats by 7. The Conservative party stayed in overall control of the council.
The 2007 Rother District Council election took place on 3 May 2007 to elect members of Rother District Council in East Sussex, England. The whole council was up for election and the Conservative party stayed in overall control of the council.
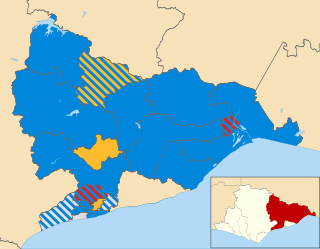
The 2011 Rother District Council election took place on 5 May 2011 to elect members of Rother District Council in East Sussex, England. The whole council was up for election and the Conservative party stayed in overall control of the council.
The 2014 Craven District Council election took place on 22 May 2014 to elect members of Craven District Council in North Yorkshire, England. One third of the council was up for election and the Conservative party stayed in overall control of the council.
Uckfield Town Council governs the four wards of Uckfield town. The council appoints one councillor who is then known as the Mayor of Uckfield. The current Mayor of Uckfield is Councillor Spike Mayhew.
The 2018 City of Bradford Metropolitan District Council took place on 3 May 2018 to elect members of Bradford District Council in England. This was on the same day as other local elections. One councillor was elected in each ward for a four-year term so the councillors elected in 2018 last stood for election in 2014. Each ward is represented by three councillors, the election of which is staggered, so only one third of the councillors were elected in this election. Before the election there was a Labour majority and afterwards Labour had increased their majority.