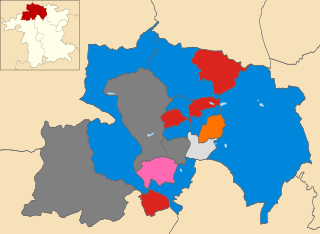
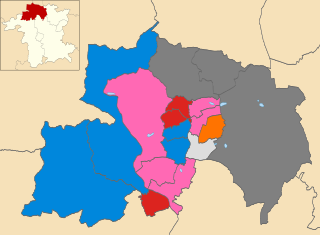
The 2010 Wyre Forest District Council election took place on 6 May 2010 to elect members of Wyre Forest District Council in Worcestershire, England. One third of the council was up for election and the Conservative party gained overall control of the council from no overall control. [1]
Non-metropolitan districts, or colloquially "shire districts", are a type of local government district in England. As created, they are sub-divisions of non-metropolitan counties in a two-tier arrangement.
Worcestershire is a county in the West Midlands of England. Between 1974 and 1998, it was merged with the neighbouring county of Herefordshire as Hereford and Worcester.
England is a country that is part of the United Kingdom. It shares land borders with Wales to the west and Scotland to the north-northwest. The Irish Sea lies west of England and the Celtic Sea lies to the southwest. England is separated from continental Europe by the North Sea to the east and the English Channel to the south. The country covers five-eighths of the island of Great Britain, which lies in the North Atlantic, and includes over 100 smaller islands, such as the Isles of Scilly and the Isle of Wight.
After the election, the composition of the council was
The Conservative Party, officially the Conservative and Unionist Party, is a centre-right political party in the United Kingdom. Presently led by Theresa May, it has been the governing party since 2010. It presently has 314 Members of Parliament in the House of Commons, 249 members of the House of Lords, and 18 members of the European Parliament. It also has 31 Members of the Scottish Parliament, 12 members of the Welsh Assembly, eight members of the London Assembly and 9,008 local councillors. One of the major parties of UK politics, it has formed the government on 45 occasions, more than any other party.
Independent Community and Health Concern, previously Independent Kidderminster Hospital and Health Concern is a political party based in Kidderminster, United Kingdom. It grew out of the campaign to restore the casualty unit at Kidderminster Hospital, and the National Health Service is still its primary focus, but the party has since diversified. Since 2015 it has also been known as the Wyre Forest Independent Party and has successfully contested local elections within the Wyre Forest local government area, which includes Kidderminster.
The Liberal Party is a British political party that was founded in 1989 by members of the original Liberal Party opposed to its merger with the Social Democratic Party (SDP) to form the Liberal Democrats. The party holds seven local council seats.
Overall turnout at the election was 65.6%. [3]
Party | Seats | Gains | Losses | Net gain/loss | Seats % | Votes % | Votes | +/− | |
---|---|---|---|---|---|---|---|---|---|
Conservative | 9 | 2 | 0 | +2 | 64.3 | 39.1 | 18,175 | -2.0% | |
Health Concern | 3 | 0 | 2 | -2 | 21.4 | 24.8 | 11,517 | +0.1% | |
Liberal | 2 | 0 | 0 | 0 | 14.3 | 6.9 | 3,216 | -3.5% | |
Labour | 0 | 0 | 0 | 0 | 0 | 18.6 | 8,657 | +4.8% | |
Liberal Democrat | 0 | 0 | 0 | 0 | 0 | 9.0 | 4,190 | +2.7% | |
Green | 0 | 0 | 0 | 0 | 0 | 1.6 | 765 | +1.6% | |
Party | Candidate | Votes | % | ± | |
---|---|---|---|---|---|
Conservative | John Aston | 1,349 | 38.1 | +9.8 | |
Liberal Democrat | David Ross | 1,216 | 34.3 | -15.7 | |
Health Concern | Peter Young | 591 | 16.7 | +0.9 | |
Labour | Leroy Wright | 386 | 10.9 | +4.9 | |
Majority | 133 | 3.8 | |||
Turnout | 3,542 | 68.0 | +33.0 | ||
Conservative hold | Swing | ||||
Party | Candidate | Votes | % | ± | |
---|---|---|---|---|---|
Health Concern | Nigel Thomas | 1,176 | 38.8 | +9.6 | |
Conservative | Kenneth Henderson | 1,096 | 36.2 | +1.0 | |
Labour | Violet Higgs | 757 | 25.0 | -7.8 | |
Majority | 80 | 2.6 | |||
Turnout | 3,029 | 66.1 | +25.2 | ||
Health Concern hold | Swing | ||||
Party | Candidate | Votes | % | ± | |
---|---|---|---|---|---|
Conservative | Stephen Clee | 1,550 | 39.9 | -2.2 | |
Health Concern | Derek Killingworth | 1,070 | 27.5 | +7.5 | |
Liberal Democrat | Dorothy Smith | 715 | 18.4 | +18.4 | |
Labour | Samuel Arnold | 549 | 14.1 | +0.0 | |
Majority | 480 | 12.4 | -5.9 | ||
Turnout | 3,884 | 72.9 | +31.9 | ||
Conservative hold | Swing | ||||
Party | Candidate | Votes | % | ± | |
---|---|---|---|---|---|
Conservative | Pauline Hayward | 1,685 | 67.4 | ||
Health Concern | Elizabeth Davies | 572 | 22.9 | ||
Labour | Diana Udall | 243 | 9.7 | ||
Majority | 1,113 | 44.5 | |||
Turnout | 2,500 | 76.5 | |||
Conservative hold | Swing | ||||
Party | Candidate | Votes | % | ± | |
---|---|---|---|---|---|
Health Concern | Howard Martin | 1,345 | 38.4 | +13.6 | |
Conservative | Steven Walker | 1,147 | 32.7 | +0.2 | |
Labour | Adrian Sewell | 781 | 22.3 | +12.6 | |
Green | John Harris | 233 | 6.6 | +6.6 | |
Majority | 198 | 5.6 | |||
Turnout | 3,506 | 59.0 | +29.1 | ||
Health Concern hold | Swing | ||||
Party | Candidate | Votes | % | ± | |
---|---|---|---|---|---|
Conservative | Daniel McCann | 1,374 | 36.7 | -18.2 | |
Labour | Nigel Knowles | 943 | 25.2 | +10.4 | |
Health Concern | Michael Shellie | 884 | 23.6 | -2.9 | |
Liberal Democrat | Michael Dixon | 446 | 11.9 | +11.9 | |
Green | Phillip Oliver | 94 | 2.5 | +2.5 | |
Majority | 431 | 11.5 | -16.9 | ||
Turnout | 3,741 | 68.8 | +31.0 | ||
Conservative gain from Health Concern | Swing | ||||
Party | Candidate | Votes | % | ± | |
---|---|---|---|---|---|
Liberal | Timothy Ingham | 1,567 | 41.7 | -10.5 | |
Conservative | Christopher Morrall | 1,181 | 31.4 | +12.5 | |
Labour | Paul Mills | 762 | 20.3 | +11.6 | |
Green | Alexandra Heelis | 248 | 6.6 | +6.6 | |
Majority | 386 | 10.3 | -21.7 | ||
Turnout | 3,758 | 61.8 | +32.3 | ||
Liberal hold | Swing | ||||
Party | Candidate | Votes | % | ± | |
---|---|---|---|---|---|
Conservative | Ian Hardiman | 1,275 | 36.8 | -2.8 | |
Labour | Barry McFarland | 842 | 24.3 | -2.1 | |
Health Concern | Gillian Carr | 814 | 23.5 | +1.8 | |
Liberal Democrat | Clare Cassidy | 458 | 13.2 | +13.2 | |
Green | David Finch | 78 | 2.2 | +2.2 | |
Majority | 433 | 12.5 | -0.7 | ||
Turnout | 3,467 | 66.8 | +26.8 | ||
Conservative gain from Health Concern | Swing | ||||
Party | Candidate | Votes | % | ± | |
---|---|---|---|---|---|
Health Concern | Dixon Sheppard | 1,517 | 42.0 | -7.6 | |
Conservative | Michael Freeman | 1,420 | 39.3 | -0.6 | |
Labour | Jennifer Knowles | 676 | 18.7 | +8.2 | |
Majority | 97 | 2.7 | -7.0 | ||
Turnout | 3,613 | 66.2 | +32.2 | ||
Health Concern hold | Swing | ||||
Party | Candidate | Votes | % | ± | |
---|---|---|---|---|---|
Conservative | Michael Salter | 1,802 | 46.0 | -0.2 | |
Health Concern | Clifford Brewer | 1,402 | 35.8 | -2.8 | |
Labour | Gary Watson | 717 | 18.3 | +6.8 | |
Majority | 400 | 10.2 | +2.6 | ||
Turnout | 3,921 | 67.4 | +33.4 | ||
Conservative hold | Swing | ||||
Party | Candidate | Votes | % | ± | |
---|---|---|---|---|---|
Liberal | Rosemary Bishop | 1,649 | 45.2 | -6.7 | |
Conservative | Christopher Rogers | 1,046 | 28.7 | +1.2 | |
Labour | Matthew Nicholls | 489 | 13.4 | +5.0 | |
Health Concern | Raymond Barber | 465 | 12.7 | +0.5 | |
Majority | 603 | 16.5 | -7.9 | ||
Turnout | 3,649 | 68.3 | +31.3 | ||
Liberal hold | Swing | ||||
Party | Candidate | Votes | % | ± | |
---|---|---|---|---|---|
Conservative | Nichola Gale | 584 | 33.4 | -17.0 | |
Labour | Dan Watson | 415 | 23.7 | +10.0 | |
Liberal Democrat | Adrian Beavis | 378 | 21.6 | +6.6 | |
Health Concern | Caroline Shellie | 373 | 21.3 | +0.5 | |
Majority | 169 | 9.7 | -19.9 | ||
Turnout | 1,750 | 47.5 | +19.6 | ||
Conservative hold | Swing | ||||
Party | Candidate | Votes | % | ± | |
---|---|---|---|---|---|
Conservative | John-Paul Campion | 1,409 | 42.2 | -17.4 | |
Liberal Democrat | Samantha Walker | 612 | 18.3 | +9.3 | |
Labour | David Prain | 605 | 18.1 | +8.8 | |
Health Concern | John Griffiths | 603 | 18.0 | -4.1 | |
Green | Michael Whitbread | 112 | 3.4 | +3.4 | |
Majority | 797 | 23.9 | -13.6 | ||
Turnout | 3,341 | 59.5 | +25.5 | ||
Conservative hold | Swing | ||||
Party | Candidate | Votes | % | ± | |
---|---|---|---|---|---|
Conservative | Gordon Yarranton | 1,257 | 44.6 | -2.9 | |
Health Concern | Linda Candlin | 705 | 25.0 | -4.8 | |
Labour | Dean Cox | 492 | 17.5 | -1.5 | |
Liberal Democrat | John Stephen | 365 | 12.9 | +12.9 | |
Majority | 552 | 19.6 | +1.9 | ||
Turnout | 2,819 | 71.2 | +32.0 | ||
Conservative hold | Swing | ||||
The 1998 Wyre Forest District Council election took place on 7 May 1998 to elect members of Wyre Forest District Council in Worcestershire, England. One third of the council was up for election and the Labour party stayed in overall control of the council.
The 1999 Wyre Forest District Council election took place on 6 May 1999 to elect members of Wyre Forest District Council in Worcestershire, England. One third of the council was up for election and the Labour party lost overall control of the council to no overall control.
The 2000 Wyre Forest District Council election took place on 4 May 2000 to elect members of Wyre Forest District Council in Worcestershire, England. One third of the council was up for election and the council stayed under no overall control.
The 2002 Wyre Forest District Council election took place on 2 May 2002 to elect members of Wyre Forest District Council in Worcestershire, England. One third of the council was up for election and the Independent Kidderminster Hospital and Health Concern party gained overall control of the council from no overall control.
The 2003 Wyre Forest District Council election took place on 1 May 2003 to elect members of Wyre Forest District Council in Worcestershire, England. One third of the council was up for election and the council stayed under no overall control.
The 2004 Wyre Forest District Council election took place on 10 June 2004 to elect members of Wyre Forest District Council in Worcestershire, England. The whole council was up for election with boundary changes since the last election in 2003. The council stayed under no overall control, but with the Conservatives taking over as the largest party on the council from the Health Concern party.
The 2006 Wyre Forest District Council election took place on 4 May 2006 to elect members of Wyre Forest District Council in Worcestershire, England. One third of the council was up for election and the council stayed under no overall control.
The 2007 Wyre Forest District Council election took place on 3 May 2007 to elect members of Wyre Forest District Council in Worcestershire, England. One third of the council was up for election and the council stayed under no overall control.
The 2008 Wyre Forest District Council election took place on 1 May 2008 to elect members of Wyre Forest District Council in Worcestershire, England. One third of the council was up for election and the Conservative party gained overall control of the council from no overall control.
Local elections were held in the United Kingdom on 3 May 1979. The results provided some source of comfort to the Labour Party (UK), who recovered some lost ground from local election reversals in previous years, despite losing the general election to the Conservative Party on the same day.
The 2010 Harlow District Council election took place on 6 May 2010 to elect members of Harlow District Council in Essex, England. One third of the council was up for election and the Conservative party stayed in overall control of the council.
The 2011 Harlow District Council election took place on 5 May 2011 to elect members of Harlow District Council in Essex, England. One third of the council was up for election and the Conservative party stayed in overall control of the council.
The 2011 Wyre Forest District Council election took place on 5 May 2011 to elect members of Wyre Forest District Council in Worcestershire, England. One third of the council was up for election and the Conservative party stayed in overall control of the council.
The 2012 Wyre Forest District Council election took place on 3 May 2012 to elect members of Wyre Forest District Council in Worcestershire, England. One third of the council was up for election and the Conservative party lost overall control of the council to no overall control.
The 2014 Wyre Forest District Council election took place on 22 May 2014 to elect members of Wyre Forest District Council in Worcestershire, England. One third of the council was up for election and the council stayed under no overall control.
The 2003 South Kesteven District Council election took place on 1 May 2003 to elect members of South Kesteven District Council in Lincolnshire, England. The whole council was up for election and the Conservative party gained control of the council from no overall control.
The 2015 Wyre Forest District Council election took place on 7 May 2015 to elect members of Wyre Forest District Council in Worcestershire, England. The whole council was up for election after boundary changes reduced the number of seats by nine. The Conservative party gained overall control of the council from no overall control.
The 2006 West Oxfordshire District Council election took place on 4 May 2006 to elect members of West Oxfordshire District Council in Oxfordshire, England. One third of the council was up for election and the Conservative party stayed in overall control of the council.