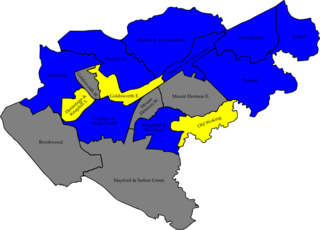
Elections to Broxtowe Borough Council were held on 5 May 2011 to elect all 44 members to the Council.
The Conservative party held overall control of the council from its foundation in 1973 until 1995 when the Labour party took control. The 2003 election saw Labour lose overall control of the council. [1] Since 2003 the council has been under no overall control with Labour and the Liberal Democrats sharing power. [2] [3]
The Conservative Party, officially the Conservative and Unionist Party, is a centre-right political party in the United Kingdom. Presently led by Theresa May, it has been the governing party since 2010. It presently has 314 Members of Parliament in the House of Commons, 249 members of the House of Lords, and 18 members of the European Parliament. It also has 31 Members of the Scottish Parliament, 12 members of the Welsh Assembly, eight members of the London Assembly and 9,008 local councillors. One of the major parties of UK politics, it has formed the government on 45 occasions, more than any other party.
The Labour Party is a centre-left political party in the United Kingdom which has been described as an alliance of social democrats, democratic socialists and trade unionists. The party's platform emphasises greater state intervention, social justice and strengthening workers' rights.
In the context of local authorities in the United Kingdom, the term no overall control refers to a situation in which no single political group achieves a majority of seats; and is analogous to a hung parliament. Of the 310 councils who had members up for election in the 2007 local elections, 85 resulted in a NOC administration.
The previous whole-council election was held in 2007 and the results were: Conservative 16, Liberal Democrats 15, Labour 10 (including the results of a delayed election), [4] Independent 2, British National Party 1. [5] The Conservatives have the largest representation on the council and in a by-election in 2009 gained the one seat the BNP won in 2007. [6]
The British National Party (BNP) is a far-right, fascist political party in the United Kingdom. It is headquartered in Wigton, Cumbria, and its current leader is Adam Walker. A minor party, it has no elected representatives at any level of UK government. Founded in 1982, the party reached its greatest level of success in the 2000s, when it had over fifty seats in local government, one seat on the London Assembly, and two Members of the European Parliament.
No boundary changes (to the borough's wards) took place between the 2007 and 2011 elections.
A total of 44 councillors were elected from 21 Wards. The council remained no overall control, with the Conservatives remaining the largest party. The Labour party took seats from the Liberal Democrats and became the second largest party on the council. [7]
Party | Seats | Gains | Losses | Net gain/loss | Seats % | Votes % | Votes | +/− | |
---|---|---|---|---|---|---|---|---|---|
Conservative | 18 | +2 | 31,886 | ||||||
Labour | 17 | +7 | 33,906 | ||||||
Liberal Democrat | 9 | -6 | 17,616 | ||||||
Independent | 0 | -2 | 160 | ||||||
UKIP | 0 | 0 | 623 | ||||||
BNP | 0 | -1 | 0 | ||||||
Green | 0 | 0 | 1,177 |
Gains/losses compared to the 2007 results.
Party | Candidate | Votes | % | |
---|---|---|---|---|
Conservative | Eric Kerry (E) | 616 | 55.6 | |
Labour | Thomas Paul Anderton | 414 | 37.4 | |
Liberal Democrat | Stephen Jonathen Rule | 78 | 7.0 | |
Turnout | 1124 | 60 |
Party | Candidate | Votes | % | |
---|---|---|---|---|
Conservative | Lydia Antoinette Ball (E) | 445 | 53.6 | |
Labour | Sarah Brown | 386 | 46.4 | |
Turnout | 841 | 49 |
Party | Candidate | Votes | % | |
---|---|---|---|---|
Labour | Lynda Lally (E) | 943 | 31.5 | |
Labour | Pat Lally (E) | 898 | 30.0 | |
Conservative | Mick Atherton | 390 | 13.0 | |
Conservative | Eileen Thompson | 362 | 12.1 | |
Green | Mary Evelyn Venning | 146 | 4.9 | |
Liberal Democrat | Paul Fox | 128 | 4.3 | |
Liberal Democrat | Stella Fox | 124 | 4.2 | |
Turnout | 3000 | 48 |
Party | Candidate | Votes | % | |
---|---|---|---|---|
Liberal Democrat | Steve Carr (E) | 1,027 | 25.4 | |
Labour | Andrea Jane Oates (E) | 766 | 19.0 | |
Liberal Democrat | Chris Salter | 717 | 17.7 | |
Labour | David Thomas Patrick | 701 | 17.4 | |
Conservative | Phillip John Carter Hopkinson | 352 | 8.7 | |
Conservative | Jeremy Treece | 256 | 6.3 | |
Green | Sylvia Anne Rule | 222 | 5.5 | |
Turnout | 4052 | 50 |
Party | Candidate | Votes | % | |
---|---|---|---|---|
Labour | Steve Barber (E) | 1,236 | 32.8 | |
Labour | Frank Prince (E) | 1,089 | 28.9 | |
Conservative | Barry Leonard Walter Chapman | 545 | 14.5 | |
Conservative | Stephanie Dawn Kerry | 540 | 14.3 | |
Liberal Democrat | John Murdoch Patrick | 186 | 4.9 | |
Liberal Democrat | Patricia Ann Taylor | 176 | 4.7 | |
Turnout | 3801 | 49 |
Party | Candidate | Votes | % | |
---|---|---|---|---|
Labour | Janet Patrick (E) | 1,080 | 24.3 | |
Labour | Greg Marshall (E) | 1,064 | 23.9 | |
Liberal Democrat | Graham Morley Hopcroft | 563 | 12.7 | |
Liberal Democrat | Brian Taylor | 522 | 11.7 | |
Conservative | Bill Shaw | 478 | 10.8 | |
Conservative | Richard Frank Skinner | 428 | 9.6 | |
Green | Paul Anderson | 183 | 4.1 | |
Green | Gordon Brian Stoner | 128 | 2.9 | |
Turnout | 4467 | 57 |
Party | Candidate | Votes | % | |
---|---|---|---|---|
Liberal Democrat | Stan Heptinstall (E) | 1,818 | 18.3 | |
Liberal Democrat | David Kenneth Watts (E) | 1,389 | 14.0 | |
Liberal Democrat | Ian Lloyd Tyler (E) | 1,335 | 13.4 | |
Conservative | John Anthony Doddy | 1,120 | 11.3 | |
Conservative | Phillip Edward Paul Archer Brooks-Stephenson | 1,060 | 10.7 | |
Conservative | Trevor Lewis Jones | 995 | 10.0 | |
Labour | Geoff Ward | 693 | 7.0 | |
Labour | Brian Pollard | 617 | 6.2 | |
Labour | Colin John Muge | 590 | 5.9 | |
UKIP | Chris Cobb | 318 | 3.2 | |
Turnout | 9948 | 59 |
Party | Candidate | Votes | % | |
---|---|---|---|---|
Conservative | John Leslie Booth (E) | 468 | 56.4 | |
Labour | Don Rowley | 246 | 29.6 | |
Green | Beth Hewis | 83 | 10.0 | |
Liberal Democrat | Martin Shaw | 33 | 4.0 | |
Turnout | 838 | 44 |
Party | Candidate | Votes | % | |
---|---|---|---|---|
Conservative | Joan Sylvia Briggs (E) | 974 | 25.1 | |
Conservative | Richard Ian Jackson (E) | 880 | 22.6 | |
Labour | Claire Lawrence | 858 | 22.1 | |
Labour | Jane Elizabeth Marshall | 847 | 21.8 | |
Liberal Democrat | Jane Carwen Lachhar | 176 | 4.5 | |
Liberal Democrat | Amanda Jane Hull | 154 | 4.0 | |
Turnout | 3923 | 52 |
Party | Candidate | Votes | % | |
---|---|---|---|---|
Conservative | Eileen Hepworth Atherton (E) | 1,168 | 16.6 | |
Conservative | Graham Harvey (E) | 1,075 | 15.2 | |
Conservative | Tim Brindley (E) | 1,047 | 14.8 | |
Labour | Alan Phillip Darley | 981 | 13.9 | |
Labour | Maureen Morgan | 901 | 12.8 | |
Labour | Kamal Choudhury | 887 | 12.6 | |
Liberal Democrat | Barbara Carr | 305 | 4.3 | |
Green | Richard David Eddleston | 296 | 4.2 | |
Liberal Democrat | Helen Grindell | 214 | 3.0 | |
Liberal Democrat | Brenda Houldsworth | 184 | 2.6 | |
Turnout | 7069 | 45 |
Party | Candidate | Votes | % | |
---|---|---|---|---|
Labour | Richard Stephen Robinson (E) | 1,284 | 18.7 | |
Labour | Mary McGuckin (E) | 1,131 | 16.4 | |
Labour | Andy Cooper (E) | 1,093 | 15.9 | |
Conservative | Shane Easom | 997 | 14.5 | |
Conservative | Mel Crow | 942 | 13.7 | |
Conservative | Edward Cubley | 729 | 10.6 | |
Liberal Democrat | Elaine Cockburn | 390 | 5.7 | |
Liberal Democrat | Godfrey Richard Walt | 166 | 2.4 | |
Liberal Democrat | Stephanie Mary Walt | 149 | 2.2 | |
Turnout | 6897 | 49 |
Party | Candidate | Votes | % | |
---|---|---|---|---|
Labour | David Bagshaw (E) | 408 | 20.4 | |
Liberal Democrat | Bob Charlesworth (E) | 358 | 17.9 | |
Labour | Ken Woodhead | 345 | 17.3 | |
Liberal Democrat | Hazel Lesley Charlesworth | 337 | 16.9 | |
Conservative | John William Handley | 292 | 14.6 | |
Conservative | Adrian Royce Limb | 257 | 12.9 | |
Turnout | 2013 | 45 |
Party | Candidate | Votes | % | |
---|---|---|---|---|
Labour | Milan Radulovic (E) | 1,008 | 17.4 | |
Labour | Susan Ann Bagshaw (E) | 984 | 17.0 | |
Labour | Charlie Robb (E) | 878 | 15.1 | |
Liberal Democrat | Keith Longdon | 577 | 9.9 | |
Liberal Democrat | Jossie Forrest | 537 | 9.3 | |
Liberal Democrat | David Hallam | 522 | 9.0 | |
Conservative | Christine Mary Bird | 476 | 8.2 | |
Conservative | June Layton | 462 | 8.0 | |
Conservative | Deborah Viitanen | 361 | 6.2 | |
Turnout | 5832 | 40 |
Party | Candidate | Votes | % | |
---|---|---|---|---|
Conservative | Mick Brown (E) | 1,331 | 19.1 | |
Conservative | Margaret Handley (E) | 1,196 | 17.2 | |
Conservative | Stuart Rowland (E) | 1,120 | 16.1 | |
Labour | Colin Neil Sansom | 945 | 13.6 | |
Labour | Laura Franchi | 896 | 12.9 | |
Labour | David Charles Kirwan | 874 | 12.6 | |
Liberal Democrat | Kevin Francis Wilkinson | 205 | 3.0 | |
Liberal Democrat | Lee-Ann Foreman | 202 | 2.9 | |
Liberal Democrat | Nigel Stephen Morgan | 187 | 2.7 | |
Turnout | 6976 | 51 |
Party | Candidate | Votes | % | |
---|---|---|---|---|
Conservative | Paul David Simpson (E) | 977 | 28.8 | |
Conservative | Nita Green (E) | 954 | 28.1 | |
Labour | Clare Colmore | 763 | 22.5 | |
Labour | Janet Pearce | 699 | 20.6 | |
Turnout | 3412 | 47 |
Party | Candidate | Votes | % | |
---|---|---|---|---|
Conservative | Jill Owen (E) | 1,084 | 31.7 | |
Conservative | Derek A Burnett (E) | 1,020 | 29.8 | |
Labour | Christine Brown | 673 | 19.7 | |
Labour | Laura Elizabeth Brown | 648 | 18.9 | |
Turnout | 3449 | 47 |
Party | Candidate | Votes | % | |
---|---|---|---|---|
Liberal Democrat | Brian Wombwell (E) | 500 | 22.5 | |
Labour | Iris White (E) | 442 | 19.9 | |
Liberal Democrat | Mark Andrew Elvin | 387 | 17.4 | |
Labour | Russell Whiting | 377 | 17.0 | |
Conservative | Phillip John Batty | 193 | 8.7 | |
Conservative | Margaret Deryn Braham | 164 | 7.4 | |
Independent | John Longdon | 160 | 7.2 | |
Turnout | 2231 | 45 |
Party | Candidate | Votes | % | |
---|---|---|---|---|
Liberal Democrat | Jacky Williams (E) | 770 | 21.9 | |
Liberal Democrat | David Grindell (E) | 711 | 20.2 | |
Labour | Glenn Baker | 577 | 16.4 | |
Conservative | Shaun Reynolds | 527 | 15.0 | |
Labour | Gill Yamin | 497 | 14.1 | |
Conservative | Pip Din | 434 | 12.3 | |
Turnout | 3531 | 50 |
Party | Candidate | Votes | % | |
---|---|---|---|---|
Labour | John William McGrath (E) | 797 | 29.1 | |
Labour | Ray Darby (E) | 702 | 25.6 | |
Liberal Democrat | Dave Pearson | 365 | 13.2 | |
Liberal Democrat | Kevin Thomas | 303 | 11.0 | |
Conservative | Christopher Harry Rice | 241 | 8.8 | |
Conservative | Andrew Britton | 211 | 7.7 | |
Green | Sarah Louise Camplin | 119 | 4.3 | |
Turnout | 2748 | 45 |
Party | Candidate | Votes | % | |
---|---|---|---|---|
Conservative | Marilyn Yvonne Hegyi (E) | 1,529 | 18.1 | |
Conservative | Craig Cox (E) | 1,491 | 17.7 | |
Conservative | Tony Ford (E) | 1,413 | 16.7 | |
Labour | David Smith | 926 | 11.0 | |
Labour | Joe Patrick | 925 | 11.0 | |
Labour | Dominic James Wring | 837 | 9.9 | |
Liberal Democrat | Bob Pembleton | 377 | 4.5 | |
Liberal Democrat | John Mark Rule | 334 | 4.0 | |
UKIP | Keith Willoughby Marriott | 305 | 3.6 | |
Liberal Democrat | Christine Mary Wombwell | 304 | 3.6 | |
Turnout | 8470 | 49 |
Party | Candidate | Votes | % | |
---|---|---|---|---|
Liberal Democrat | Ken Rigby (E) | 806 | 70.9 | |
Conservative | Christopher John Doddy | 186 | 16.4 | |
Labour | Chris Richmond | 145 | 12.8 | |
Turnout | 1141 | 57 |
By-elections are called when a representative Councillor resigns or dies, so are unpredictable. A by-election is held to fill a political office that has become vacant between the scheduled elections.
Party | Candidate | Votes | % | ± | |
---|---|---|---|---|---|
Conservative | Halimah Khaled | 831 | 47.6 | -4.9 | |
Labour | Jane Marshall | 385 | 22.1 | -9.8 | |
Liberal Democrat | Barbara Carr | 300 | 17.2 | +5.1 | |
UKIP | Keith Marriott | 228 | 13.1 | +9.5 | |
Majority | 446 | 25.6 | |||
Turnout | 1,744 | 28.1 | |||
Conservative hold | Swing |
Party | Candidate | Votes | % | ± | |
---|---|---|---|---|---|
Conservative | Mia Riona Kee | 952 | 54.5 | +2.6 | |
Labour | David Patrick | 454 | 26.0 | -5.9 | |
UKIP | Darryl Mark Paxford | 340 | 19.5 | +15.9 | |
Majority | |||||
Turnout | |||||
Conservative hold | Swing |
Broxtowe is a local government district with borough status in Nottinghamshire, England, west of the City of Nottingham. The population of the district as taken at the 2011 Census was 109,487. It is part of the Greater Nottingham metropolitan area. Broxtowe's neighbour to the west is the borough of Erewash, which is in Derbyshire.
Broxtowe Borough Council in Nottinghamshire, England is elected every four years. The Conservative party held overall control of the council from its foundation in 1973 until 1995 when the Labour party took control. Boundary changes took place for the 2003 election reducing the number of seats by five. The election saw Labour lose overall control of the council. Since 2003 the council has been under no overall control with Labour and the Liberal Democrats sharing power.
Thanet District Council in Kent, England is elected every four years.
The 2007 Woking Council election took place on 3 May 2007 to elect members of Woking Borough Council in Surrey, England. One third of the council was up for election and the Conservative party gained overall control of the council from no overall control.
The 2008 Woking Council election took place on 1 May 2008 to elect members of Woking Borough Council in Surrey, England. One third of the council was up for election and the Conservative party stayed in overall control of the council.
The 1999 Pendle Borough Council election took place on 6 May 1999 to elect members of Pendle Borough Council in Lancashire, England. One third of the council was up for election and the Liberal Democrats lost overall control of the council to no overall control.
The 2004 Pendle Borough Council election took place on 10 June 2004 to elect members of Pendle Borough Council in Lancashire, England. One third of the council was up for election and the Liberal Democrats gained overall control of the council from no overall control.
The 2007 Pendle Borough Council election took place on 3 May 2007 to elect members of Pendle Borough Council in Lancashire, England. One third of the council was up for election and the Liberal Democrats stayed in overall control of the council.
The 2007 Maidstone Borough Council election took place on 3 May 2007 to elect members of Maidstone Borough Council in Kent, England. One third of the council was up for election and the council stayed under no overall control.
The 2011 council elections in Guildford saw the Conservatives retain control over Guildford Borough Council with an increased majority of 20 seats. Full results for each ward can be found at Guildford Council election, full results, 2011.
The 2007 Walsall Metropolitan Borough Council election took place on 3 May 2007 to elect members of Walsall Metropolitan Borough Council in the West Midlands, England. One third of the council was up for election and the Conservative party stayed in overall control of the council.
The 2003 Hertsmere Borough Council election took place on 1 May 2003 to elect members of Hertsmere Borough Council in Hertfordshire, England. One third of the council was up for election and the Conservative party stayed in overall control of the council.
The 2007 Redcar and Cleveland Borough Council election took place on 3 May 2007 to elect members of Redcar and Cleveland Unitary Council in England. The whole council was up for election and the council stayed under no overall control.
The 2011 Eastbourne Borough Council election took place on 5 May 2011 to elect members of Eastbourne Borough Council in East Sussex, England. The whole council was up for election and the Liberal Democrats stayed in overall control of the council.
The 2008 Colchester Borough Council election took place on 1 May 2008 to elect members of Colchester Borough Council in Essex, England. One third of the council was up for election and the Conservative party lost overall control of the council to no overall control.
The 2006 Havant Borough Council election took place on 4 May 2006 to elect members of Havant Borough Council in Hampshire, England. One third of the council was up for election and the Conservative party stayed in overall control of the council.
The 2006 Brent London Borough Council election took place on 4 May 2006 to elect members of Brent London Borough Council in London, England. The whole council was up for election and the Labour party lost overall control of the council to no overall control.
The 2010 Brent London Borough Council election took place on 6 May 2010 to elect members of Brent London Borough Council in London, England. The whole council was up for election and the Labour party gained overall control of the council from no overall control.
Elections to Broxtowe Borough Council were held on 7 May 2015 to elect all 44 members to the Councils 20 electoral wards each electing between 1 and 3 members who will each serve a 4-year term expiring in 2019.