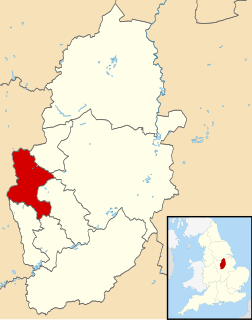
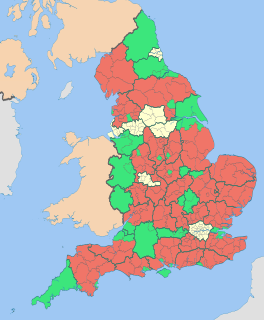
The 2011 Ashfield District Council election took place on 5 May 2011 to elect members of Ashfield District Council in Nottinghamshire, England. The whole council was up for election and the Labour party gained overall control of the council from no overall control. [1]
Ashfield is a local government district in western Nottinghamshire, England. According to the 2001 UK census, it has a population of 111,387, increasing to 119,497 at the 2011 Census. The district is mostly urban and contains parts of both the Nottingham Urban Area and the Mansfield Urban Area. The area has a tradition of coal mining. There are three towns in the district; the largest being Sutton-in-Ashfield. Settlements in the district include the following:
Non-metropolitan districts, or colloquially "shire districts", are a type of local government district in England. As created, they are sub-divisions of non-metropolitan counties in a two-tier arrangement.
Nottinghamshire is a county in the East Midlands region of England, bordering South Yorkshire to the north-west, Lincolnshire to the east, Leicestershire to the south, and Derbyshire to the west. The traditional county town is Nottingham, though the county council is based in West Bridgford in the borough of Rushcliffe, at a site facing Nottingham over the River Trent.
Before the 2011 election the Liberal Democrats formed the largest group on the council and following the 2007 election had led the council. [2] However the Labour, independent and Conservative councillors joined together to oust the Liberal Democrats, Labour's John Knight then became the leader of the council. [2] This lasted until the 2013 County Elections when due to a conflict with also being a Councillor at county level he stood down as leader. Since then the leader of Ashfield District Council has been Chris Baron.
The Liberal Democrats are a liberal political party in the United Kingdom. They presently have 11 Members of Parliament in the House of Commons, 96 members of the House of Lords, and one member of the European Parliament. They also have five Members of the Scottish Parliament and a member each in the Welsh Assembly and London Assembly. The party reached the height of its influence in the early 2010s, forming a junior partner in a coalition government from 2010 to 2015. It is presently led by Vince Cable.
The Conservative Party, officially the Conservative and Unionist Party, is a centre-right political party in the United Kingdom. Presently led by Theresa May, it has been the governing party since 2010. It presently has 314 Members of Parliament in the House of Commons, 249 members of the House of Lords, and 18 members of the European Parliament. It also has 31 Members of the Scottish Parliament, 12 members of the Welsh Assembly, eight members of the London Assembly and 9,008 local councillors. One of the major parties of UK politics, it has formed the government on 45 occasions, more than any other party.
A Councillor is a member of a local government council.
Before the election the Liberal Democrats had 13 councillors, compared to 10 independents, 9 Labour and 1 Conservative. [3] Both the Labour and Liberal Democrat parties put up 33 candidates in the election, compared to 13 Conservatives, with 9 of the 13 Conservative candidates being in Hucknall, which was seen as the Conservatives best area. There were 9 seats to be contested over 4 wards in Hucknall all of which Labour returned all 9.
Hucknall, formerly Hucknall Torkard, is an English town in the district of Ashfield, Nottinghamshire. It was historically a centre for framework knitting and then for mining, but is now a focus for other industries and a dormitory town for Nottingham. It was the site where Rolls-Royce made the first demonstration of a vertical take-off plane. It is also the final resting place of Lord Byron in 1824 and of his estranged daughter, the mathematician and pioneer computer programmer Ada Lovelace in 1852.
Three days before the election the national Labour leader Ed Miliband visited Kirkby in Ashfield to campaign in the local elections. He also visited Hucknall during his Labour leadership campaign in 2010. [4]
Edward Samuel Miliband is a British politician who was Leader of the Labour Party and Leader of the Opposition between 2010 and 2015. He became the Member of Parliament (MP) for Doncaster North in 2005, being re-elected in 2010, 2015, and 2017, and served in the Cabinet from 2007–10 under Prime Minister Gordon Brown.
The results had Labour gain 15 seats to win a majority on the council with 24 of the 33 seats. [5] Both the independents and Liberal Democrats lost 7 seats, to fall to 3 and 6 seats respectively. [5] Meanwhile, the only Conservative councillor, John Dymock, lost his seat in Hucknall North. [5] Overall turnout in the election was slightly under 39%. [3]
Voter turnout is the percentage of eligible voters who cast a ballot in an election. Eligibility varies by country, and the voting-eligible population should not be confused with the total adult population. Age and citizenship status are often among the criteria used to determine eligibility, but some countries further restrict eligibility based on sex, race, or religion.
Party | Seats | Gains | Losses | Net gain/loss | Seats % | Votes % | Votes | +/− | |
---|---|---|---|---|---|---|---|---|---|
Labour | 24 | 15 | 0 | +15 | 72.7 | 45.3 | 34,030 | +16.7% | |
Liberal Democrat | 6 | 0 | 7 | -7 | 18.2 | 25.6 | 19,234 | +0.3% | |
Independent | 3 | 0 | 7 | -7 | 9.1 | 15.9 | 11,982 | -11.8% | |
Conservative | 0 | 0 | 1 | -1 | 0 | 11.2 | 8,389 | -1.4% | |
Green | 0 | 0 | 0 | 0 | 0 | 0.9 | 672 | -1.1% | |
English Democrat | 0 | 0 | 0 | 0 | 0 | 0.8 | 600 | +0.7% | |
UKIP | 0 | 0 | 0 | 0 | 0 | 0.3 | 225 | -0.2% |
Party | Candidate | Votes | % | |
---|---|---|---|---|
Labour | Trevor Locke (E) | 1,281 | 30.3 | |
Labour | Lachlan Morrison (E) | 1,161 | 27.5 | |
Conservative | Benjamin Marshall | 763 | 18.1 | |
Conservative | Steven Sadler | 694 | 16.4 | |
Liberal Democrat | Adam Braddow | 184 | 4.4 | |
Liberal Democrat | Karen Day | 142 | 3.4 | |
Turnout | 4,225 | 40.4 | ||
Labour hold | ||||
Labour gain from Liberal Democrat | ||||
Party | Candidate | Votes | % | |
---|---|---|---|---|
Labour | Keir Morrison (E) | 928 | 22.8 | |
Labour | Dave Shaw (E) | 882 | 21.7 | |
Conservative | Trevor Peat | 690 | 17.0 | |
Conservative | Ian Smith | 616 | 15.2 | |
Independent | Richard Darrington | 403 | 9.9 | |
Independent | Robert Rankin | 309 | 7.6 | |
Liberal Democrat | Nicole Knight | 151 | 3.7 | |
Liberal Democrat | James Moore | 85 | 2.1 | |
Turnout | 4,064 | 36.7 | ||
Labour gain from Conservative | ||||
Labour hold |
Party | Candidate | Votes | % | |
---|---|---|---|---|
Labour | John Wilmott (E) | 1,075 | 25.1 | |
Labour | Ian Morrison (E) | 1,012 | 23.7 | |
Conservative | Robert Copley | 682 | 15.9 | |
Conservative | John Dymock | 643 | 15.0 | |
Independent | Bob Gow | 289 | 6.8 | |
UKIP | Ron Nixon | 225 | 5.3 | |
Green | Lisa-Jane Brown | 163 | 3.8 | |
Liberal Democrat | David Paylor | 101 | 2.4 | |
Liberal Democrat | Nicola Ellis | 90 | 2.1 | |
Turnout | 4,280 | 43.2 | ||
Labour hold | ||||
Labour gain from Conservative | ||||
Party | Candidate | Votes | % | |
---|---|---|---|---|
Labour | Chris Baron (E) | 1,277 | 16.0 | |
Labour | Ken Knight (E) | 1,198 | 15.0 | |
Labour | Jim Grundy (E) | 1,169 | 14.7 | |
Conservative | Kevin Rostance | 1,013 | 12.7 | |
Conservative | Mick Murphy | 918 | 11.5 | |
Conservative | Anthony Arnold | 795 | 10.0 | |
Liberal Democrat | Harry Toseland | 450 | 5.7 | |
Liberal Democrat | Jean Toseland | 420 | 5.3 | |
Liberal Democrat | Kenneth Cotham | 373 | 4.7 | |
Independent | Alan Davies | 351 | 4.4 | |
Turnout | 7,964 | 39.3 | ||
Labour gain from Liberal Democrat | ||||
Party | Candidate | Votes | % | |
---|---|---|---|---|
Labour | Liz Mays (E) | 412 | 41.4 | |
Liberal Democrat | Benjamin Rathe | 329 | 33.0 | |
Selston Area Independents Putting People First | Diane Butler | 255 | 25.6 | |
Turnout | 996 | 39.9 | ||
Labour hold |
Party | Candidate | Votes | % | |
---|---|---|---|---|
Labour | Cheryl Butler (E) | 1,101 | 24.1 | |
Liberal Democrat | Rachel Madden (E) | 972 | 21.3 | |
Labour | Adam Mohammed | 932 | 20.4 | |
Liberal Democrat | Austin Rathe | 763 | 16.7 | |
Independent | Tony Brown | 370 | 8.1 | |
Independent | Terry Coleman | 163 | 3.6 | |
Green | Mark Harrison | 134 | 2.9 | |
Green | David Lowe | 128 | 2.8 | |
Turnout | 4,563 | 47.0 | ||
Labour gain from Independent | ||||
Liberal Democrat hold |
Party | Candidate | Votes | % | |
---|---|---|---|---|
Labour | Linford Gibbons (E) | 661 | 22.0 | |
Labour | Warren Nuttall (E) | 626 | 20.8 | |
Independent | Wendy Harvey | 538 | 17.9 | |
Independent | Pat Simms | 414 | 13.8 | |
Liberal Democrat | Linda Mullaney | 407 | 13.5 | |
Liberal Democrat | Rebecca Mullaney | 361 | 12.0 | |
Turnout | 3,007 | 34.5 | ||
Labour gain from Independent | ||||
Labour hold |
Party | Candidate | Votes | % | |
---|---|---|---|---|
Labour | John Knight (E) | 901 | 27.9 | |
Labour | Andrew Davidson (E) | 781 | 24.2 | |
Independent | John Baird | 712 | 22.1 | |
Independent | Karen Black | 442 | 13.7 | |
Liberal Democrat | Sadie Kime | 200 | 6.2 | |
Liberal Democrat | Kelly Hurst | 197 | 6.1 | |
Turnout | 3,233 | 35.3 | ||
Labour hold | ||||
Labour gain from Independent | ||||
Party | Candidate | Votes | % | |
---|---|---|---|---|
Selston Area Independents Putting People First | Gail Turner (E) | 1,678 | 41.1 | |
Selston Area Independents Putting People First | Sam Wilson (E) | 1,463 | 35.8 | |
Labour | Natalie Fleet | 380 | 9.3 | |
Labour | Pete Spencer | 347 | 8.5 | |
Liberal Democrat | Richard Zadrozny | 124 | 3.0 | |
Liberal Democrat | Nicola Gunton-Day | 95 | 2.3 | |
Turnout | 4,087 | 43.3 | ||
Independent hold | ||||
Independent hold |
Party | Candidate | Votes | % | |
---|---|---|---|---|
Labour | Mick Coppin (E) | 1,583 | 22.0 | |
Labour | Tim Brown (E) | 1,425 | 19.8 | |
Labour | David Kirkham (E) | 1,281 | 17.8 | |
Liberal Democrat | Michelle Gent | 831 | 11.5 | |
Liberal Democrat | Kirsty Evans | 805 | 11.2 | |
Liberal Democrat | Trevor Gent | 705 | 9.8 | |
Independent | Dale Gratton | 583 | 8.1 | |
Turnout | 7,213 | 34.7 | ||
Labour hold | ||||
Labour hold | ||||
Labour hold |
Party | Candidate | Votes | % | |
---|---|---|---|---|
Labour | Steven Carroll (E) | 1,443 | 17.0 | |
Labour | May Barsby (E) | 1,335 | 16.1 | |
Labour | Kier Barsby (E) | 1,275 | 15.4 | |
Liberal Democrat | Craig Day | 981 | 11.8 | |
Liberal Democrat | Christine Wakefield | 934 | 11.3 | |
Liberal Democrat | James Gibson | 928 | 11.2 | |
The Sutton Independent Group | Mick Parker | 722 | 8.7 | |
Independent | Tony Wallis | 667 | 8.1 | |
Turnout | 8,285 | 36.3 | ||
Labour gain from Independent | ||||
Labour hold | ||||
Labour gain from Independent | ||||
Party | Candidate | Votes | % | |
---|---|---|---|---|
Liberal Democrat | Jason Zadrozny (E) | 1,574 | 17.1 | |
Liberal Democrat | Ann Patrick (E) | 1,398 | 15.2 | |
Liberal Democrat | Thomas Hollis (E) | 1,377 | 15.0 | |
Labour | Scott Darrington | 1,303 | 14.2 | |
Labour | Trish Phillips | 1,214 | 13.2 | |
Labour | Kevin Ball | 1,184 | 12.9 | |
Conservative | John Baker | 478 | 5.2 | |
Conservative | Sylvia Baker | 433 | 4.7 | |
Green | Fiona Keen | 247 | 2.7 | |
Turnout | 9,208 | 41.6 | ||
Liberal Democrat hold | ||||
Liberal Democrat hold |
Party | Candidate | Votes | % | |
---|---|---|---|---|
Labour | Glenys Maxwell (E) | 1,215 | 14.5 | |
Labour | Terry Keetley (E) | 1,197 | 14.3 | |
Independent | Ray Buttery (E) | 1,167 | 13.9 | |
Labour | Paul Roberts | 1,120 | 13.4 | |
Liberal Democrat | Fiona Asbury | 788 | 9.4 | |
Conservative | Paul Saxelby | 664 | 7.9 | |
Independent | Anna Wilson | 645 | 7.7 | |
Independent | Mark Beagley | 560 | 6.7 | |
Liberal Democrat | Scott Asbury | 551 | 6.6 | |
Liberal Democrat | Sam Hayward-Vernon | 483 | 5.8 | |
Turnout | 8,390 | 37.3 | ||
Labour gain from Independent | ||||
Labour gain from Liberal Democrat | ||||
Independent hold |
Party | Candidate | Votes | % | |
---|---|---|---|---|
Liberal Democrat | Robert Sears-Piccavey | 497 | 48.3 | |
Labour | Steve Mays | 282 | 27.4 | |
Selston Area Independents Putting People First | Bob Green | 251 | 24.4 | |
Turnout | 1,030 | 44.6 | ||
Liberal Democrat hold |
Party | Candidate | Votes | % | |
---|---|---|---|---|
Labour | Don Davis (E) | 1,081 | 23.6 | |
Liberal Democrat | Helen Smith (E) | 995 | 21.7 | |
Labour | Charlotte Watson | 968 | 21.1 | |
Liberal Democrat | Tony Theaker | 943 | 20.6 | |
English Democrat | Tony Ellis | 371 | 8.1 | |
English Democrat | Carole Terzza | 229 | 5.0 | |
Turnout | 4,587 | 42.4 | ||
Labour gain from Liberal Democrat | ||||
Liberal Democrat hold |
The 1999 Craven District Council election took place on 6 May 1999 to elect members of Craven District Council in North Yorkshire, England. One third of the council was up for election and the Conservative party gained overall control of the council from no overall control.
The 2008 Tandridge District Council election took place on 1 May 2008 to elect members of Tandridge District Council in Surrey, England. One third of the council was up for election and the Conservative party stayed in overall control of the council.
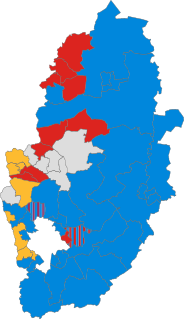
Elections to Nottinghamshire County Council took place on 4 June 2009, having been delayed from 7 May, in order to coincide with elections to the European Parliament.
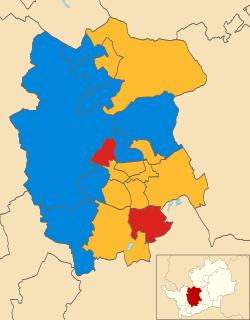
The 2006 St Albans City and District Council election took place on 4 May 2006 to elect members of St Albans District Council in Hertfordshire, England. One third of the council was up for election and the Liberal Democrats gained overall control of the council from no overall control.
The 1999 Pendle Borough Council election took place on 6 May 1999 to elect members of Pendle Borough Council in Lancashire, England. One third of the council was up for election and the Liberal Democrats lost overall control of the council to no overall control.
The 2007 Pendle Borough Council election took place on 3 May 2007 to elect members of Pendle Borough Council in Lancashire, England. One third of the council was up for election and the Liberal Democrats stayed in overall control of the council.
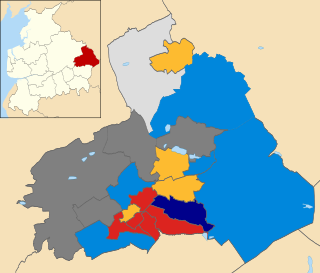
The 2008 Pendle Borough Council election took place on 1 May 2008 to elect members of Pendle Borough Council in Lancashire, England. One third of the council was up for election and the Liberal Democrats lost overall control of the council to no overall control.
The 1999 Sandwell Metropolitan Borough Council election took place on 6 May 1999 to elect members of Sandwell Metropolitan Borough Council in the West Midlands, England. One third of the council was up for election and the Labour party stayed in overall control of the council.
The 2006 Maidstone Borough Council election took place on 4 May 2006 to elect members of Maidstone Borough Council in Kent, England. One third of the council was up for election and the council stayed under no overall control.
The 2011 Swindon Borough Council election took place on 5 May 2011 to elect members of Swindon Unitary Council in Wiltshire, England. One third of the council was up for election and the Conservative party stayed in overall control of the council.
The 2011 Wealden District Council election took place on 5 May 2011 to elect members of Wealden District Council in East Sussex, England. The whole council was up for election and the Conservative party stayed in overall control of the council.
The 2012 St Albans City and District Council election took place on 3 May 2012 to elect members of St Albans District Council in Hertfordshire, England. One third of the council was up for election and the council stayed under no overall control.
The 2011 Huntingdonshire District Council election took place on 5 May 2011 to elect members of Huntingdonshire District Council in Cambridgeshire, England. One third of the council was up for election and the Conservative party stayed in overall control of the council.
The 2012 Harlow District Council election took place on 3 May 2012 to elect members of Harlow District Council in Essex, England. One third of the council was up for election and the Labour party gained overall control of the council from the Conservative party.
The 2015 Ashfield District Council election took place on 7 May 2015, to elect members of Ashfield District Council in England. This was on the same day as other local elections.
The 1999 Wychavon District Council election took place on 6 May 1999 to elect members of Wychavon District Council in Worcestershire, England. The whole council was up for election and the Conservative party gained overall control of the council from no overall control.
The 2003 South Kesteven District Council election took place on 1 May 2003 to elect members of South Kesteven District Council in Lincolnshire, England. The whole council was up for election and the Conservative party gained control of the council from no overall control.
The 2003 West Oxfordshire District Council election took place on 1 May 2003 to elect members of West Oxfordshire District Council in Oxfordshire, England. One third of the council was up for election and the Conservative party stayed in overall control of the council.
The 2011 West Oxfordshire District Council election took place on 5 May 2011 to elect members of West Oxfordshire District Council in Oxfordshire, England. One third of the council was up for election and the Conservative party stayed in overall control of the council.