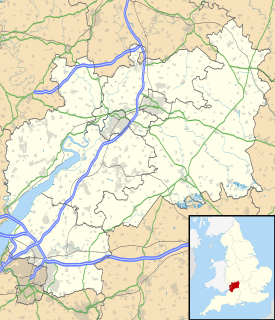
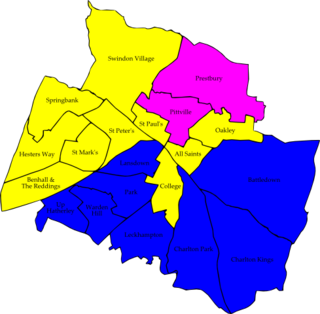
The 2010 Cheltenham Council election took place on 6 May 2010 to elect members of Cheltenham Borough Council in Gloucestershire, England. Half of the council was up for election and the Liberal Democrats stayed in overall control of the council. [1]
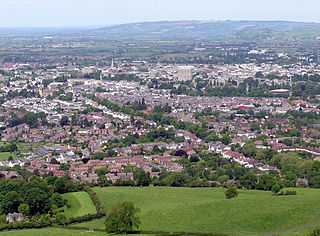
Cheltenham is a regency spa town and borough on the edge of the Cotswolds in Gloucestershire, England. Cheltenham has been a health and holiday spa town resort since the discovery of mineral springs in 1716 and has a number of internationally renowned and historic schools.
Borough status in the United Kingdom is granted by royal charter to local government districts in England, Wales and Northern Ireland. The status is purely honorary, and does not give any additional powers to the council or inhabitants of the district. In Scotland, similarly chartered communities were known as royal burghs, although the status is no longer granted.
Gloucestershire is a county in South West England. The county comprises part of the Cotswold Hills, part of the flat fertile valley of the River Severn, and the entire Forest of Dean.
After the election, the composition of the council was
The Liberal Democrats are a liberal political party in the United Kingdom. They presently have 11 Members of Parliament in the House of Commons, 96 members of the House of Lords, and one member of the European Parliament. They also have five Members of the Scottish Parliament and a member each in the Welsh Assembly and London Assembly. The party reached the height of its influence in the early 2010s, forming a junior partner in a coalition government from 2010 to 2015. It is presently led by Vince Cable.
The Conservative Party, officially the Conservative and Unionist Party, is a centre-right political party in the United Kingdom. Presently led by Theresa May, it has been the governing party since 2010. It presently has 314 Members of Parliament in the House of Commons, 249 members of the House of Lords, and 18 members of the European Parliament. It also has 31 Members of the Scottish Parliament, 12 members of the Welsh Assembly, eight members of the London Assembly and 9,008 local councillors. One of the major parties of UK politics, it has formed the government on 45 occasions, more than any other party.
People Against Bureaucracy (PAB) is a minor political party in Cheltenham, Gloucestershire. It was founded in 1976 to elect councillors to Tewkesbury Borough Council, later representing the same areas at Cheltenham Borough Council following council boundary changes. It describes itself as being opposed to 'party political' politics, and supportive of measures to make local government more transparent.
In total 64 candidates stood in the election for the 22 seats that were being contested. [3] Among those defending seats were 2 Liberal Democrat cabinet members, the Conservative group leader Stuart Hutton and 2 People Against Bureaucracy councillors. [3] Other candidates included 12 from the Green Party, a record high for the party in Cheltenham. [3]
A Councillor is a member of a local government council.
The Green Party of England and Wales is a green, left-wing political party in England and Wales. Headquartered in London, since September 2018, its co-leaders are Siân Berry and Jonathan Bartley. The Green Party has one representative in the House of Commons, one in the House of Lords, and three in the European Parliament. In addition, it has various councillors in UK local government and two members of the London Assembly.
The results saw the Liberal Democrats increase their majority on the council after gaining 4 seats from the Conservatives. [4] Among the Conservative defeats to the Liberal Democrats was the Conservative group leader Stuart Hutton in Warden Hill ward [5] and Conservative councillor David Hall who was defeated in Up Hatherley by 1 vote. [6] The Liberal Democrat gains meant they held 25 seats after the election, as against 12 for the Conservatives and 3 People Against Bureaucracy councillors. [4]
Up Hatherley is a civil parish and a suburb of the spa town of Cheltenham, Gloucestershire, England. Formerly a hamlet in the parish of Shurdington, it became a parish in 1887 and became a part of Cheltenham in 1991.
Party | Seats | Gains | Losses | Net gain/loss | Seats % | Votes % | Votes | +/− | |
---|---|---|---|---|---|---|---|---|---|
Liberal Democrat | 16 | 4 | 0 | +4 | 72.7 | 51.1 | 32,084 | +6.2% | |
Conservative | 4 | 0 | 4 | -4 | 18.2 | 38.5 | 24,142 | -7.3% | |
People Against Bureaucracy Group | 2 | 0 | 0 | 0 | 9.1 | 4.4 | 2,769 | -1.3% | |
Green | 0 | 0 | 0 | 0 | 0 | 3.6 | 2,278 | +2.9% | |
Labour | 0 | 0 | 0 | 0 | 0 | 2.3 | 1,456 | -0.6% |
Party | Candidate | Votes | % | ± | |
---|---|---|---|---|---|
Liberal Democrat | Charles Stewart | 1,420 | 52.4 | -6.7 | |
Conservative | Peter Christensen | 937 | 34.6 | +1.0 | |
Labour | Diana Hale | 190 | 7.0 | +4.1 | |
Green | Ian Lander | 164 | 6.0 | +1.6 | |
Majority | 483 | 17.8 | -7.7 | ||
Turnout | 2,711 | 63.8 | +31.9 | ||
Liberal Democrat hold | Swing |
Party | Candidate | Votes | % | ± | |
---|---|---|---|---|---|
Conservative | Paul McLain | 1,563 | 52.1 | -14.6 | |
Liberal Democrat | Paul McCloskey | 1,438 | 47.9 | +18.8 | |
Majority | 125 | 4.2 | -33.4 | ||
Turnout | 3,001 | 73.6 | +32.2 | ||
Conservative hold | Swing |
Party | Candidate | Votes | % | ± | |
---|---|---|---|---|---|
Liberal Democrat | Nigel Britter | 1,701 | 54.9 | +5.6 | |
Conservative | Chris Mason | 1,241 | 40.1 | -10.6 | |
Green | Birgit Whitman | 155 | 5.0 | +5.0 | |
Majority | 460 | 14.9 | |||
Turnout | 3,097 | 75.9 | +29.8 | ||
Liberal Democrat hold | Swing |
Party | Candidate | Votes | % | ± | |
---|---|---|---|---|---|
Liberal Democrat | Helena McCloskey | 1,611 | 47.8 | +0.4 | |
Conservative | Chris Ryder | 1,537 | 45.6 | -3.4 | |
Green | Sarah Field | 222 | 6.6 | +6.6 | |
Majority | 74 | 2.2 | |||
Turnout | 3,370 | 78.6 | +32.6 | ||
Liberal Democrat gain from Conservative | Swing | ||||
Party | Candidate | Votes | % | ± | |
---|---|---|---|---|---|
Conservative | Penny Hall | 1,641 | 52.0 | -15.9 | |
Liberal Democrat | Paul Baker | 1,512 | 48.0 | +15.9 | |
Majority | 129 | 4.1 | -31.7 | ||
Turnout | 3,153 | 78.3 | +31.3 | ||
Conservative hold | Swing |
Party | Candidate | Votes | % | ± | |
---|---|---|---|---|---|
Liberal Democrat | Garth Barnes | 1,664 | 54.3 | -4.7 | |
Conservative | Charlie Perkins | 1,175 | 38.4 | -2.6 | |
Green | Victoria Angelo-Thomson | 223 | 7.3 | +7.3 | |
Majority | 489 | 16.0 | -2.1 | ||
Turnout | 3,062 | 70.2 | +30.7 | ||
Liberal Democrat hold | Swing |
Party | Candidate | Votes | % | ± | |
---|---|---|---|---|---|
Liberal Democrat | Simon Wheeler | 1,767 | 68.1 | +3.0 | |
Conservative | Richard East | 829 | 31.9 | +2.6 | |
Majority | 938 | 36.1 | +0.3 | ||
Turnout | 2,596 | 51.8 | +27.5 | ||
Liberal Democrat hold | Swing |
Party | Candidate | Votes | % | ± | |
---|---|---|---|---|---|
Conservative | Barbara Driver | 1,361 | 49.5 | -9.8 | |
Liberal Democrat | Leone Meyer | 1,186 | 43.1 | +9.6 | |
Green | John Heywood | 205 | 7.4 | +7.4 | |
Majority | 175 | 6.4 | -19.5 | ||
Turnout | 2,752 | 60.2 | +32.0 | ||
Conservative hold | Swing |
Party | Candidate | Votes | % | ± | |
---|---|---|---|---|---|
Liberal Democrat | Ian Bickerton | 1,639 | 48.8 | +4.8 | |
Conservative | Tim Harman | 1,506 | 44.8 | -11.2 | |
Green | Timothy Bonsor | 216 | 6.4 | +6.4 | |
Majority | 133 | 4.0 | |||
Turnout | 3,361 | 81.4 | +28.5 | ||
Liberal Democrat gain from Conservative | Swing | ||||
Party | Candidate | Votes | % | ± | |
---|---|---|---|---|---|
Liberal Democrat | Colin Hay | 1,174 | |||
Liberal Democrat | Rowena Hay | 1,066 | |||
Conservative | Mireille Weller | 646 | |||
Conservative | Nathan Weller | 583 | |||
Labour | Brian Hughes | 294 | |||
Labour | Clive Harriss | 282 | |||
Turnout | 4,045 | 53.5 | +23.4 | ||
Liberal Democrat hold | Swing | ||||
Liberal Democrat hold | Swing |
Party | Candidate | Votes | % | ± | |
---|---|---|---|---|---|
Conservative | Rob Garnham | 1,917 | 51.0 | -16.7 | |
Liberal Democrat | Alexis Cassin | 1,585 | 42.2 | +9.9 | |
Green | Jon Stubbings | 257 | 6.8 | +6.8 | |
Majority | 332 | 8.8 | -26.6 | ||
Turnout | 3,759 | 71.9 | +35.1 | ||
Conservative hold | Swing |
Party | Candidate | Votes | % | ± | |
---|---|---|---|---|---|
People Against Bureaucracy Group | Diane Hibbert | 971 | 32.9 | +13.2 | |
Liberal Democrat | John Oates | 966 | 32.7 | -0.8 | |
Conservative | Geraldine Beaty | 863 | 29.2 | -9.5 | |
Green | Cathy Green | 151 | 5.1 | +1.1 | |
Majority | 5 | 0.2 | |||
Turnout | 2,951 | 69.0 | +31.3 | ||
Independent hold | Swing |
Party | Candidate | Votes | % | ± | |
---|---|---|---|---|---|
People Against Bureaucracy Group | Les Godwin | 1,798 | 53.0 | -2.1 | |
Conservative | Terence Derry | 842 | 24.8 | -2.2 | |
Liberal Democrat | Heiman Chan | 754 | 22.2 | +9.5 | |
Majority | 956 | 28.2 | +0.2 | ||
Turnout | 3,394 | 73.5 | +31.8 | ||
Independent hold | Swing |
Party | Candidate | Votes | % | ± | |
---|---|---|---|---|---|
Liberal Democrat | Peter Jeffries | 1,688 | |||
Liberal Democrat | John Morris | 1,626 | |||
Conservative | Helen Smith | 746 | |||
Conservative | Leon Mekitarian | 729 | |||
Turnout | 4,789 | 54.3 | +31.2 | ||
Liberal Democrat hold | Swing | ||||
Liberal Democrat hold | Swing |
Party | Candidate | Votes | % | ± | |
---|---|---|---|---|---|
Liberal Democrat | Sandra Holliday | 1,517 | 55.3 | +5.0 | |
Conservative | Michael Bourne | 804 | 29.3 | -4.9 | |
Labour | Rod Gay | 290 | 10.6 | +1.9 | |
Green | Sherri Williams | 131 | 4.8 | -1.9 | |
Majority | 713 | 26.0 | -0.4 | ||
Turnout | 2,742 | 58.9 | +32.5 | ||
Liberal Democrat hold | Swing |
Party | Candidate | Votes | % | ± | |
---|---|---|---|---|---|
Liberal Democrat | Jon Walklett | 1,347 | 64.9 | -0.8 | |
Conservative | Greg Patton | 518 | 25.0 | -9.3 | |
Green | Adrian Becker | 210 | 10.1 | +10.1 | |
Majority | 829 | 40.0 | +8.5 | ||
Turnout | 2,075 | 44.1 | +28.1 | ||
Liberal Democrat hold | Swing |
Party | Candidate | Votes | % | ± | |
---|---|---|---|---|---|
Liberal Democrat | Pat Thornton | 1,685 | 60.1 | +2.2 | |
Conservative | Emma Logan | 847 | 30.2 | -4.9 | |
Labour | Robert Irons | 271 | 9.7 | +2.7 | |
Majority | 838 | 29.9 | +7.1 | ||
Turnout | 2,803 | 54.5 | +28.5 | ||
Liberal Democrat hold | Swing |
Party | Candidate | Votes | % | ± | |
---|---|---|---|---|---|
Liberal Democrat | Paul Massey | 1,728 | 65.1 | +7.7 | |
Conservative | John Hardman | 925 | 34.9 | +16.4 | |
Majority | 803 | 30.3 | -3.0 | ||
Turnout | 2,653 | 59.0 | +25.6 | ||
Liberal Democrat hold | Swing |
Party | Candidate | Votes | % | ± | |
---|---|---|---|---|---|
Liberal Democrat | Andrew McKinlay | 1,470 | 46.0 | -12.4 | |
Conservative | David Hall | 1,469 | 46.0 | +4.4 | |
Labour | Neville Mozley | 129 | 4.0 | +4.0 | |
Green | Matthew Hodgkinson | 125 | 3.9 | +3.9 | |
Majority | 1 | 0.0 | -16.9 | ||
Turnout | 3,193 | 76.6 | +31.6 | ||
Liberal Democrat gain from Conservative | Swing | ||||
Party | Candidate | Votes | % | ± | |
---|---|---|---|---|---|
Liberal Democrat | Josephine Teakle | 1,540 | 47.8 | +17.9 | |
Conservative | Stuart Hutton | 1,463 | 45.4 | -24.7 | |
Green | Adam Van Coevorden | 219 | 6.8 | +6.8 | |
Majority | 77 | 2.4 | |||
Turnout | 3,222 | 73.1 | +33.4 | ||
Liberal Democrat gain from Conservative | Swing | ||||
The 2006 Southend-on-Sea Council election took place on 4 May 2006 to elect members of Southend-on-Sea Unitary Council in Essex, England. One third of the council was up for election and the Conservative party stayed in overall control of the council.
The 1998 Cheltenham Council election took place on 7 May 1998 to elect members of Cheltenham Borough Council in Gloucestershire, England. One third of the council was up for election and the Liberal Democrats stayed in overall control of the council.
The 1999 Cheltenham Council election took place on 6 May 1999 to elect members of Cheltenham Borough Council in Gloucestershire, England. One third of the council was up for election and the Liberal Democrats lost overall control of the council to no overall control.
The 2000 Cheltenham Council election took place on 4 May 2000 to elect members of Cheltenham Borough Council in Gloucestershire, England. One third of the council was up for election and the Conservative party stayed in overall control of the council.
The 2002 Cheltenham Council election took place on 2 May 2002 to elect members of Cheltenham Borough Council in Gloucestershire, England. The whole council was up for election with boundary changes since the last election in 2000 reducing the number of seat by 1. The Liberal Democrats gained overall control of the council from the Conservative party.
The 2004 Cheltenham Council election took place on 10 June 2004 to elect members of Cheltenham Borough Council in Gloucestershire, England. Half of the council was up for election and the Liberal Democrats lost overall control of the council to no overall control.
The 2006 Cheltenham Council election took place on 4 May 2006 to elect members of Cheltenham Borough Council in Gloucestershire, England. Half of the council was up for election and the council stayed under no overall control.
The 2008 Cheltenham Council election took place on 1 May 2008 to elect members of Cheltenham Borough Council in Gloucestershire, England. Half of the council was up for election and the council stayed under no overall control.
The 2004 Fareham Council election took place on 10 June 2004 to elect members of Fareham Borough Council in Hampshire, England. Half of the council was up for election and the Conservative party stayed in overall control of the council.
The 2008 Fareham Council election took place on 1 May 2008 to elect members of Fareham Borough Council in Hampshire, England. Half of the council was up for election and the Conservative party stayed in overall control of the council.
The 2010 Fareham Council election took place on 6 May 2010 to elect members of Fareham Borough Council in Hampshire, England. Half of the council was up for election and the Conservative party stayed in overall control of the council.
The 2007 Sunderland Council election took place on 3 May 2007 to elect members of Sunderland Metropolitan Borough Council in Tyne and Wear, England. One third of the council was up for election and the Labour party stayed in overall control of the council.
The 2008 Sunderland Council election took place on 1 May 2008 to elect members of Sunderland Metropolitan Borough Council in Tyne and Wear, England. One third of the council was up for election and the Labour party stayed in overall control of the council.
The 2010 Sunderland Council election took place on 6 May 2010 to elect members of Sunderland Metropolitan Borough Council in Tyne and Wear, England. One third of the council was up for election and the Labour party stayed in overall control of the council. The election took place on the same day as the 2010 General Election.
The 2008 Stroud Council election took place on 1 May 2008 to elect members of Stroud District Council in Gloucestershire, England. One third of the council was up for election and the Conservative party stayed in overall control of the council.
The 2010 Woking Council election took place on 1 May 2010, on the same day as the 2010 general election, to elect members of Woking Borough Council in Surrey, England. One third of the council was up for election and the council stayed under no overall control.
The 2012 Cheltenham Council election took place on 3 May 2012 to elect members of Cheltenham Borough Council in Gloucestershire, England. Half of the council was up for election and the Liberal Democrats stayed in overall control of the council.
Elections to Gloucestershire County Council took place on 2 May 2013 as part of the United Kingdom local elections, 2013. 53 electoral divisions elected one county councillor each by first-past-the-post voting for a four-year term of office. No elections were held in South Gloucestershire, which is a unitary authority outside the area covered by the County Council.
The 2007 Christchurch Borough Council election took place on 3 May 2007 to elect members of Christchurch Borough Council in Dorset, England. The whole council was up for election and the Conservative party stayed in overall control of the council.