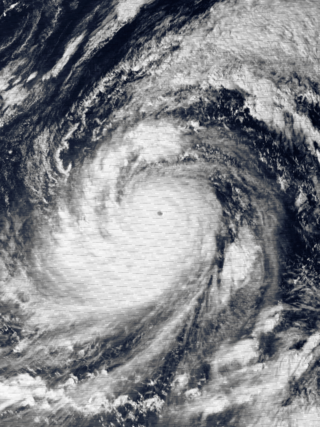
Columbus Day Storm of 1962

Last updated

and1962–63 North American winter
Columbus Day Storm of 1962
Typhoon Freda
Columbus Day Storm 1962-10-13 weather map.png
Surface Analysis of the storm near its peak intensity [1]

The Columbus Day Storm of 1962 (also known as the Big Blow, [2] and originally in Canada as Typhoon Freda) was a Pacific Northwest windstorm that struck the West Coast of Canada and the Pacific Northwest coast of the United States on October 12, 1962. Typhoon Freda was the twenty-eighth tropical depression, the twenty-third tropical storm, and the eighteenth typhoon of the 1962 Pacific typhoon season. Freda originated from a tropical disturbance over the Northwest Pacific on September 28. On October 3, the system strengthened into a tropical storm and was given the name Freda, before becoming a typhoon later that day, while moving northeastward. The storm quickly intensified, reaching its peak as a Category 3-equivalent typhoon on October 5, with maximum 1-minute sustained winds of 115 mph (185 km/h) and a minimum central pressure of 948 millibars (28.0 inHg). Freda maintained its intensity for another day, before beginning to gradually weaken, later on October 6. On October 9, Freda weakened into a tropical storm, before transitioning into an extratropical cyclone on the next day. On October 11, Freda turned eastward and accelerated across the North Pacific, before striking the Pacific Northwest on the next day. On October 13, the cyclone made landfall on Washington and Vancouver Island, and then curved northwestward. Afterward, the system moved into Canada and weakened, before being absorbed by another developing storm to the south on October 17.

Contents

The Columbus Day Storm of 1962 is considered to be the benchmark of extratropical wind storms. The storm ranks among the most intense to strike the region since at least 1948, likely since the January 9, 1880 "Great Gale" and snowstorm. The storm is a contender for the title of the most powerful extratropical cyclone recorded in the U.S. in the 20th century; with respect to wind velocity, it is unmatched by the March 1993 "Storm of the Century" and the "1991 Halloween Nor'easter" ("The Perfect Storm"). The system brought strong winds to the Pacific Northwest and southwest Canada, and was linked to 46 fatalities in the northwest and Northern California resulting from heavy rains and mudslides.

Meteorological history

Storm trajectory compared to two other important storms hitting the Pacific Northwest in 1981 and 1995 Storm2.gif
Storm trajectory compared to two other important storms hitting the Pacific Northwest in 1981 and 1995
Map plotting the storm's track and intensity, according to the Saffir-Simpson scale

.mw-parser-output .hidden-begin{box-sizing:border-box;width:100%;padding:5px;border:none;font-size:95%}.mw-parser-output .hidden-title{font-weight:bold;line-height:1.6;text-align:left}.mw-parser-output .hidden-content{text-align:left}
Map key
Saffir-Simpson scale
.mw-parser-output .div-col{margin-top:0.3em;column-width:30em}.mw-parser-output .div-col-small{font-size:90%}.mw-parser-output .div-col-rules{column-rule:1px solid #aaa}.mw-parser-output .div-col dl,.mw-parser-output .div-col ol,.mw-parser-output .div-col ul{margin-top:0}.mw-parser-output .div-col li,.mw-parser-output .div-col dd{page-break-inside:avoid;break-inside:avoid-column}
.mw-parser-output .legend{page-break-inside:avoid;break-inside:avoid-column}.mw-parser-output .legend-color{display:inline-block;min-width:1.25em;height:1.25em;line-height:1.25;margin:1px 0;text-align:center;border:1px solid black;background-color:transparent;color:black}.mw-parser-output .legend-text{}
Tropical depression (<=38 mph, <=62 km/h)

Tropical storm (39-73 mph, 63-118 km/h)

Category 1 (74-95 mph, 119-153 km/h)

Category 2 (96-110 mph, 154-177 km/h)

Category 3 (111-129 mph, 178-208 km/h)

Category 4 (130-156 mph, 209-251 km/h)

Category 5 (>=157 mph, >=252 km/h)

Unknown
Storm type
Tropical cyclone
Subtropical cyclone
Extratropical cyclone, remnant low, tropical disturbance, or monsoon depression Freda 1962 track.png
Map plotting the storm's track and intensity, according to the Saffir–Simpson scale
Map key
  Tropical depression (≤38 mph, ≤62 km/h)
  Tropical storm (39–73 mph, 63–118 km/h)
  Category 1 (74–95 mph, 119–153 km/h)
  Category 2 (96–110 mph, 154–177 km/h)
  Category 3 (111–129 mph, 178–208 km/h)
  Category 4 (130–156 mph, 209–251 km/h)
  Category 5 (≥157 mph, ≥252 km/h)
  Unknown
Storm type
ArrowUp.svg Extratropical cyclone, remnant low, tropical disturbance, or monsoon depression

On the morning of September 28, a tropical disturbance formed south of the island of Eniwetok Atoll. After moving westward and making a large bend around the island, the new system slowly gained strength, and on the morning of October 3, the system became a tropical storm about 500 miles (800 km) from Wake Island, over the central Pacific Ocean. [3] Now named Freda, the system rapidly intensified as it proceeded northeastward over the open Pacific waters. On that afternoon, Freda intensified into a typhoon, with 1-minute sustained winds of 80 mph (130 km/h). On October 4, the typhoon quickly intensified, reaching its peak of 115 mph (185 km/h) on the next day, with a minimum central pressure of 948 millibars (27.99 inHg), making the storm the equivalent of a Category 3 typhoon on the Saffir–Simpson scale. After stabilizing to the north, Freda maintained its strength through the Pacific, before beginning to weaken slowly on October 6. Making a turn to the northeast, Freda maintained typhoon-status winds for several more days, before weakening into a tropical storm on October 9, as it started experiencing the effects of cold air. [4]

Moving northeastward at a steady rate of 16 mph (26 km/h), the storm slowly underwent an extratropical transition, becoming extratropical operationally on the morning of October 10, still with winds of 45 mph (65 km/h). [4] The system became an extratropical cyclone as it moved into colder waters and interacted with the jet stream. However, post-season analysis concluded that the system continued weakening as it continued northeastward, crossing the 180th meridian later that afternoon, before completing the transition that evening. [5]

The extratropical low redeveloped intensely off the coast of Northern California, due to favorable upper-level conditions, producing record rainfall across the San Francisco Bay Area that delayed some games in the 1962 World Series between the San Francisco Giants and the New York Yankees. The low moved northeastward, and then hooked straight north, as it neared southwest Oregon. The storm then raced nearly northward at an average speed of 40 miles per hour (64 km/h), with the center situated just 50 miles (80 km) off the Pacific Coast. There was little central pressure change until the cyclone passed the latitude of Astoria, Oregon, at which time the low began to degrade. On October 13, the center passed over Tatoosh Island, Washington, before making landfall on Vancouver Island, British Columbia, where it weakened rapidly. The cyclone then curved northwestward, before turning back eastward and moving into Canada. As the cyclone moved through Canada, another cyclone formed on its southern periphery, which absorbed the original cyclone by October 17. [6]

The extratropical cyclone deepened to a minimum central pressure of at least 960 hPa (28 inHg), and perhaps as low as 958 hPa (28.3 inHg), a pressure which would be equivalent to a Category 3 hurricane on the Saffir–Simpson hurricane scale (SSHS). Since the system was an extratropical cyclone, its wind field was neither as compact nor as strong as a tropical cyclone, though its wind field was significantly larger. All-time record-low land-based pressures (up to 1962) included 969.2 hPa (28.62 inHg) at Astoria, 970.5 hPa (28.66 inHg) at Hoquiam, Washington, and 971.9 hPa (28.70 inHg) at North Bend, Oregon. The Astoria and Hoquiam records were broken by a major storm on December 12, 1995 (which measured 966.1 hPa (28.53 inHg) at Astoria); however, this event did not generate winds as intense as the Columbus Day Storm of 1962.

Wind speed highlights

Most of these peak gusts were taken at official stations ColumbusDayStormPeakGustMap.jpg
Most of these peak gusts were taken at official stations

The peak winds were felt as the storm passed close by on October 12. At Cape Blanco on the southern Oregon coast, an anemometer that lost one of its cups registered wind gusts in excess of 145 miles per hour (233 kilometers per hour); some reports put the peak velocity at 179 mph (288 km/h). The north Oregon coast Mt. Hebo radar station reported winds of 170 mph (270 km/h). [8]

At the Naselle Radar Station in the Willapa Hills of southwest Washington, a wind gust of 160 mph (260 km/h) was observed. [7]

In Salem, Oregon, a wind gust of 90 mph (140 km/h) was observed. [7]

At Corvallis, Oregon, an inland location in the Willamette Valley, one-minute average winds reached 69 miles per hour (111 km/h), with a gust to 127 mph (204 km/h), before the station was abandoned due to "power failure and instruments demolished". Observations at the weather station resumed the next day. [7]

About 80 miles (130 km) to the north, at Portland, Oregon's major metropolitan area, measured wind gusts reached 116 mph (187 km/h) at the Morrison Street Bridge in downtown Portland.

In Vancouver, Washington around 9 miles north of downtown Portland, a peak gust of 92 mph (148 km/h) was observed at Pearson Field.

Many anemometers, official and unofficial, within the heavily stricken area of northwestern Oregon and southwest Washington were damaged or destroyed before winds attained maximum velocity. For example, the wind gauge atop the downtown Portland studios of KGW radio and TV recorded two gusts of 93 mph (150 km/h), just before flying debris knocked the gauge off-line [9] shortly after 5 p.m.

For the Willamette Valley, the lowest peak gust officially measured was 86 mph (138 km/h) at Eugene. This value, however, is higher than the maximum peak gust generated by any other Willamette Valley windstorm in the 1948–2010 period.

In the interior of western Washington, officially measured wind gusts included 78 miles per hour (126 km/h) at Olympia, 88 mph (142 km/h) at McChord Air Force Base, 100 mph (160 km/h) at Renton at 64 feet (20 m) and 98 mph (158 km/h) at Bellingham. In the city of Seattle, a peak wind speed of 65 mph (105 km/h) was recorded; this suggests gusts of at least 80 mph (130 km/h). Damaging winds reached as far inland as Spokane.

Wind gusts of 58 mph (93 km/h), the National Weather Service minimum for "High Wind Criteria," or higher were reported from San Francisco, to Vancouver, British Columbia.

Impact

At least 46 fatalities were attributed to this storm, more than for any other Pacific Northwest weather event. [10] Injuries went into the hundreds. In terms of natural disaster-related fatalities for the 20th century, only Oregon's Heppner Flood of 1903 (247 deaths), Washington's Wellington avalanche of 1910 (96 deaths), the Great Fire of 1910 (87 deaths), and Eruption of Mount St. Helens of 1980 (57 deaths) caused more. For Pacific Northwest windstorms in the 20th century, the runner up was the infamous October 21, 1934, gale, which caused 22 fatalities, mostly in Washington.

In less than 12 hours, more than 11 billion board feet (26,000,000 m3) of timber was blown down in northern California, Oregon and Washington combined; some estimates put it at 15 billion board feet (35,000,000 m3). This exceeded the annual timber harvest for Oregon and Washington at the time. This value is above any blowdown measured for East Coast storms, including hurricanes; even the often-cited 1938 New England hurricane, which toppled 2.65 billion board feet (6,300,000 m3), falls short by nearly an order of magnitude.

Estimates put the dollar damage at approximately $230 million to $280 million for California, Oregon, and Washington combined. Those figures in 1962 US dollars translate to $1.8 to $2.2 billion in 2014 US dollars. Oregon's share exceeded $200 million in 1962 US dollars. This is comparable to land-falling hurricanes that occurred within the same time frame (for example, Audrey, Donna, and Carla from 1957 to 1961). [11]

The Metropolitan Life Insurance Co. (now MetLife) named the Columbus Day Storm the nation's worst natural disaster of 1962. [12]

California

In Central and Northern California, all-time record rains associated with the atmospheric river along the cold front caused major flooding and mudslides, particularly in the San Francisco Bay Area. Oakland set an all time calendar day record with 4.52 inches (115 mm) of rain on the 13th, as did Sacramento with 3.77 inches (96 mm). More than 7 inches (180 mm) of rainfall were recorded in the Bay area. [13]

Heavy rain forced Game 6 of the 1962 World Series at San Francisco's Candlestick Park to be postponed from its originally scheduled date of October 11 to Monday, October 15.

Oregon

Damage in Newberg, Oregon Columbus Day Storm 1962.jpg
Damage in Newberg, Oregon

In the Willamette Valley, it is said the undamaged home was the exception. Livestock suffered greatly due to the barn failures: the animals were crushed under the weight of the collapsed structures, a story that was repeated many times throughout the afflicted region. At the north end of the Valley, two 500-foot (150 m) high voltage transmission towers were toppled.

Radio and TV broadcasting were affected in the Portland area. KGW-TV lost its tower at Skyline and replaced the temporary tower with a new one on January 28, 1963. KOIN radio lost one of two AM towers at Sylvan. KPOJ-AM/-FM lost much of its transmitting equipment, plus one of two towers was left partially standing at Mount Scott. KPOJ-FM was so badly damaged it wouldn't return to the air until February 9, 1963. KWJJ-AM lost one of its towers and a portion of its transmitter building at Smith Lake. KISN-AM also lost a tower at Smith Lake. Seven-month-old TV station KATU did not receive any damage at its Livingston Mountain site, 6 miles (9.7 km) north of Camas, Washington. However, KATU didn't have a generator and power was cut off. The heavy-duty design of the radio towers on Portland's West Hills today, with extensive and robust guy cables, is a direct result of the lessons learned from the 1962 catastrophe.

For northwest Oregon, the entire power distribution system had to be rebuilt from the ground up. Some locations did not have power restored for several weeks. [10] This storm became a lasting memory for local power distributors. Indeed, a number of high wind related studies appeared in the years after the storm in an attempt to assess the return frequency of such potentially damaging winds.

The state capitol grounds at Salem, and the state's college campuses, resembled battlefields with heavy losses of trees.

The Campbell Hall tower at Oregon College of Education (now Western Oregon University) in Monmouth crashed to the ground, [14] an event recorded by student photographer Wes Luchau in the most prominent picture-symbol of the storm.

East of Salem, the wind destroyed a historic barn that served as a clandestine meeting place by pro-slavery Democratic members of the state Legislature in 1860.[ citation needed ]

The Oregon State BeaversWashington Huskies college football game went on as scheduled Saturday, October 13 in Portland, in a heavily damaged Multnomah Stadium. Much of the roof was damaged and seats damaged by falling debris were replaced by portable chairs. [15] Crews cleared debris from the grandstand and playing field right up to kickoff. [15] Most of the electricity, including the scoreboard and clock, was still out and players dressed by candlelight in the locker rooms. [16] The Huskies came from behind to beat the Beavers 14–13, despite a strong performance by quarterback Terry Baker, who would win the Heisman Trophy later that year. [16] [17]

British Columbia

The storm weakened as it traveled north into British Columbia, with peak gusts measured at 90 miles per hour (140 km/h). [18] Five people in British Columbia were killed in the storm, [19] and the area suffered $80 million in damages. [20] Stanley Park lost 3,000 trees. A Victoria resident described it as "Just general devastation everywhere you went. There were trees breaking off and flying across the roads. "Wind was just blowing the rain horizontal and trees were weaving all over the place. You didn't know if you were going to get hit or not." [21] At Victoria airport, a Martin Mars waterbomber ("Caroline Mars") was hurled 200 yards (180 m) and irreparably damaged. [22]

See also

Related Research Articles

<span class="mw-page-title-main">Typhoon Tip</span> Pacific typhoon in 1979

Typhoon Tip, known in the Philippines as Typhoon Warling, was the largest and most intense tropical cyclone ever recorded. The forty-third tropical depression, nineteenth tropical storm, twelfth typhoon, and third super typhoon of the 1979 Pacific typhoon season, Tip developed out of a disturbance within the monsoon trough on October 4 near Pohnpei in Micronesia. Initially, Tropical Storm Roger to the northwest hindered the development and motion of Tip, though after the storm tracked farther north, Tip was able to intensify. After passing Guam, Tip rapidly intensified and reached peak sustained winds of 305 km/h (190 mph) and a worldwide record-low sea-level pressure of 870 hPa (25.69 inHg) on October 12. At its peak intensity, Tip was the largest tropical cyclone on record, with a wind diameter of 2,220 km (1,380 mi). Tip slowly weakened as it continued west-northwestward and later turned to the northeast, in response to an approaching trough. The typhoon made landfall in southern Japan on October 19, and became an extratropical cyclone shortly thereafter. Tip's extratropical remnants continued moving east-northeastward, until they dissipated near the Aleutian Islands on October 24.

The Great Gale of 1880 was an intense extratropical cyclone that impacted the Northwest United States on January 9, 1880.

The greatest snowstorm, and perhaps overall worst storm in SW Washington and NW Oregon history, was that dubbed the ‘Storm King’ event of January 9, 1880.... Little data is available for the so-called ‘Storm King’ of January 1880, but it appears the storm center came ashore just south of Astoria, Oregon, on January 9th when a barometric pressure of 28.45” was registered in the town. Portland bottomed out at 28.56.

<span class="mw-page-title-main">2004 Pacific typhoon season</span> Typhoon season in the Western Pacific Ocean

The 2004 Pacific typhoon season was an extremely active season that featured the second-highest ACE ever recorded in a single season, second only to 1997, which featured 29 named storms, nineteen typhoons, and six super typhoons. It was an event in the annual cycle of tropical cyclone formation, in which tropical cyclones form in the western Pacific Ocean. The season ran throughout 2004, though most tropical cyclones typically develop between May and October. The season's first named storm and also the first typhoon, Sudal, developed on April 4, later was reached typhoon status two days later, and became the first super typhoon of the year three days later. The season's last named storm, Noru, dissipated on December 21.

<span class="mw-page-title-main">2003 Pacific typhoon season</span> Typhoon season in the Western Pacific Ocean

The 2003 Pacific typhoon season was a slightly below average yearlong period of tropical cyclogenesis exhibiting the development of 45 tropical depressions, of which 21 became named storms; of those, 14 became typhoons. Though every month with the exception of February and March featured tropical activity, most storms developed from May through October. During the season, tropical cyclones affected the Philippines, Japan, China, the Korean Peninsula, Indochina, and various islands in the western Pacific.

<span class="mw-page-title-main">1987 Pacific typhoon season</span> Typhoon season in the Pacific Ocean

The 1987 Pacific typhoon season has no official bounds; it ran year-round in 1987, but most tropical cyclones tend to form in the northwestern Pacific Ocean between May and November. These dates conventionally delimit the period of each year when most tropical cyclones form in the northwestern Pacific Ocean. Tropical storms formed in the entire west pacific basin were assigned a name by the Joint Typhoon Warning Center. Tropical depressions that enter or form in the Philippine area of responsibility are assigned a name by the Philippine Atmospheric, Geophysical and Astronomical Services Administration or PAGASA. This can often result in the same storm having two names.

<span class="mw-page-title-main">1985 Pacific typhoon season</span> Typhoon season in the Pacific Ocean

The 1985 Pacific typhoon season was an extremely active season, featuring 28 named storms, 15 typhoons and 1 super typhoon. It ran year-round in 1984, but again all tropical cyclones formed between June and December. These dates conventionally delimit the period of each year when most tropical cyclones form in the northwestern Pacific Ocean. A total of 57 tropical depressions formed this year, of which only 28 became tropical storms and were assigned a name by the Joint Typhoon Warning Center. This made the season well above average. Additionally, tropical depressions that enter or form in the Philippine area of responsibility were assigned a name by the Philippine Atmospheric, Geophysical and Astronomical Services Administration or PAGASA. This can often result in the same storm having two names. This year, a total of 17 storms were named this way.

<span class="mw-page-title-main">1959 Pacific typhoon season</span> Typhoon season in the Pacific Ocean

The 1959 Pacific typhoon season was regarded as one of the most devastating years for Pacific typhoons on record, with China, Japan and South Korea sustaining catastrophic losses. It was an event in the annual cycle of tropical cyclone formation. The season had no official bounds, but tropical cyclones in the Western Pacific Ocean normally develop between May and October.

<span class="mw-page-title-main">1971 Pacific typhoon season</span> Typhoon season in the Pacific Ocean

The 1971 Pacific typhoon season was an extremely active season that featured the second highest typhoon count on record. It has no official bounds; it ran year-round in 1971, but most tropical cyclones tend to form in the northwestern Pacific Ocean between June and December. These dates conventionally delimit the period of each year when most tropical cyclones form in the northwestern Pacific Ocean.

<span class="mw-page-title-main">1966 Pacific typhoon season</span>

The 1966 Pacific typhoon season was an active season, with many tropical cyclones having severe impacts in China, Japan, and the Philippines. Overall, there were 49 tropical depressions declared officially or unofficially, of which 30 officially became named storms; of those, 20 reached typhoon status, while 3 further became super typhoons by having winds of at least 240 km/h (150 mph). Throughout the year, storms were responsible for at least 997 fatalities and $377.6 million in damage; however, a complete record of their effects is unavailable.

<span class="mw-page-title-main">1962 Pacific typhoon season</span> Typhoon season in the Pacific Ocean

The 1962 Pacific typhoon season had no official bounds; there was activity in every month but January, March, and June, but most tropical cyclones form in the northwestern Pacific Ocean between May and November and this conventionally delimits the season.
<span class="mw-page-title-main">1961 Pacific typhoon season</span> Typhoon season in the Pacific Ocean

The 1961 Pacific typhoon season had no official bounds; it ran year-round in 1961, but most tropical cyclones tend to form in the northwestern Pacific Ocean between June and December. These dates conventionally delimit the period of each year when most tropical cyclones form in the northwestern Pacific Ocean.

<span class="mw-page-title-main">1960 Pacific typhoon season</span> Typhoon season in the Pacific Ocean

The 1960 Pacific typhoon season had no official bounds; it ran year-round in 1960, but most tropical cyclones tend to form in the northwestern Pacific Ocean between June and December. These dates conventionally delimit the period of each year when most tropical cyclones form in the northwestern Pacific Ocean.
<span class="mw-page-title-main">2006 Central Pacific cyclone</span> Unusual cyclonic formation in the Pacific Ocean

The 2006 Central Pacific cyclone, also known as Invest 91C or Storm 91C, was an unusual weather system that formed in 2006. Forming on October 30 from a mid-latitude cyclone in the north Pacific mid-latitudes, it moved over waters warmer than normal. The system acquired some features more typical of subtropical and even tropical cyclones. However, as it neared the western coastline of North America, the system fell apart, dissipating soon after landfall, on November 4. Moisture from the storm's remnants caused substantial rainfall in British Columbia and the Pacific Northwest. The exact status and nature of this weather event is unknown, with meteorologists and weather agencies having differing opinions.

<span class="mw-page-title-main">November 2011 Bering Sea cyclone</span> Extratropical cyclone in East Asia and Alaska

The November 2011 Bering Sea cyclone was one of the most powerful extratropical cyclones to affect Alaska on record. On November 8, the National Weather Service (NWS) began issuing severe weather warnings, saying that this was a near-record storm in the Bering Sea. It rapidly deepened from 973 mb (28.7 inHg) to 948 mb (28.0 inHg) in just 24 hours before bottoming out at 943 mbar, roughly comparable to a Category 3 or 4 hurricane. The storm had been deemed life-threatening by many people. The storm had a forward speed of at least 60 mph (97 km/h) before it had reached Alaska. The storm began affecting Alaska in the late hours of November 8, 2011. The highest gust recorded was 93 mph (150 km/h) on Little Diomede Island. One person was reported missing after being swept into the Bering Sea, and he was later pronounced dead.
<span class="mw-page-title-main">Typhoon Forrest (1983)</span> Pacific typhoon in 1983

Typhoon Forrest, known in the Philippines as Typhoon Ising, was the fastest-intensifying tropical cyclone on record, with its minimum barometric pressure dropping 100 mbar (3.0 inHg) from September 22 to September 23, in less than a day. Forrest formed from a tropical disturbance far from land in the western Pacific Ocean. On September 20, the system was classified as a tropical storm, and thereafter began to intensify. The next day, Forrest reached typhoon status, and the intensification process accelerated. The storm prudently strengthened on September 22, and the following morning, attained peak intensity following a pressure drop of 100 mbar (3.0 inHg) in slightly less than 24 hours. Thereafter, Forrest began to weaken slowly as it moved northwest. Approaching Japan, Super Typhoon Forrest first hit Okinawa on September 27. Nearby, a tornado hit Inza Island, destroying 26 homes and injuring 26 people. Forrest then moved north, impaling the Japanese archipelago before transitioning into an extratropical cyclone on September 28, before eventually dissipating on October 4. The torrential rainfall caused by the typhoon triggered deadly landslides and flooding across Japan. In all, the typhoon killed at least 21 people, left 17 listed as missing, and injured 86. Forrest flooded 46,000 homes in muddy water, over 100 dwellings were destroyed, and 2,560 people were rendered as homeless. Seven flights were called off and 27,000 people were stranded. In addition, 67 bridges and 818 roads were damaged.

<span class="mw-page-title-main">Typhoon Joan (1997)</span> Pacific typhoon in 1997

Typhoon Joan was the longest-lasting super typhoon at the time, maintaining 1-minute maximum sustained winds of at least 240 km/h (150 mph) for 4.5 days. Joan, concurrently with Typhoon Ivan to its west, also became the strongest typhoons at the same time in the northwest Pacific Ocean. The 25th named storm during the hyperactive 1997 Pacific typhoon season, Joan developed from the same trough as Typhoon Ivan on October 11. It moved northwestward and later to the west, undergoing explosive deepening to its peak intensity on October 15. One typhoon warning agency estimated that Joan was among the strongest storms on record in the basin, and that Ivan and Joan marked the first occurrence of simultaneous super typhoons. While near peak intensity, Joan passed between Anatahan and Saipan in the Northern Marianas Islands. Later, the typhoon weakened and turned to the north and east, becoming extratropical on October 24.
<span class="mw-page-title-main">Pacific Northwest windstorm</span>

Pacific Northwest windstorms, sometimes colloquially known as Big Blows, are extratropical cyclones which form in the Pacific basin, and affect land areas in the Pacific Northwest of the United States and British Columbia, Canada. They form as cyclonic windstorms associated with areas of low atmospheric pressure that track across the North Pacific Ocean towards western North America. Deep low pressure areas are relatively common over the North Pacific. They are most common in the winter months. On average, the month when most windstorms form is November or December.

<span class="mw-page-title-main">November 2014 Bering Sea cyclone</span>

The November 2014 Bering Sea cyclone was the most intense extratropical cyclone ever recorded in the Bering Sea, which formed from a new storm developing out of the low-level circulation that separated from Typhoon Nuri, which soon absorbed the latter. The cyclone brought gale-force winds to the western Aleutian Islands and produced even higher gusts in other locations, including a 97 miles per hour (156 km/h) gust in Shemya, Alaska. The storm coincidentally occurred three years after another historic extratropical cyclone impacted an area slightly further to the east.

<span class="mw-page-title-main">Typhoon Songda (2016)</span> Pacific typhoon in 2016

Typhoon Songda was the sixth most intense tropical cyclone of the Northwest Pacific Ocean in 2016. Also known as the Ides of October storm, it struck the Pacific Northwest region of the United States and Canada as a powerful extratropical cyclone. Songda was the twentieth named storm and the ninth typhoon of the annual typhoon season. The system developed into a tropical storm south of Minamitorishima on October 8 and strengthened into a typhoon on October 10. Songda reached its peak intensity southeast of Japan late on October 11 at an unusually high latitude, before it became extratropical on October 13.
<span class="mw-page-title-main">October 2021 Northeast Pacific bomb cyclone</span> North American bomb cyclone in 2021

An extremely powerful extratropical bomb cyclone began in late October 2021 in the Northeast Pacific and struck the Western United States and Western Canada. The storm was the third and the most powerful cyclone in a series of powerful storms that struck the region within a week. The cyclone tapped into a large atmospheric river and underwent explosive intensification, becoming a bomb cyclone on October 24. The bomb cyclone had a minimum central pressure of 942 millibars (27.8 inHg) at its peak, making it the most powerful cyclone recorded in the Northeast Pacific. The system had severe impacts across Western North America, before dissipating on October 26. The storm shattered multiple pressure records across parts of the Pacific Northwest. Additionally, the bomb cyclone was the most powerful storm on record to strike the region, in terms of minimum central pressure. The bomb cyclone brought powerful gale-force winds and flooding to portions of Western North America. At its height, the storm cut the power to over 370,500 customers across the Western U.S. and British Columbia. The storm killed at least two people; damage from the storm was estimated at several hundred million dollars. The bomb cyclone was compared to the Columbus Day Storm of 1962, in terms of ferocity.

References

  1. "Daily Weather Maps: October 13, 1962". U.S. Weather Bureau. Retrieved November 28, 2006.
  2. Burt, Christopher C. (2004), Extreme Weather: A Guide and Record Book, W.W. Norton & Co., p. 236, ISBN   978-0-393-32658-1
  3. Al Sholand. "Typhoon Freda stormed in to town" . Retrieved September 2, 2012.
  4. 1 2 "Annual Tropical Cyclone Report – 1962" (PDF). Pearl Harbor, Hawaii: Joint Typhoon Warning Center. 1962. Archived from the original (PDF) on September 25, 2018. Retrieved November 30, 2008.
  5. "Best Track - Typhoon Freda". Joint Typhoon Warning Center. 2011. Archived from the original on September 16, 2012. Retrieved August 27, 2012.
  6. "Daily Weather Maps: October 17, 1962". U.S. Weather Bureau. Retrieved November 28, 2006.
  7. 1 2 3 4 Read, Wolf (October 27, 2015). "The 1962 Columbus Day Storm". The Storm King. Office of the Washington State Climatologist (OWSC). Retrieved October 13, 2016.
  8. "Spokane Daily Chronicle - Google News Archive Search". news.google.com. Retrieved September 17, 2017.
  9. "Columbus Day Storm still howls through Portland history, 50 years later". OregonLive.com. Retrieved October 13, 2016.
  10. 1 2 "The Mightiest Wind: The 1962 Columbus Day Storm". September 7, 2012. Archived from the original on September 7, 2012. Retrieved 2016-10-13.{{cite web}}: CS1 maint: bot: original URL status unknown (link)
  11. "CPI Inflation Calculator". US Bureau of Labor Statistics.
  12. "Terrible Tempest of the 12th". Climate.washington.edu. Retrieved October 7, 2012.
  13. J. L. Baldwin Weekly Weather and Crop Bulletin. U.S. Department of Commerce, p. 1.
  14. Burt, Christopher C. (2004), Extreme Weather: A Guide and Record Book, W.W. Norton & Co., p. 237, ISBN   978-0-393-32658-1
  15. 1 2 "Friday night's violent winds wreck Multnomah Stadium". The Register-Guard . October 14, 1962. Retrieved September 14, 2012.
  16. 1 2 Smith, Craig (October 12, 2004). "Punting into this storm sent averages plummeting". The Seattle Times. Retrieved September 14, 2012.
  17. Harvey III, Paul (October 14, 1962). "Huskies nip Beavers". The Register-Guard . Retrieved September 14, 2012.
  18. "The Columbus Day "Big Blow" Of 1962 Set The Bar For Pacific Northwest Storms | Weather Concierge". October 12, 2018. Retrieved June 8, 2020.[ permanent dead link ]
  19. "Columbus Day windstorm ravages Puget Sound region on October 12, 1962". www.historylink.org. Retrieved June 8, 2020.
  20. "The Columbus Day Storm of 1962". Farmers’ Almanac. October 7, 2013. Retrieved June 8, 2020.
  21. "Typhoon Freda slams B.C. coast in 1962". CBC.ca . October 15, 2016. Retrieved June 8, 2020.
  22. Bill Gabbert (December 5, 2011). "Looking back at the Martin Mars". On October 12, 1962, while parked ... at the Victoria International Airport on Vancouver Island, it was damaged beyond repair by Typhoon Freda when she was blown 200 yards across the airport.

Further reading