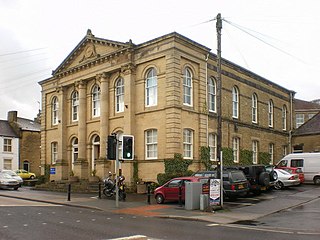
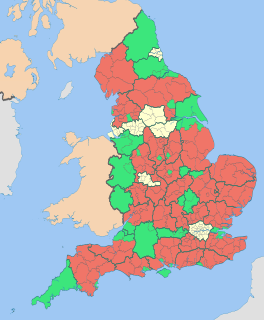
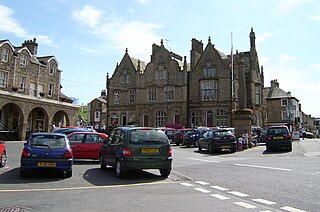
The 2004 Craven District Council election took place on 10 June 2004 to elect members of Craven District Council in North Yorkshire, England. One third of the council was up for election and the council stayed under no overall control. [1]
Craven is a local government district of North Yorkshire, England centred on the market town of Skipton. In 1974, Craven district was formed as the merger of Skipton urban district, Settle Rural District and most of Skipton Rural District, all in the West Riding of Yorkshire. The population of the Local Authority at the 2011 Census was 55,409. It comprises the upper reaches of Airedale, Wharfedale, Ribblesdale, and includes most of the Aire Gap and Craven Basin.
Non-metropolitan districts, or colloquially "shire districts", are a type of local government district in England. As created, they are sub-divisions of non-metropolitan counties in a two-tier arrangement.
North Yorkshire is a non-metropolitan county and largest ceremonial county in England. It is located primarily in the region of Yorkshire and the Humber but partly in the region of North East England. The estimated population of North Yorkshire was 602,300 in mid 2016.
After the election, the composition of the council was as follows:
The Conservative Party, officially the Conservative and Unionist Party, is a centre-right political party in the United Kingdom. Presently led by Theresa May, it has been the governing party since 2010. It presently has 314 Members of Parliament in the House of Commons, 249 members of the House of Lords, and 18 members of the European Parliament. It also has 31 Members of the Scottish Parliament, 12 members of the Welsh Assembly, eight members of the London Assembly and 9,008 local councillors. One of the major parties of UK politics, it has formed the government on 45 occasions, more than any other party.
The Liberal Democrats are a liberal political party in the United Kingdom. They presently have 11 Members of Parliament in the House of Commons, 96 members of the House of Lords, and one member of the European Parliament. They also have five Members of the Scottish Parliament and a member each in the Welsh Assembly and London Assembly. The party reached the height of its influence in the early 2010s, forming a junior partner in a coalition government from 2010 to 2015. It is presently led by Vince Cable.
After the last election in 2003, the Conservatives had 11 seats, compared to 10 for independents and 9 Liberal Democrats. [3] However, in November 2003 an independent candidate gained a seat from the Liberal Democrats at a by-election in Bentham. [4]
By-elections, also spelled bye-elections, are used to fill elected offices that have become vacant between general elections.
Bentham is a civil parish in the Craven district of North Yorkshire, England, with a population of 3,027 at the 2011 Census. The parish includes the small town of High Bentham, occasionally known as Higher Bentham or just Bentham, and the older adjacent village of Low Bentham.
At the 2004 election two long serving councillors stood down, Beth Graham from Settle and Ribblesbanks ward, who had been a councillor since 1976, and Peter Walbank of Grassington ward. [5] Candidates at the election included the first Labour party candidate for a few years, James Black in Skipton South, while the Green party also stood a candidate in Aire Valley with Lothersdale. [5]
A Councillor is a member of a local government council.
Settle is a small market town and civil parish in the Craven district of North Yorkshire, England. Historically in the West Riding of Yorkshire, it is served by Settle railway station located near the town centre, and Giggleswick railway station which is a mile away. It is 29 miles (47 km) from Leeds Bradford Airport. The main road through Settle is the B6480, which links to the A65, connecting Settle to Skipton and Kendal. The town has a population of 2,421 according to the 2001 Census increasing to 2,564 at the 2011 Census.
The wards and electoral divisions in the United Kingdom are electoral districts at sub-national level represented by one or more councillors. The ward is the primary unit of English electoral geography for civil parishes and borough and district councils, electoral ward is the unit used by Welsh principal councils, while the electoral division is the unit used by English county councils and some unitary authorities. Each ward/division has an average electorate of about 5,500 people, but ward-population counts can vary substantially. As at the end of 2014 there were 9,456 electoral wards/divisions in the UK.
The Conservatives gained 2 seats at the election to have 13 councillors, compared to 11 independents and 6 Liberal Democrats. [6] Overall turnout at the election reached 50% after being held with all postal voting, only 9% below the turnout nationally at the 2001 general election, with the high turnout leading to a delay in the counting of the results. [7]
Voter turnout is the percentage of eligible voters who cast a ballot in an election. Eligibility varies by country, and the voting-eligible population should not be confused with the total adult population. Age and citizenship status are often among the criteria used to determine eligibility, but some countries further restrict eligibility based on sex, race, or religion.
Postal voting is voting in an election whereby ballot papers are distributed to electors or returned by post, in contrast to electors voting in person at a polling station or electronically via an electronic voting system. Historically, postal votes must be distributed and placed in return mail before the scheduled election day, it is sometimes referred to as a form of early voting. It can also be used as an absentee ballot. However, in recent times the model in the US has morphed, in municipalities that use postal voting exclusively, to be one of ballots being mailed out to voters, but the return method taking on alternatives of return by mail or dropping off the ballot in person via secure drop boxes and/or voting centers.
Party | Seats | Gains | Losses | Net gain/loss | Seats % | Votes % | Votes | +/− | |
---|---|---|---|---|---|---|---|---|---|
Conservative | 6 | 2 | 0 | +2 | 54.5 | 41.6 | 5,549 | -4.1% | |
Liberal Democrat | 3 | 0 | 2 | -2 | 27.3 | 29.9 | 3,982 | +5.6% | |
Independent | 2 | 0 | 0 | 0 | 18.2 | 24.9 | 3,318 | -5.1% | |
Green | 0 | 0 | 0 | 0 | 0 | 2.1 | 285 | +2.1% | |
Labour | 0 | 0 | 0 | 0 | 0 | 1.5 | 204 | +1.5% | |
Party | Candidate | Votes | % | ± | |
---|---|---|---|---|---|
Conservative | Patricia Fairbank | 725 | 52.7 | ||
Liberal Democrat | John Manley | 365 | 26.5 | ||
Green | John Akroyd | 285 | 20.7 | ||
Majority | 360 | 26.2 | |||
Turnout | 1,375 | 51.7 | +14.5 | ||
Conservative hold | Swing | ||||
Party | Candidate | Votes | % | ± | |
---|---|---|---|---|---|
Conservative | Christopher Knowles-Fitton | 414 | 51.2 | -13.0 | |
Independent | Cecil Hammond | 302 | 37.3 | +1.5 | |
Liberal Democrat | Darren Moorby | 93 | 11.5 | +11.5 | |
Majority | 112 | 13.9 | -14.5 | ||
Turnout | 809 | 59.9 | +2.7 | ||
Conservative hold | Swing | ||||
Party | Candidate | Votes | % | ± | |
---|---|---|---|---|---|
Independent | John Alderson | 374 | 45.1 | ||
Independent | Alan Perrow | 316 | 38.1 | ||
Conservative | Geoffrey Dunn | 140 | 16.9 | ||
Majority | 58 | 7.0 | |||
Turnout | 830 | 50.1 | |||
Independent hold | Swing | ||||
Party | Candidate | Votes | % | ± | |
---|---|---|---|---|---|
Conservative | Richard Foster | 616 | 73.2 | ||
Liberal Democrat | Andrew Rankine | 225 | 26.8 | ||
Majority | 391 | 46.5 | |||
Turnout | 841 | 65.4 | |||
Conservative hold | Swing | ||||
Party | Candidate | Votes | % | ± | |
---|---|---|---|---|---|
Independent | David Ireton | 1,403 | 81.9 | ||
Conservative | Alex Bentley | 310 | 18.1 | ||
Majority | 1,093 | 63.8 | |||
Turnout | 1,713 | 56.9 | |||
Independent hold | Swing | ||||
Party | Candidate | Votes | % | ± | |
---|---|---|---|---|---|
Conservative | Donald Whaites | 740 | 50.5 | ||
Liberal Democrat | Ronald Graveson | 726 | 49.5 | ||
Majority | 14 | 1.0 | |||
Turnout | 1,466 | 53.3 | +14.2 | ||
Conservative gain from Liberal Democrat | Swing | ||||
Party | Candidate | Votes | % | ± | |
---|---|---|---|---|---|
Liberal Democrat | Eric Jaquin | 728 | 51.1 | +24.3 | |
Conservative | Christopher Harbron | 697 | 48.9 | +17.4 | |
Majority | 31 | 2.2 | |||
Turnout | 1,425 | 52.0 | |||
Liberal Democrat hold | Swing | ||||
Party | Candidate | Votes | % | ± | |
---|---|---|---|---|---|
Conservative | Paul Whitaker | 679 | 41.7 | -14.7 | |
Liberal Democrat | Michael Doyle | 549 | 33.7 | -9.9 | |
Independent | John Kerwin-Davey | 399 | 24.5 | +24.5 | |
Majority | 130 | 8.0 | -4.9 | ||
Turnout | 1,627 | 59.7 | |||
Conservative gain from Liberal Democrat | Swing | ||||
Party | Candidate | Votes | % | ± | |
---|---|---|---|---|---|
Liberal Democrat | Andrew Solloway | 501 | 44.8 | +44.8 | |
Conservative | Kenneth Creek | 224 | 20.0 | +4.7 | |
Labour | James Black | 204 | 18.2 | +18.2 | |
Independent | Dennis Hall | 190 | 17.0 | -40.5 | |
Majority | 277 | 24.8 | |||
Turnout | 1,119 | 41.5 | |||
Liberal Democrat hold | Swing | ||||
Party | Candidate | Votes | % | ± | |
---|---|---|---|---|---|
Liberal Democrat | Paul English | 795 | 65.3 | -1.7 | |
Conservative | Norman Spence | 423 | 34.7 | +1.7 | |
Majority | 372 | 30.5 | -3.5 | ||
Turnout | 1,218 | 43.0 | |||
Liberal Democrat hold | Swing | ||||
Party | Candidate | Votes | % | ± | |
---|---|---|---|---|---|
Conservative | John Sayer | 581 | 63.5 | +5.1 | |
Independent | Kenneth Luty | 334 | 36.5 | +8.2 | |
Majority | 247 | 27.0 | -3.1 | ||
Turnout | 915 | 61.1 | +7.9 | ||
Conservative hold | Swing | ||||
Party | Candidate | Votes | % | ± | |
---|---|---|---|---|---|
Conservative | Julia Mulligan | 394 | 54.7 | -8.8 | |
Independent | 326 | 45.3 | +8.8 | ||
Majority | 68 | 9.4 | -17.6 | ||
Turnout | 720 | 47.0 | -14.1 | ||
Conservative hold | Swing | ||||
The 1999 Craven District Council election took place on 6 May 1999 to elect members of Craven District Council in North Yorkshire, England. One third of the council was up for election and the Conservative party gained overall control of the council from no overall control.
The 2000 Craven District Council election took place on 4 May 2000 to elect members of Craven District Council in North Yorkshire, England. One third of the council was up for election and the Conservative party stayed in overall control of the council.
The 2002 Craven District Council election took place on 2 May 2002 to elect members of Craven District Council in North Yorkshire, England. The whole council was up for election with boundary changes since the last election in 2000 reducing the number of seats by 4. The council stayed under no overall control.
The 2003 Craven District Council election took place on 1 May 2003 to elect members of Craven District Council in North Yorkshire, England. One third of the council was up for election and the council stayed under no overall control.
The 2007 Craven District Council election took place on 3 May 2007 to elect members of Craven District Council in North Yorkshire, England. One third of the council was up for election and the council stayed under no overall control.
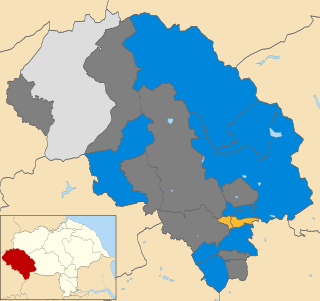
The 2008 Craven District Council election took place on 1 May 2008 to elect members of Craven District Council in North Yorkshire, England. One third of the council was up for election and the council stayed under no overall control.
The 2008 Harlow District Council election took place on 1 May 2008 to elect members of Harlow District Council in Essex, England. One third of the council was up for election and the Conservative party gained overall control of the council from no overall control.
The 1998 Wyre Forest District Council election took place on 7 May 1998 to elect members of Wyre Forest District Council in Worcestershire, England. One third of the council was up for election and the Labour party stayed in overall control of the council.
The 2010 Craven District Council election took place on 6 May 2010 to elect members of Craven District Council in North Yorkshire, England. One third of the council was up for election and the Conservative party gained overall control of the council from no overall control.
The 2007 Pendle Borough Council election took place on 3 May 2007 to elect members of Pendle Borough Council in Lancashire, England. One third of the council was up for election and the Liberal Democrats stayed in overall control of the council.
The 2004 Colchester Borough Council election took place on 10 June 2004 to elect members of Colchester Borough Council in Essex, England. This was the same day as the other 2004 United Kingdom local elections and as the 2004 European Parliament Elections. One third of the seats were up for election and the council stayed under no overall control.
The 2012 Pendle Borough Council election took place on 3 May 2012 to elect members of Pendle Borough Council in Lancashire, England. One third of the council was up for election and the council stayed under no overall control.
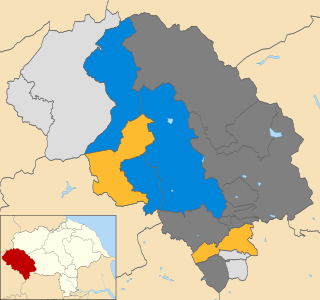
The 2006 Craven District Council election took place on 4 May 2006 to elect members of Craven District Council in North Yorkshire, England. One third of the council was up for election and the council stayed under no overall control.
The 2011 Craven District Council election took place on 5 May 2011 to elect members of Craven District Council in North Yorkshire, England. One third of the council was up for election and the Conservative party stayed in overall control of the council.
The 2012 Craven District Council election took place on 3 May 2012 to elect members of Craven District Council in North Yorkshire, England. One third of the council was up for election and the Conservative party stayed in overall control of the council.
The 2014 Craven District Council election took place on 22 May 2014 to elect members of Craven District Council in North Yorkshire, England. One third of the council was up for election and the Conservative party stayed in overall control of the council.
The 2003 South Kesteven District Council election took place on 1 May 2003 to elect members of South Kesteven District Council in Lincolnshire, England. The whole council was up for election and the Conservative party gained control of the council from no overall control.
The 2004 West Oxfordshire District Council election took place on 10 June 2004 to elect members of West Oxfordshire District Council in Oxfordshire, England. One third of the council was up for election and the Conservative party stayed in overall control of the council.
The 2006 West Oxfordshire District Council election took place on 4 May 2006 to elect members of West Oxfordshire District Council in Oxfordshire, England. One third of the council was up for election and the Conservative party stayed in overall control of the council.
The 2007 West Oxfordshire District Council election took place on 3 May 2007 to elect members of West Oxfordshire District Council in Oxfordshire, England. One third of the council was up for election and the Conservative party stayed in overall control of the council.