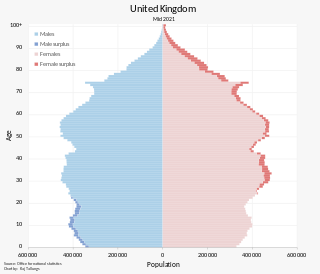
The population of the United Kingdom was estimated at 67,596,281 in 2022. It is the 21st most populated country in the world and has a population density of 279 people per square kilometre, with England having significantly greater density than Wales, Scotland, and Northern Ireland. Almost a third of the population lives in south east England, which is predominantly urban and suburban, with 8,866,180 people in the capital city, London, whose population density was 5,640 inhabitants per square kilometre (14,600/sq mi) in 2022.

Demographics of Wales include population, place of birth, age, ethnicity, religion, and number of marriages in Wales.

The demography of Scotland includes all aspects of population, past and present, in the area that is now Scotland. Scotland had a population of 5,463,300 in 2019. The population growth rate in 2011 was estimated as 0.6% per annum according to the 2011 GROS Annual Review.

The demography of London is analysed by the Office for National Statistics and data is produced for each of the Greater London wards, the City of London and the 32 London boroughs, the Inner London and Outer London statistical sub-regions, each of the Parliamentary constituencies in London, and for all of Greater London as a whole. Additionally, data is produced for the Greater London Urban Area. Statistical information is produced about the size and geographical breakdown of the population, the number of people entering and leaving country and the number of people in each demographic subgroup. The total population of London as of 2021 is 8,799,800.

Islam in Scotland includes all aspects of the Islamic faith in Scotland. The first Muslim known to have been in Scotland was a medical student who studied at the University of Edinburgh from 1858 to 1859. The production of goods and Glasgow's busy port meant that many lascars were employed there. Most Muslims in Scotland are members of families that immigrated in the later decades of the 20th century. At the 2011 census, Muslims comprised 1.4 per cent of Scotland's population (76,737). In the 2022 census, this grew to 2.2% of the population (119,872).
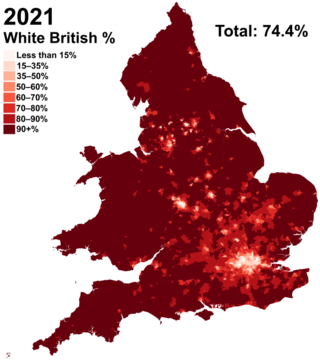
White British is an ethnicity classification used for the native White population identifying as English, Scottish, Welsh, Cornish, Northern Irish, or British in the United Kingdom Census. In the 2011 census, the White British population was 49,997,686, 81.5% of Great Britain's total population. For the United Kingdom entirely, due to different reporting measures within Northern Ireland which includes all those who identified as British with those who identified as Irish, an amalgamated total of 52,320,080 including those who identified as White Irish in Great Britain is given making up 82.8% of the population.

Hinduism is a minority religion in Scotland. A significant number of Hindus settled there in the second half of the 20th century. At the time of the 2001 UK Census, 5,600 people identified as Hindu, which equated to 0.1% of the Scottish population and was slightly above the number of Hindus in Wales. In the 2011 Census, the number of Hindus in Scotland almost tripled to over 16,000 adherents. In the 2022 census, this number nearly doubled to just under 30,000 Hindus, representing about 0.6% of the population in Scotland.
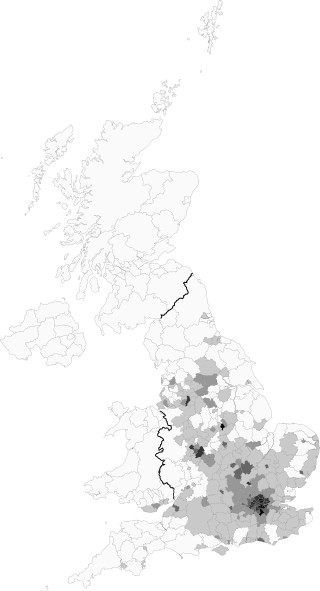
Mixed is an ethnic group category that was first introduced by the United Kingdom's Office for National Statistics for the 2001 Census. Colloquially, it refers to British citizens or residents whose parents are of two or more races or ethnic backgrounds. The Mixed or Multiple ethnic group numbered just under 1.8 million in the 2021 United Kingdom census or 2.7% of the total UK population.

Spaniards in the United Kingdom are people of Spanish descent resident in Britain. They may be British citizens or non-citizen immigrants. In the 2021 census for England and Wales, 81,150 people self-identified as ethnic Spanish.
East Asians in the United Kingdom are East Asians living in the United Kingdom. They have been present in the country since the 17th century and primarily originate from countries such as China, Hong Kong, Japan, South Korea and Taiwan. They are called "East Asian" or "Oriental", although – dependent upon the context – the use of the term "Oriental" might be considered by some to be derogatory or offensive. In the 2001 British census, the term Chinese or Other is used.

South Africans in the United Kingdom include citizens and residents of the United Kingdom with origins in South Africa.

New Zealanders in the United Kingdom are citizens or residents of the United Kingdom who originate from New Zealand.
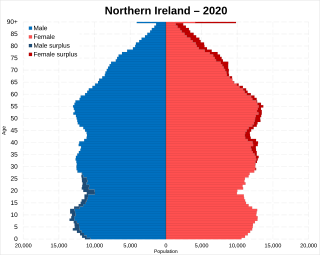
Northern Ireland is the smallest of the four parts of the United Kingdom in terms of both area and population, containing 2.9% of the total population and 5.7% of the total area of the United Kingdom. It is the smaller of the two political entities on the island of Ireland by area and population, the other being the Republic of Ireland. Northern Ireland contains 27.1% of the total population and 16.75% of the total area of the island of Ireland.

Sikhism in Scotland includes all aspects of Sikh life and Sikhism in Scotland. Sikhs have been present in Scotland for over a century, with the first documented Sikh, Maharaja Daleep Singh, arriving in Perthshire in 1855. The next wave of migration was in early-to-mid 1920s when prominent Sikhs of the Bhat/Bhatra community established themselves in Glasgow and Edinburgh. However, the bulk of Sikhs in Scotland come from families who immigrated during the late 20th century. In Scotland, Sikhs represented about 0.2% of the population (10,988) in the 2022 census.

White Irish is an ethnicity classification used in the census in the United Kingdom for England, Scotland and Wales. In the 2021 census, the White Irish population was 564,342 or 0.9% of Great Britain's total population. This was a slight fall from the 2011 census which recorded 585,177 or 1% of the total population.
A census of the population of the United Kingdom is taken every ten years. The 2011 census was held in all counties of the UK on 27 March 2011. It was the first UK census which could be completed online via the Internet. The Office for National Statistics (ONS) is responsible for the census in England and Wales, the General Register Office for Scotland (GROS) is responsible for the census in Scotland, and the Northern Ireland Statistics and Research Agency (NISRA) is responsible for the census in Northern Ireland.
Southeast Asians have lived in the United Kingdom for several centuries, arriving from Southeast Asia and primarily originating from countries and territories such as the Philippines, Malaysia, Indonesia, Burma, Singapore, Thailand and Vietnam.
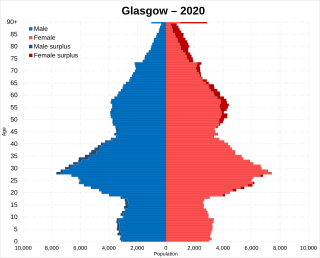
Glasgow is the most populous city in Scotland and the fourth most populous city in the United Kingdom.
White Polish is an ethnicity classification used in Scotland at the 2011 United Kingdom Census. In the 2021 census, the White Polish ethnic group totalled 705,080 in Great Britain, 90,736 of which were in Scotland making up 1.67% of the total population of Scotland at the time.

White: Gypsy or Irish Traveller is an ethnicity classification used in the 2011 United Kingdom Census. In the 2011 census, the White: Gypsy or Irish Traveller population was 63,193 or about 0.1 percent of the total population of the country. The ethnicity category may encompass populace from the distinct ethnic groups of Romanichal Travellers or Irish Travellers, and their respective related subgroupings, who identify as, or are perceived to be, white people in the United Kingdom.


