Sacramento County is a county located in the U.S. state of California. As of the 2020 census, the population was 1,585,055. Its county seat is Sacramento, which has been the state capital of California since 1854.

Yolo County, officially the County of Yolo, is a county located in the northern portion of the U.S. state of California. Yolo County was one of the original counties of California, created in 1850 at the time of statehood. As of the 2020 census, the population was 216,403. Its county seat is Woodland.

Alameda County is a county located in the U.S. state of California. As of the 2020 census, the population was 1,682,353, making it the 7th-most populous county in the state and 21st most populous nationally. The county seat is Oakland. Alameda County is in the San Francisco Bay Area, occupying much of the East Bay region.
Imperial County is a county located on the southeast border of the U.S. state of California. As of the 2020 census, the population was 179,702, making it the least populous county in Southern California. The county seat and largest city is El Centro. Imperial is the most recent California county to be established, as it was created in 1907 out of portions of San Diego County.

Kings County is a county located in the U.S. state of California. The population was 152,486 at the 2020 census. The county seat is Hanford.
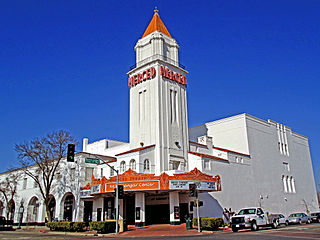
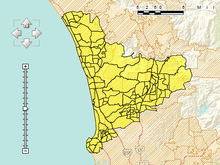
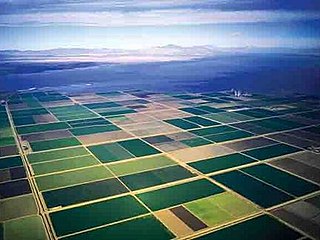
Merced County is a county located in the northern San Joaquin Valley section of the Central Valley, in the U.S. state of California.

Monterey County, officially the County of Monterey, is a county located on the Pacific coast in the U.S. state of California. As of the 2020 census, its population was 439,035. The county's largest city and county seat is Salinas.
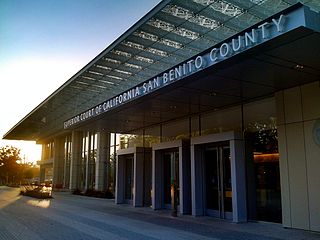
San Benito County, officially the County of San Benito, is a county located in the Central Coast region of California. Situated in the California Coast Ranges, Hollister had a population of 64,209, as of the 2020 census. The county seat is Hollister.
San Joaquin County, officially the County of San Joaquin, is a county located in the U.S. state of California. As of the 2020 census, the population was 779,233. The county seat is Stockton.

San Luis Obispo County, officially the County of San Luis Obispo, is a county on the Central Coast of California. As of the 2020 census, the population was 282,424. The county seat is San Luis Obispo.

Solano County is a county located in the U.S. state of California. As of the 2020 census, its population was 453,491. The county seat is Fairfield.

Stanislaus County is a county located in the San Joaquin Valley of the U.S. state of California. As of 2023, its estimated population is 564,404. The county seat is Modesto.

Sutter County is a county located in the U.S. state of California. As of the 2020 census, the population was 99,633. The county seat is Yuba City. Sutter County is included in the Yuba City, CA Metropolitan Statistical Area as well as the Sacramento-Roseville, CA Combined Statistical Area. The county is located along the Sacramento River in the Sacramento Valley.

Tulare County is a county located in the U.S. state of California. As of the 2020 census, the population was 473,117. The county seat is Visalia. The county is named for Tulare Lake, once the largest freshwater lake west of the Great Lakes. Drained for agricultural development, the site is now in Kings County, which was created in 1893 from the western portion of the formerly larger Tulare County.

Eddy County is a county located in the U.S. state of New Mexico. As of the 2020 census, the population was 62,314. Its county seat and largest city is Carlsbad. The county was created in 1891 and later organized in 1892. It is north of the Texas state line.

Carlsbad is a beach city in the North County area of San Diego County, California. The city is 35 miles (56 km) north of downtown San Diego and 87 miles (140 km) south of downtown Los Angeles. As of the 2020 census, the population of the city was 114,746. Carlsbad is a popular tourist destination and home to many businesses in the golf industry.

Riverside County is a county located in the southern portion of the U.S. state of California. As of the 2020 census, the population was 2,418,185, making it the fourth-most populous county in California and the 10th-most populous in the United States. The name was derived from the city of Riverside, which is the county seat.

San Diego County, officially the County of San Diego, is a county in the southwestern corner of the U.S. state of California. As of the 2020 census, the population was 3,298,634, making it California's second-most populous county and the fifth-most populous in the United States. Its county seat is San Diego, the second-most populous city in California and the eighth-most populous city in the United States. It is the southwesternmost county in the 48 contiguous United States, and is a border county. It is home to 18 Native American tribal reservations, the most of any county in the United States. There are 16 military installations of the U.S. Navy, U.S. Marine Corps, and U.S. Coast Guard in the county.

The 2020 United States Census reported that San Francisco had a population of 873,965—an increase from the 2010 Census count of 805,235. The 2022 Census Bureau American Community Survey put the population at 808,437: a decrease of 65,528 from 2020. With a population density of 18,633 per square mile (7,194/km2), San Francisco is the second-most densely populated major American city, behind only New York.