Edinburgh | |
---|---|
Former Burgh constituency for the House of Commons | |
Major settlements | Edinburgh |
1708–1885 | |
Seats | 1708–1832: One 1832–1885: Two |
Created from | Edinburgh |
Replaced by | Edinburgh Central Edinburgh South Edinburgh East Edinburgh West |
Edinburgh was a burgh constituency of the House of Commons of the Parliament of Great Britain from 1708 to 1801 and of the Parliament of the United Kingdom from 1801 until 1885.
The British parliamentary constituency was created in 1708 following the Acts of Union, 1707 and replaced the former Parliament of Scotland burgh constituency of Edinburgh.
The constituency elected one Member of Parliament (MP) by the first past the post system until representation was increased to two members in 1832. [1] [2] [3] [4] [5] It was abolished in 1885, being split into Edinburgh Central, Edinburgh South, Edinburgh East and Edinburgh West.
The boundaries of the constituency, as set out in the Representation of the People (Scotland) Act 1832, were-
Election | Member | Party | |
---|---|---|---|
1708 | Sir Samuel McClellan | ||
1709 by-election | Sir Patrick Johnston | ||
1713 | Sir James Stewart | Whig | |
1715 | Sir George Warrender | ||
1721 by-election | John Campbell | ||
1734 | Paul Lindsay | ||
1741 | Archibald Stewart | ||
1747 | James Ker | ||
1754 | William Alexander | ||
1761 | George Lind | ||
1762 by-election | James Coutts | ||
1768 | Sir Lawrence Dundas | Whig | |
1780 | William Miller | ||
1781 | Sir Lawrence Dundas | Whig | |
1781 by-election | James Hunter Blair | ||
1784 by-election | Sir Adam Fergusson | ||
1790 | Henry Dundas | Tory | |
1803 by-election | Charles Hope | Tory | |
1805 by-election | George Abercromby | Whig | |
1806 | Sir Patrick Murray | ||
1812 by-election | William Dundas | Tory [7] | |
1831 | Robert Dundas | Tory [7] |
Under the Representation of the People Act 1832, Edinburgh's representation was increased to two members.
Election | 1st Member | 1st Party | 2nd Member | 2nd Party | ||
---|---|---|---|---|---|---|
1832 | Francis Jeffrey | Whig [7] | James Abercromby, later Baron Dunfermline | Whig [7] | ||
1834 by-election | Sir John Campbell, later Baron Campbell | Whig [7] | ||||
1839 by-election | Thomas Babington Macaulay, later Baron Macaulay | Whig [7] [8] [9] [10] [11] | ||||
1841 | Sir William Gibson-Craig | Whig [7] [12] [13] [8] [9] | ||||
1847 | Charles Cowan | Radical [14] [11] [15] [16] | ||||
1852 | Thomas Babington Macaulay | Whig [7] [8] [9] [10] [11] | ||||
1856 by-election | Adam Black | Whig [17] [18] | ||||
1859 | Liberal | James Moncreiff, later Baron Moncreiff | Liberal | |||
1865 | Duncan McLaren | Liberal | ||||
1868 | John Miller | Liberal | ||||
1874 | James Cowan | Liberal | ||||
1880 | ||||||
January 1881 by-election | John McLaren | Liberal | ||||
August 1881 by-election | Thomas Buchanan | Liberal | ||||
1882 by-election | Samuel Danks Waddy | Liberal | ||||
1885 | constituency divided: see Central, East, South and West divisions |
Party | Candidate | Votes | % | ±% | |
---|---|---|---|---|---|
Liberal | Samuel Danks Waddy | 8,455 | 52.3 | −33.8 | |
Independent Liberal | James Hall Renton [20] | 7,718 | 47.7 | New | |
Majority | 737 | 4.6 | −23.9 | ||
Turnout | 16,173 | 55.3 | −5.9 (est) | ||
Registered electors | 29,252 | ||||
Liberal hold | Swing | N/A | |||
Party | Candidate | Votes | % | ±% | |
---|---|---|---|---|---|
Liberal | Thomas Buchanan | Unopposed | |||
Liberal hold |
Party | Candidate | Votes | % | ±% | |
---|---|---|---|---|---|
Liberal | John McLaren | 11,390 | 74.3 | −11.8 | |
Independent Liberal | Edward Jenkins [21] | 3,940 | 25.7 | New | |
Majority | 7,450 | 48.6 | +20.1 | ||
Turnout | 15,330 | 53.5 | −7.7 (est) | ||
Registered electors | 28,644 | ||||
Liberal hold | Swing | N/A | |||
Party | Candidate | Votes | % | ±% | |
---|---|---|---|---|---|
Liberal | Duncan McLaren | 17,807 | 43.7 | +8.1 | |
Liberal | James Cowan | 17,301 | 42.4 | +15.2 | |
Conservative | John Macdonald | 5,651 | 13.9 | −3.9 | |
Majority | 11,650 | 28.5 | +20.7 | ||
Turnout | 17,458 (est) | 61.2 (est) | −15.0 | ||
Registered electors | 28,524 | ||||
Liberal hold | Swing | +5.0 | |||
Liberal hold | Swing | +8.6 | |||
Party | Candidate | Votes | % | ±% | |
---|---|---|---|---|---|
Liberal | Duncan McLaren | 11,431 | 35.6 | N/A | |
Liberal | James Cowan | 8,749 | 27.2 | N/A | |
Liberal | John Miller | 6,218 | 19.4 | N/A | |
Conservative | John Macdonald | 5,713 | 17.8 | New | |
Majority | 2,531 | 7.8 | N/A | ||
Turnout | 18,912 (est) | 76.2 (est) | N/A | ||
Registered electors | 24,832 | ||||
Liberal hold | |||||
Liberal hold |
Party | Candidate | Votes | % | ±% | |
---|---|---|---|---|---|
Liberal | Duncan McLaren | Unopposed | |||
Liberal | John Miller | Unopposed | |||
Registered electors | 20,779 | ||||
Liberal hold | |||||
Liberal hold |
Party | Candidate | Votes | % | ±% | |
---|---|---|---|---|---|
Liberal | Duncan McLaren | 4,354 | 27.2 | N/A | |
Liberal | James Moncreiff | 4,148 | 25.9 | N/A | |
Liberal | Adam Black | 3,797 | 23.7 | N/A | |
Liberal | John Miller | 3,723 | 23.2 | N/A | |
Majority | 351 | 2.2 | N/A | ||
Turnout | 8,011 (est) | 77.5 (est) | N/A | ||
Registered electors | 10,343 | ||||
Liberal hold | |||||
Liberal hold |
Party | Candidate | Votes | % | ±% | |
---|---|---|---|---|---|
Liberal | James Moncreiff | Unopposed | |||
Liberal hold |
Party | Candidate | Votes | % | ±% | |
---|---|---|---|---|---|
Liberal | Adam Black | Unopposed | |||
Liberal | James Moncreiff | Unopposed | |||
Registered electors | 8,347 | ||||
Liberal hold | |||||
Liberal hold |
Party | Candidate | Votes | % | ±% | |
---|---|---|---|---|---|
Whig | Adam Black | Unopposed | |||
Radical | Charles Cowan | Unopposed | |||
Registered electors | 8,297 | ||||
Whig hold | |||||
Radical hold |
Party | Candidate | Votes | % | ±% | |
---|---|---|---|---|---|
Whig | Adam Black | 2,429 | 57.6 | +30.4 | |
Peelite | Francis Brown Douglas [25] [26] [27] | 1,786 | 42.4 | +33.3 | |
Majority | 643 | 15.2 | +13.5 | ||
Turnout | 4,215 | 50.8 | −4.4 | ||
Registered electors | 8,297 | ||||
Whig hold | Swing | −1.5 | |||
Party | Candidate | Votes | % | ±% | |
---|---|---|---|---|---|
Whig | Thomas Babington Macaulay | 1,872 | 27.2 | +4.0 | |
Radical | Charles Cowan | 1,754 | 25.5 | −6.9 | |
Radical | Duncan McLaren [30] | 1,559 | 22.7 | N/A | |
Conservative | Thomas Charles Bruce [31] | 1,065 | 15.5 | +0.1 | |
Peelite | Alexander Campbell Cameron [32] [33] [34] | 625 | 9.1 | New | |
Turnout | 3,438 (est) | 55.2 (est) | +10.4 | ||
Registered electors | 6,230 | ||||
Majority | 118 | 1.7 | −12.0 | ||
Whig hold | Swing | +5.5 | |||
Majority | 689 | 10.0 | +6.7 | ||
Radical hold | Swing | −5.5 | |||
Party | Candidate | Votes | % | ±% | |
---|---|---|---|---|---|
Radical | Charles Cowan | Unopposed | |||
Radical hold |
Party | Candidate | Votes | % | ±% | |
---|---|---|---|---|---|
Radical | Charles Cowan | 2,063 | 32.4 | New | |
Whig | William Gibson-Craig | 1,854 | 29.1 | N/A | |
Whig | Thomas Babington Macaulay | 1,477 | 23.2 | N/A | |
Conservative | Peter Blackburn | 980 | 15.4 | New | |
Turnout | 3,187 (est) | 44.8 (est) | N/A | ||
Registered electors | 7,114 | ||||
Majority | 209 | 3.3 | N/A | ||
Radical gain from Whig | Swing | N/A | |||
Majority | 874 | 13.7 | N/A | ||
Whig hold | Swing | N/A | |||
Party | Candidate | Votes | % | ±% | |
---|---|---|---|---|---|
Whig | Thomas Babington Macaulay | 1,735 | 67.6 | N/A | |
Whig | Culling Eardley | 832 | 32.4 | N/A | |
Majority | 903 | 35.2 | N/A | ||
Turnout | 2,567 | 42.0 | N/A | ||
Registered electors | 6,118 | ||||
Whig hold | Swing | N/A | |||
Party | Candidate | Votes | % | ±% | |
---|---|---|---|---|---|
Whig | William Gibson-Craig | Unopposed | |||
Whig hold |
Party | Candidate | Votes | % | ±% | |
---|---|---|---|---|---|
Whig | Thomas Babington Macaulay | Unopposed | |||
Whig | William Gibson-Craig | Unopposed | |||
Registered electors | 5,346 | ||||
Whig hold | |||||
Whig gain from Speaker |
Party | Candidate | Votes | % | ±% | |
---|---|---|---|---|---|
Whig | Thomas Babington Macaulay | Unopposed | |||
Whig hold |
Party | Candidate | Votes | % | ||
---|---|---|---|---|---|
Whig | Thomas Babington Macaulay | Unopposed | |||
Whig gain from Speaker |
Party | Candidate | Votes | % | ||
---|---|---|---|---|---|
Speaker | James Abercromby | Unopposed | |||
Whig | John Campbell | Unopposed | |||
Registered electors | 9,640 | ||||
Speaker gain from Whig | |||||
Whig hold |
Party | Candidate | Votes | % | ||
---|---|---|---|---|---|
Whig | John Campbell | Unopposed | |||
Whig hold |
Party | Candidate | Votes | % | ±% | |
---|---|---|---|---|---|
Whig | James Abercromby | 2,963 | 32.4 | −10.5 | |
Whig | John Campbell | 2,858 | 31.3 | −9.6 | |
Conservative | James Broun-Ramsay | 1,716 | 18.8 | +10.7 | |
Conservative | John Learmonth | 1,608 | 17.6 | +9.5 | |
Majority | 1,142 | 12.5 | -12.2 | ||
Turnout | 4,679 | 59.5 | c. −18.2 | ||
Registered electors | 7,862 | ||||
Whig hold | Swing | −10.3 | |||
Whig hold | Swing | −9.9 | |||
Party | Candidate | Votes | % | ||
---|---|---|---|---|---|
Whig | James Abercromby | Unopposed | |||
Whig hold |
Party | Candidate | Votes | % | ±% | |
---|---|---|---|---|---|
Whig | John Campbell | 1,932 | 50.7 | −33.1 | |
Tory | John Learmonth | 1,401 | 36.7 | +20.5 | |
Radical | James Aytoun | 480 | 12.6 | New | |
Majority | 531 | 14.0 | −10.7 | ||
Turnout | 3,813 | 58.6 | c. −19.1 | ||
Registered electors | 6,512 | ||||
Whig hold | Swing | −26.8 | |||
Party | Candidate | Votes | % | ±% | |
---|---|---|---|---|---|
Whig | Francis Jeffrey | 4,035 | 42.9 | +21.2 | |
Whig | James Abercromby | 3,850 | 40.9 | +19.2 | |
Tory | Forbes Blair | 1,519 | 16.2 | −41.4 | |
Majority | 2,331 | 24.7 | N/A | ||
Turnout | c. 4,702 | c. 77.7 | c. −22.3 | ||
Registered electors | 6,048 | ||||
Whig gain from Tory | Swing | +21.0 | |||
Whig win (new seat) |
Party | Candidate | Votes | % | ||
---|---|---|---|---|---|
Tory | Robert Dundas | 17 | 51.5 | ||
Whig | Francis Jeffrey | 14 | 42.4 | ||
Tory | William Allan | 2 | 6.1 | ||
Majority | 3 | 9.1 | |||
Turnout | 33 | 100.0 | |||
Registered electors | 33 | ||||
Tory hold |
Party | Candidate | Votes | % | ||
---|---|---|---|---|---|
Tory | William Dundas | Unopposed | |||
Registered electors | 33 | ||||
Tory hold |
Party | Candidate | Votes | % | ±% | |
---|---|---|---|---|---|
Tory | William Dundas | Unopposed | N/A | N/A |
Party | Candidate | Votes | % | ±% | |
---|---|---|---|---|---|
Tory | William Dundas | 25 | 89.3 | ||
Whig | James Maitland | 3 | 10.7 | ||
Majority | 22 | 78.6 | |||
Turnout | 28 | ||||
Tory hold | Swing | ||||
Salford was a borough constituency represented in the House of Commons of the Parliament of the United Kingdom. It elected one Member of Parliament (MP) by the first past the post system of election. The borough constituency dated from 1997 and was abolished in 2010, replaced by Salford and Eccles.
Gloucester is a constituency centred on the cathedral city and county town of the same name, represented in the House of Commons of the UK Parliament by Richard Graham of the Conservative Party.
Elgin Burghs was a district of burghs constituency of the House of Commons of Great Britain from 1708 to 1801 and of the House of Commons of the United Kingdom from 1801 to 1918. Until 1832, when Peterhead was added, the constituency comprised the parliamentary burghs of Elgin, Cullen, Banff, Inverurie and Kintore, lying in Elginshire, Banffshire and Aberdeenshire.
Glasgow and Aberdeen Universities, in Scotland, was a university constituency represented in the House of Commons of the Parliament of the United Kingdom from 1868 until 1918. It was merged with the Edinburgh and St Andrews Universities constituency to form the Combined Scottish Universities constituency.
Aberdeen was a burgh constituency of the House of Commons of the Parliament of the United Kingdom from 1832 until 1885. It was represented by one Member of Parliament (MP), elected by the first past the post voting system.
Edinburghshire was a Scottish county constituency of the House of Commons of the Parliament of Great Britain from 1708 to 1801 and of the Parliament of the United Kingdom from 1801 to 1918.
Dundee was a constituency of the House of Commons of the Parliament of the United Kingdom from 1832 to 1950, when it was split into Dundee East and Dundee West.
Paisley was a parliamentary constituency represented in the House of Commons of the Parliament of the United Kingdom from 1832 until 1983, when it was divided into Paisley North and Paisley South. These two constituencies were in turn amalgamated into Paisley and Renfrewshire South and Paisley and Renfrewshire North in 2005.
Greenock was a burgh constituency represented in the House of Commons of the Parliament of the United Kingdom from 1832 until 1974, when it was abolished and its area was merged into the new Greenock and Port Glasgow constituency.
Forfarshire was a Scottish county constituency represented in the House of Commons of Great Britain from 1708 until 1800, and then in the House of Commons of the United Kingdom until 1950.
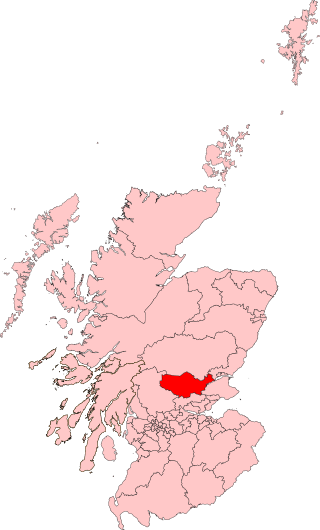
Perth was a constituency of the House of Commons of the Parliament of the United Kingdom from 1832 to 1918, 1918 to 1950, and 1997 to 2005. From 1832 to 1918 it was a burgh constituency. From 1918 to 1950, and 1997 to 2005, it was a county constituency. During each of the three periods it elected one Member of Parliament (MP).
Buteshire was a county constituency of the House of Commons of the Parliament of Great Britain from 1708 to 1801 and of the Parliament of the United Kingdom from 1801 to 1918.
Glasgow was a burgh constituency of the House of Commons of the Parliament of the United Kingdom from 1832 to 1885. It returned two Member of Parliament (MPs) until 1868, and then three from 1868 to 1885. Elections were held using the bloc vote system.
Stirling Burghs was a district of burghs constituency of the House of Commons of the Parliament of the United Kingdom from 1708 to 1918.
Clackmannanshire and Kinross-shire was a constituency of the House of Commons of the Parliament of the United Kingdom from 1832 to 1918.
Athlone was a parliamentary constituency in Ireland, which from 1801 to 1885 returned one Member of Parliament (MP) to the House of Commons of the United Kingdom of Great Britain and Ireland.
Ayr Burghs was a district of burghs constituency of the House of Commons of the Parliament of Great Britain from 1708 to 1800 and of the House of Commons of the Parliament of the United Kingdom from 1801 to 1950. It elected one Member of Parliament (MP), using the first-past-the-post voting system.
Leith Burghs was a district of burghs constituency of the House of Commons of the Parliament of the United Kingdom from 1832 to 1918. The constituency represented the parliamentary burghs of Leith, Musselburgh and Portobello.
The parliamentary borough of Finsbury was a constituency of the House of Commons of the UK Parliament from 1832 to 1885, and from 1918 to 1950. The constituency was first created in 1832 as one of seven two-seat "metropolis" parliamentary boroughs other than the two which already existed: Westminster and the City of London; the latter until 1885 retained an exceptional four seats. Finsbury was directly north of the City of London and was smaller than the Finsbury division of the Ossulstone hundred but took in land of Holborn division to its southwest in pre-introduction changes by Boundary Commissioners. It included Finsbury, Holborn, Moorfields, Clerkenwell, Islington, Stoke Newington and historic St Pancras. The 1918 constituency corresponded to the smaller Metropolitan Borough of Finsbury ; it was a seat, thus electing a single member, fulfilling a longstanding aim of Chartism which underscored the 1832 reforms.
Manchester was a Parliamentary borough constituency in the county of Lancashire which was represented in the House of Commons of the Parliament of the United Kingdom. Its territory consisted of the city of Manchester.