Area is the measure of a region's size on a surface. The area of a plane region or plane area refers to the area of a shape or planar lamina, while surface area refers to the area of an open surface or the boundary of a three-dimensional object. Area can be understood as the amount of material with a given thickness that would be necessary to fashion a model of the shape, or the amount of paint necessary to cover the surface with a single coat. It is the two-dimensional analogue of the length of a curve or the volume of a solid . Two different regions may have the same area ; by synecdoche, "area" sometimes is used to refer to the region, as in a "polygonal area".
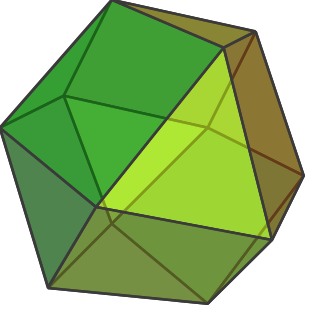
A cuboctahedron is a polyhedron with 8 triangular faces and 6 square faces. A cuboctahedron has 12 identical vertices, with 2 triangles and 2 squares meeting at each, and 24 identical edges, each separating a triangle from a square. As such, it is a quasiregular polyhedron, i.e., an Archimedean solid that is not only vertex-transitive but also edge-transitive. It is radially equilateral. Its dual polyhedron is the rhombic dodecahedron.
In geometry, an octahedron is a polyhedron with eight faces. One special case is the regular octahedron, a Platonic solid composed of eight equilateral triangles, four of which meet at each vertex. Regular octahedra occur in nature as crystal structures. Many types of irregular octahedra also exist, including both convex and non-convex shapes.

In geometry, a hexagon is a six-sided polygon. The total of the internal angles of any simple (non-self-intersecting) hexagon is 720°.

In geometry, a coordinate system is a system that uses one or more numbers, or coordinates, to uniquely determine the position of the points or other geometric elements on a manifold such as Euclidean space. The order of the coordinates is significant, and they are sometimes identified by their position in an ordered tuple and sometimes by a letter, as in "the x-coordinate". The coordinates are taken to be real numbers in elementary mathematics, but may be complex numbers or elements of a more abstract system such as a commutative ring. The use of a coordinate system allows problems in geometry to be translated into problems about numbers and vice versa; this is the basis of analytic geometry.

A chart is a graphical representation for data visualization, in which "the data is represented by symbols, such as bars in a bar chart, lines in a line chart, or slices in a pie chart". A chart can represent tabular numeric data, functions or some kinds of quality structure and provides different info.

An equilateral triangle is a triangle in which all three sides have the same length, and all three angles are equal. Because of these properties, the equilateral triangle is a regular polygon, occasionally known as the regular triangle. It is the special case of an isosceles triangle by modern definition, creating more special properties.
Grid, The Grid, or GRID may refer to:

The triaugmented triangular prism, in geometry, is a convex polyhedron with 14 equilateral triangles as its faces. It can be constructed from a triangular prism by attaching equilateral square pyramids to each of its three square faces. The same shape is also called the tetrakis triangular prism, tricapped trigonal prism, tetracaidecadeltahedron, or tetrakaidecadeltahedron; these last names mean a polyhedron with 14 triangular faces. It is an example of a deltahedron, composite polyhedron, and Johnson solid.

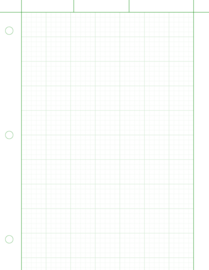
Ruled paper is writing paper printed with lines as a guide for handwriting. The lines often are printed with fine width and in light colour and such paper is sometimes called feint-ruled paper. Additional vertical lines may provide margins, act as tab stops or create a grid for plotting data; for example, graph paper is divided into squares by horizontal and vertical lines.
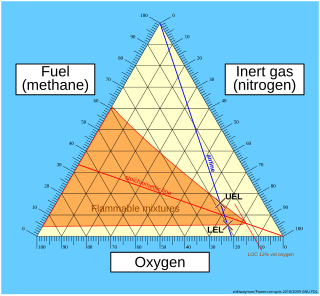
A ternary plot, ternary graph, triangle plot, simplex plot, or Gibbs triangle is a barycentric plot on three variables which sum to a constant. It graphically depicts the ratios of the three variables as positions in an equilateral triangle. It is used in physical chemistry, petrology, mineralogy, metallurgy, and other physical sciences to show the compositions of systems composed of three species. Ternary plots are tools for analyzing compositional data in the three-dimensional case.

In geometry, Napoleon's theorem states that if equilateral triangles are constructed on the sides of any triangle, either all outward or all inward, the lines connecting the centres of those equilateral triangles themselves form an equilateral triangle.

In geometry, a triangular prism or trigonal prism is a prism with 2 triangular bases. If the edges pair with each triangle's vertex and if they are perpendicular to the base, it is a right triangular prism. A right triangular prism may be both semiregular and uniform.

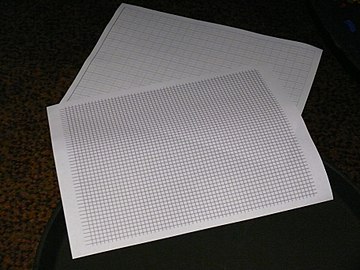
An exercise book or composition book is a notebook that is used in schools to copy down schoolwork and notes. A student will usually have different exercise books for each separate lesson or subject.

A plot is a graphical technique for representing a data set, usually as a graph showing the relationship between two or more variables. The plot can be drawn by hand or by a computer. In the past, sometimes mechanical or electronic plotters were used. Graphs are a visual representation of the relationship between variables, which are very useful for humans who can then quickly derive an understanding which may not have come from lists of values. Given a scale or ruler, graphs can also be used to read off the value of an unknown variable plotted as a function of a known one, but this can also be done with data presented in tabular form. Graphs of functions are used in mathematics, sciences, engineering, technology, finance, and other areas.
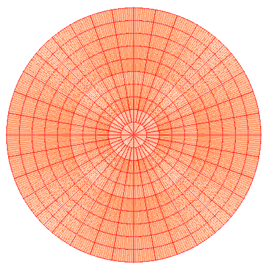
In mathematics, log-polar coordinates is a coordinate system in two dimensions, where a point is identified by two numbers, one for the logarithm of the distance to a certain point, and one for an angle. Log-polar coordinates are closely connected to polar coordinates, which are usually used to describe domains in the plane with some sort of rotational symmetry. In areas like harmonic and complex analysis, the log-polar coordinates are more canonical than polar coordinates.

In the geometry of tessellations, a rep-tile or reptile is a shape that can be dissected into smaller copies of the same shape. The term was coined as a pun on animal reptiles by recreational mathematician Solomon W. Golomb and popularized by Martin Gardner in his "Mathematical Games" column in the May 1963 issue of Scientific American. In 2012 a generalization of rep-tiles called self-tiling tile sets was introduced by Lee Sallows in Mathematics Magazine.
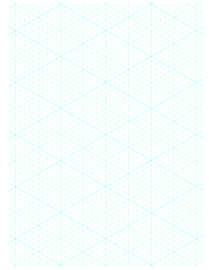
The term isometric comes from the Greek for "having equal measurement".