Wealth in the United States

Last updated

Wealth in the United States is commonly measured in terms of net worth, which is the sum of all assets, including the market value of real estate, like a home, minus all liabilities. [1] The United States is the wealthiest country in the world. [2]

Net worth is the value of all the non-financial and financial assets owned by an institutional unit or sector minus the value of all its outstanding liabilities. Since financial assets minus outstanding liabilities equal net financial assets, net worth can also be conveniently expressed as non-financial assets plus net financial assets. Net worth can apply to companies, individuals, governments or economic sectors such as the sector of financial corporations or to entire countries.

Asset economic resource, from which future economic benefits are expected

In financial accounting, an asset is any resource owned by the business. Anything tangible or intangible that can be owned or controlled to produce value and that is held by a company to produce positive economic value is an asset. Simply stated, assets represent value of ownership that can be converted into cash. The balance sheet of a firm records the monetary value of the assets owned by that firm. It covers money and other valuables belonging to an individual or to a business.

Contents

U.S. Household and Non-Profit Net Worth 1959 - 2016, nominal and real (2016 dollars). It reached a record $93 trillion in Q4 2016. 1-US Household Wealth - Real and Nominal.png
U.S. Household and Non-Profit Net Worth 1959 - 2016, nominal and real (2016 dollars). It reached a record $93 trillion in Q4 2016.

For example, a household in possession of an $800,000 house, $5,000 in mutual funds, $30,000 in cars, $20,000 worth of stock in their own company, and a $45,000 IRA would have assets totaling $900,000. Assuming that this household would have a $250,000 mortgage, $40,000 in car loans, and $10,000 in credit card debt, its debts would total $300,000. Subtracting the debts from the worth of this household's assets (900,000 − $300,000 = $600,000), this household would have a net worth of $600,000. Net worth can vary with fluctuations in value of the underlying assets.

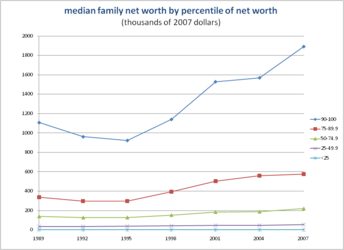
As one would expect, households with greater income often have the highest net worths, though high income cannot be taken as an always accurate indicator of net worth. Overall the number of wealthier households is on the rise, with baby boomers hitting the highs of their careers. [1] In addition, wealth is unevenly distributed, with the wealthiest 25% of US households owning 87% [3] of the wealth in the United States, which was $54.2 trillion in 2009. [4] [5]

Baby boomers are the demographic cohort following the Silent Generation and preceding Generation X. Though there may be a few different timelines said to represent the birth years of the Baby Boom generation, the U.S. Census Bureau and many experts agree that the Baby Boom generation spans 18 birth years from 1946 to 1964. This leaves room for demographers and researchers to define and label cohort subsets if the characteristics and experiences of the youngest or oldest members correlate with or span two generations. When the term "baby boomer" is used in a cultural context, it becomes more difficult to achieve a consensus among scholars, demographers and researchers as to the precise birth years from a cultural perspective.

Wealth inequality in the United States

Wealth inequality in the United States is the unequal distribution of assets among residents of the United States. Wealth includes the values of homes, automobiles, personal valuables, businesses, savings, and investments. The net worth of U.S. households and non-profit organizations was $94.7 trillion in the first quarter of 2017, a record level both in nominal terms and purchasing power parity. If divided equally among 124 million U.S. households, this would be $760,000 per family; however, the bottom 50% of families, representing 62 million American households, average $11,000 net worth. From an international perspective, the difference in US median and mean wealth per adult is over 600%.

U.S. household and non-profit organization net worth rose from $44.2 trillion in Q1 2000 to a pre-recession peak of $67.7 trillion in Q3 2007. It then fell $13.1 trillion to $54.6 trillion in Q1 2009 due to the subprime mortgage crisis. It then recovered, rising consistently to $86.8 trillion by Q4 2015. This is nearly double the 2000 level. [6]

The United States subprime mortgage crisis was a nationwide financial crisis, occurring between 2007 and 2010, that contributed to the U.S. recession of December 2007 – June 2009. It was triggered by a large decline in home prices after the collapse of a housing bubble, leading to mortgage delinquencies and foreclosures and the devaluation of housing-related securities. Declines in residential investment preceded the recession and were followed by reductions in household spending and then business investment. Spending reductions were more significant in areas with a combination of high household debt and larger housing price declines.

Income vs. wealth

While income is often seen as a type of wealth in colloquial language use, wealth and income are two substantially different measures of economic prosperity. Wealth is the total number of net possessions of an individual or household, while income is the total inflow of wealth over a given time period. Hence the change in wealth over that time period is equal to the income minus the expenditures in that period. Income is a so-called "flow" variable, while wealth is a so-called "stock" variable.

Stock and flow

Economics, business, accounting, and related fields often distinguish between quantities that are stocks and those that are flows. These differ in their units of measurement. A stock is measured at one specific time, and represents a quantity existing at that point in time, which may have accumulated in the past. A flow variable is measured over an interval of time. Therefore, a flow would be measured per unit of time. Flow is roughly analogous to rate or speed in this sense.

Changes in wealth, 1989–2001

Year-on-year change in total net worth of US households and nonprofit organizations 1946-2007, unadjusted for inflation or population change. Change in US household wealth 1946-2007.gif
Year-on-year change in total net worth of US households and nonprofit organizations 1946–2007, unadjusted for inflation or population change.

When observing the changes in the wealth among American households, one can note an increase in wealthier individuals and a decrease in the number of poor households, while net worth increased most substantially in semi-wealthy and wealthy households. Overall the percentage of households with a negative net worth (more debt than assets) declined from 9.5% in 1989 to 4.1% in 2001. [1]

The percentage of net worths ranging from $500,000 to one million doubled while the percentage of millionaires tripled. [1] From 1995 to 2004, there was tremendous growth among household wealth, as it nearly doubled from $21.9 trillion to $43.6 trillion, but the wealthiest quartile of the economic distribution made up 89% of this growth. [4] During this time frame, wealth became increasingly unequal, and the wealthiest 25% became even wealthier.

According to US Census Bureau statistics this "Upward shift" is most likely the result of a booming housing market which caused homeowners to experience tremendous increases in home equity. Life-cycles have also attributed to the rising wealth among Americans. With more and more baby-boomers reaching the climax of their careers and the middle aged population making up a larger segment of the population now than ever before, more and more households have achieved comfortable levels of wealth. [1] Zhu Xiao Di (2004) notes that household wealth usually peaks around families headed by people in their 50s, and as a result, the baby boomer generation reached this age range at the time of the analysis. [4]

Changes in wealth after 2007

Household net worth fell from 2007 to 2009 by a total of $17.5 trillion or 25.5%. This was the equivalent loss of one year of GDP. [7] By the fourth quarter of 2010, the household net worth had recovered by a growth of 1.3 percent to a total of $56.8 trillion. An additional growth of 15.7 percent is needed just to bring the value to where it was before the recession started in December 2007. [3] In 2014 a record breaking net worth of $80.7 trillion was achieved. [8]

Mechanisms to gain wealth

Assets are known as the raw materials of wealth, and they consist primarily of stocks and other financial and non-financial property, particularly homeownership. [9] While these assets are unequally distributed, financial assets are much more unequal. In 2004, the top 1% controlled 50.3% of the financial assets while the bottom 90% only held 14.4% of the total US financial assets. [9]

These discrepancies exist despite the availability of many wealth building tools established by the Federal Government. These include 401k plans, 403b plans, and IRAs. Traditional IRAs, 401k and 403b plans are tax shelters created for working individuals. These plans allow for tax sheltered (or pre-tax) contributions of earned income directly to tax sheltered savings accounts. Annual contributions are capped to ensure that high earners cannot enjoy the tax benefit disproportionally. The Roth IRA is another tool that can help create wealth in the working and middle classes.

Assets in Roth IRAs grow tax free; interests, dividends, and capital gains are all exempt from income taxes. Contributions to Roth IRAs are limited to those with annual incomes less than the threshold established yearly by the IRS. The benefits of these plans, however, are only available to workers and families whose incomes and expenses allow them excess funds to commit for a long period, typically until the investor reaches age 59½. The effect of these tools are further limited by the contribution limits placed on them.

Including human capital such as skills, the United Nations estimated the total wealth of the United States in 2008 to be $118 trillion. [10] [11]

Wealth distribution

Wealth distribution in the United States by net worth (2007). [12] The net wealth of many people in the lowest 20% is negative because of debt. [12] By 2014 the wealth gap deepened.

  Top 1% (34.6%)
  Next 4% (27.3%)
  Next 5% (11.2%)
  Next 10% (12%)
  Upper Middle 20% (10.9%)
  Middle 20% (4%)
  Bottom 40% (0.2%)

According to an analysis that excludes pensions and social security, the richest 1% of the American population in 2007 owned 34.6% of the country's total wealth, and the next 19% owned 50.5%. Thus, the top 20% of Americans owned 85% of the country's wealth and the bottom 80% of the population owned 15%. Financial inequality was greater than inequality in total wealth, with the top 1% of the population owning 42.7%, the next 19% of Americans owning 50.3%, and the bottom 80% owning 7%. [13] However, according to the federal reserve, "For most households, pensions and Social Security are the most important sources of income during retirement, and the promised benefit stream constitutes a sizable fraction of household wealth" and "including pensions and Social Security in net worth makes the distribution more even". [14] When including household wealth from pensions and social security, the richest 1% of the American population in 1992 owned 16% of the country's total wealth, as opposed to 32% when excluding pensions and social security.

After the Great Recession which started in 2007, the share of total wealth owned by the top 1% of the population grew from 34.6% to 37.1%, and that owned by the top 20% of Americans grew from 85% to 87.7%. The Great Recession also caused a drop of 36.1% in median household wealth but a drop of only 11.1% for the top 1%. [12] [13]

Income distribution

Note: The IRS specifically warned that changes in their definition of Adjusted Gross Income make it impossible to compare pre-1987 AGI with post-1987 AGI, so keep in mind that comparisons should be in gross income or salary and not in AGI. When reading statistics, it behooves the reader to have this awareness.[ citation needed ]

According to the Congressional Budget Office, between 1979 and 2007 incomes of the top 1% of Americans grew by an average of 275%. During the same time period, the 60% of Americans in the middle of the income scale saw their income rise by 40%. From 1992-2007 the top 400 income earners in the U.S. saw their income increase 392% and their average tax rate reduced by 37%. [15] In 2009, the average income of the top 1% was $960,000 with a minimum income of $343,927. [16] [17] [18]

During the economic expansion between 2002 and 2007, the income of the top 1% grew 10 times faster than the income of the bottom 90%. In this period 66% of total income gains went to the 1%, who in 2007 had a larger share of total income than at any time since 1928. [17] According to PolitiFact and others, the top 400 wealthiest Americans "have more wealth than half of all Americans combined." [19] [20] [21] [22] Inherited wealth may help explain why many Americans who have become rich may have had a "substantial head start". [23] [24] In September 2012, according to the Institute for Policy Studies, "over 60 percent" of the Forbes richest 400 Americans "grew up in substantial privilege". [25]

If a family has a positive net worth then it has more wealth than the combined net worth of over 30.6 million American families. This is because the bottom 25% of American families have a negative combined net worth. [26]

Complications in interpreting income statistics

Interpreting these income statistics is complicated by several factors: membership in the top 1% changes from year to year, the IRS made large changes in the definition of adjusted gross income in 1987, and numbers for particular income ranges may be distorted by outliers (in the top segment) and failure to include transfer payments (in the lower segments).

Income Mobility: The IRS occasionally studies income data from actual households over time, usually over one decade. They actually underestimate income mobility by excluding the most mobile population from their studies: those under age 25.

Most people[ who? ] only look at annual reported income data split into income quintiles. It is erroneous to assume that individual households remain in the same quintile over time, just as it usually is when using aggregate data. A majority of households in the top income quintile in one year, for example, will have moved to a lower quintile within a decade. Three out of four households in the top 0.01% of income will no longer be in that small group ten years later. In summary, half of all of U.S. households move from one income quintile to a different income quintile every decade. And actual households who started a decade in the lowest quintile of income, when tracked over the next ten years, will have proportionally more income growth than actual households who started the decade in the highest quintile of income. Thus, when comparing income/wealth quintile distributions from different time periods, generalizations can only be made with regards to the households in aggregate for each quintile, and can not be made to any individual households over the same time period (i.e. assuming the wealth value has been appropriately adjusted for differences in time, one cannot infer that a decrease in total wealth percentage for one quintile over time means that the households from that quintile have lost wealth as individuals, but only that total wealth percentage has decreased for those in that quintile at the time of measurement).

Top 20% income vs. Bottom 20% income households: (1) The average number of people with jobs in a top income quintile household is two, while a majority of bottom income quintile households have no one employed. (2) If there are two adult income earners in a household who are married, their incomes are combined on tax forms. This is very common among top quintile income households. The lowest quintile households, however, include a lot more single-person households, or two unmarried working adults living together, and sharing expenses, but reporting their incomes to the IRS as if they were two separate households. (3) 75% to 80% of the actual income for bottom quintile households is transfer payments (aka "welfare") that are not included in IRS income data. The top income quintile gets a very small percentage of their actual income from transfer payments.

(4) The IRS warns against comparisons of pre-1987 and post-1987 income data due to significant changes in the definition of adjusted gross income (AGI) that made top quintile households appear to have large reported income gains, when in fact there was no change to their income at all. In addition to the AGI changes, large marginal tax rate reductions during the Reagan Administration caused another large change in tax reporting. A lot of corporate income formerly reported on corporate tax returns was switched to lower tax rate individual tax returns (as Subchapter S corporations). This reporting change appeared to boost top quintile income, when in fact their incomes had not changed. As a result, the top income quintile for households today includes a lot of corporate income previously reported in corporate tax returns, while Subchapter S corporations who lose money are likely to be included in the bottom income quintile households. Income comparisons that compare pre-1987 to post-1987 income are very common, but they are also biased, according to the IRS, and should be ignored. [27]

Impact of age and experience: people that are older and have more experience tend to have considerably larger incomes that younger and inexperienced workers. But all older and experience people were young and inexperienced at one point. So comparing incomes between groups without normalizing for age and experience is somewhat meaningless.

Home ownership and race

Home ownership is one of the main sources of wealth among families in the United States.

Statistics

The total value of all U.S. household wealth in 2000 was approximately $44 trillion. Prior to the Late-2000s recession which began in December 2007 its value was at $65.9 trillion. After, it plunged to $48.5 trillion during the first quarter of 2009. The total household net worth rose 1.3% by the fourth quarter of 2009 to $54.2 trillion, indicating the American economy is recovering.

Family net worth, by selected characteristics of families, 1989–2013 surveys [28]
Thousands of 2013 dollars. Excluding net worth from pensions and social security.
Family characteristic198919921995199820012004200720102013
MedianMeanMedianMeanMedianMeanMedianMeanMedianMeanMedianMeanMedianMeanMedianMeanMedianMean
All families85.06342.380.75303.9487.73323.49102.5405.47113.91522.08114.81553.87135.86625.1782.52530.481.4528.42
Percentile of income
Less than 203.4744.646.454.149.0567.768.2570.8510.37709.1588.249.87118.866.49125.246.287.53
20–39.944.83123.0345.09105.3252.67121.8749.46139.6650.61155.1642.38151.9542.4415129.69139.2721.5111.35
40–59.976.13185.5264.26164.7969.52154.0976.26179.7583.7214.4689.34241.3599.26236.5369.59211.2461.8170.07
60–79.9122.01246.89122.52227.02114.45242.5159.68291.76185.95387.54197.3418.27229.84417.51136.21313.35158.71333.84
80–89.9242.45404.26194.76370.36194.74392.56270.18471.22344.46594.93387.21607.97401.4689.52309.65610.39298.4629.92
90–100713.991818.17592.711565.69542.041669.56646.542218.941095.882968.971141.273130.451257.643712.541275.323114.951134.53248.01
Age of head (years)
Less than 3514.790.0615.0973.7518.2165.713.0195.8915.36111.7617.5190.8313.15119.059.9769.810.4675.43
35–44102.22268.4872.63216.6279.08218.6690.77280.69103.09341.4485.64369.5799.54366.6645.4232.1447.05347.48
45–54177.32509.75127.22437.02140.71456.45151519.66176.39646.15178.93671.14207.72743.79125.55611.01105.35526.04
55–64177.45557.02184.9551.42175.33580.88182.84762.66243.31967.69310.751044.82284.851051.28191.51941.87165.72795.39
65–74140.27528.08160.36468.15168.42531.47209.42667.27233.75888.56234.54853.34268.81137.84221.49902.95232.11047.31
75 or more131.14436.54141.19348.1141.16394.72179.83443.67205.32614.83201.13648.94239.38717.66232.45705.43195611.43
Family structure
Single with child(ren)12.65114.813.7886.2118.21110.4523.02149.9517.12125.0425.4161.1427.77200.216.77153.4514.16129.14
Single, no child, age less than 5514.91135.5324.37114.9326.35110.2322.16131.3125.61196.0926.64192.9228.18233.4215.75126.7214.14148
Single, no child, age 55 or more73.53221.7195.15254.04107.39300.55124.37351.49120.03383.07144.52432.57161.57438.18108.56408.81107.9372.77
Couple with child(ren)113.16367.797.97335.85100.03329.12124.44429.95149.77579.85150.65622.81158.2673.0592.59591.6593.01587.2
Couple, no child202.41644.02167.97513.01175.77551.23212.24689.38230.8846.48257.23928.84251.391065.75219.67921.93213.73941.42
Education of head
No high school diploma43.71150.430.38113.8734.91127.330.02112.7733.37138.3725.4167.9337.16160.4417.47118.5117.25107.73
High school diploma66.34203.5362.39181.5778.52202.2977.41225.4976.17237.9784.35243.3890.39282.760.77231.8952.4199.74
Some college84.34336.9793.99279.9571.83287.13106.59341.4495.86369.185.24380.6694.99412.254.55291.6846.8318.2
College degree204.26671.18161.37553.81158.62589.66209.14759.07281.491050.7279.451052.44319.551233.48207.371039.27218.721015.52
Race or ethnicity of respondent
White non-Hispanic130.47418.12113.25362.34116.57383.13137.21484.34161.39642.12173.84694.21192.58777.65139.05695.69141.9696.51
Nonwhite or Hispanic11.37117.0619.5126.0123.53117.0423.73143.623.66154.3930.64189.131.66257.5521.97188.1118.1184.23
Current work status of head
Working for someone else69.23207.1264.26199.675.14209.0474.91241.8985.88299.3883332.93105.09394.8359.0531962.09314.78
Self-employed306.381201.18238.84977.15236.941071.65355.091320.2459.631639.56428.891755.61436.772196.15304.91842.66359.52121.08
Retired122.32336.74114.55308.21123.25342.96161.96432.95151.66598.88172.38578.11180.99610.28161.29518.84128.5501.09
Other not working1.0584.25.3686.315.5386.565.15154.210.24234.0514.37199.986.4138.7412.75144.389.06135.15
Current occupation of head
Managerial or professional202.05693.66165.37613.03168.17660.62189.84778.16260.151010.06243.421066.24277.561254.73178.221110.19192.61047.79
Technical, sales, or services50.49236.1759.47223.1956.09242.9859.04275.5660.8259.4755.94305.1982.95348.4134.85234.0431.66267.59
Other occupation66.81201.653.24142.1469.37171.5571.19179.8465.21179.0470.07182.0272.7215.7249.92174.0849.24172.31
Retired or other not working79.53284.0981.24255.6194.5290.84117.65384.46126.86539.55136.51519.42144.84536.67100.1438.7290.8431.36
Housing status
Owner181.82492.75161.01439.95157.63463.61188.98580.49226.79736.75227.76772.14263.8874.29185.41758.71195.5773.41
Renter or other3.6276.295.2862.97.3266.6661.826.3372.394.9966.835.7380.015.4760.795.470.39
Percentile of net worth
Less than 250.2-0.980.81-0.911.44-0.230.71-2.641.580.12.1-1.641.47-2.36-13.01-12.97
25–49.937.9641.8438.3141.3842.9946.4946.9551.4253.8458.3953.7658.1660.8765.2734.6238.1931.3635.86
50–74.9157.8162.17142.82147.45144.38151.23172.63183.98207.36219.86210.99229.18247.68255.71168.04180.14168.23177.71
75–89.9382.57411.6332.1355.92336.53362.35444.48461.3566.59594.04628.78652.2642.46660.23514.33562.65505.08546.25
90–1001249.032294.41085.342035.371038.762196.9712872779.651729.243631.651762.783845.832130.174462.991997.433945.861871.63962.43
† Less than 0.05 ($50).

See also

Related Research Articles

Clarkson Valley, Missouri City in Missouri, United States

Clarkson Valley is a city in St. Louis County, Missouri, United States. The population was 2,632 at the 2010 census.

Hulmeville, Pennsylvania Borough in Pennsylvania, United States

Hulmeville is a borough in Bucks County, Pennsylvania, United States. The population was 1,003 at the 2010 census.

Cathcart, Washington CDP in Washington, United States

Cathcart is a census-designated place (CDP) in Snohomish County, Washington, United States. The population was 2,458 at the 2010 census. Based on per capita income, one of the more reliable measures of affluence, Cathcart ranks 45th of 522 areas in the state of Washington to be ranked. Cathcart was named for Isaac Cathcart, a businessperson in the lumber industry.

Warm Beach, Washington CDP in Washington, United States

Warm Beach is a census-designated place (CDP) in Snohomish County, Washington, United States. The population was 2,437 at the 2010 census.

Fairwood, Spokane County, Washington CDP in Washington, United States

Fairwood is a census-designated place (CDP) in Spokane County, Washington, United States. The population was 7,905 at the 2010 census.

Social class in the United States

Social class in the United States is a controversial issue, having many competing definitions, models, and even disagreements over its very existence. Many Americans believe that in the country there are just three classes: the American rich; the American middle class; the American poor. More complex models that have been proposed describe as many as a dozen class levels; while still others deny the very existence, in the European sense, of social class in American society. Most definitions of class structure group people according to wealth, income, education, type of occupation, and membership in a specific subculture or social network. Most of the social classes entirely ignore the existence of parallel Black, Hispanic and minorities societies.

Upper middle class sociological concept

In sociology, the upper middle class is the social group constituted by higher status members of the middle class. This is in contrast to the term lower middle class, which is used for the group at the opposite end of the middle-class stratum, and to the broader term middle class. There is considerable debate as to how the upper middle class might be defined. According to sociologist Max Weber the upper middle class consists of well-educated professionals with postgraduate degrees and comfortable incomes.

Median income is the amount that divides the income distribution into two equal groups, half having income above that amount, and half having income below that amount. Mean income (average) is the amount obtained by dividing the total aggregate income of a group by the number of units in that group. Mode income is the most frequently occurring income in a given income distribution.

A reference group is a group to which an individual or another group is compared. Ie: Demographic Sociologists call any group that individuals use as a standard for evaluating themselves and their own behavior a reference group.

Household income in the United States US family income

Household income is an economic measure that can be applied to one household, or aggregated across a large group such as a county, city, or the whole country. It is commonly used by the United States government and private institutions to describe a household's economic status or to track economic trends in the US.

Home-ownership in the United States

The home-ownership rate in the United States is percentage of homes that are owned by their occupants. In 2009, it remained similar to that in some other post-industrial nations with 67.4% of all occupied housing units being occupied by the unit's owner. Home ownership rates vary depending on demographic characteristics of households such as ethnicity, race, type of household as well as location and type of settlement. In 2018, homeownership dropped to a lower rate than it was in 1994, with a rate of 64.2%.

The American middle class is a social class in the United States. While the concept is typically ambiguous in popular opinion and common language use, contemporary social scientists have put forward several ostensibly congruent theories on the American middle class. Depending on the class model used, the middle class constitutes anywhere from 25% to 66% of households.

Educational attainment in the United States

The educational attainment of the U.S. population is similar to that of many other industrialized countries with the vast majority of the population having completed secondary education and a rising number of college graduates that outnumber high school dropouts. As a whole, the population of the United States is spending more years in formal educational programs. As with income, levels differ by race, age, household configuration and geography.

Income in the United States

Income in the United States is measured by the United States Department of Commerce either by household or individual. The differences between household and personal income is considerable since 42% of households, the majority of those in the top two quintiles with incomes exceeding $57,658, now have two income earners.

Personal income in the United States

Personal income is an individual's total earnings from wages, investment interest, and other sources. The Bureau of Labor Statistics reported a median personal income of $865 weekly for all full-time workers in 2017. The U.S Bureau of the Census has the annual median personal income at $31,099 in 2016. Inflation-adjusted ("real") per-capita disposable personal income rose steadily in the U.S. from 1945 to 2008, but has since remained generally level.

The terms average Joe, ordinary Joe, Joe Sixpack, Joe Lunchbucket, Joe Snuffy, Joe Schmo and ordinary Jane, average Jane, and plain Jane, are used primarily in North America to refer to a completely average person, typically an average American. It can be used both to give the image of a hypothetical "completely average person" or to describe an existing person. Parallel terms in other languages for local equivalents exist worldwide.

American lower class

In the United States, the lower class are those at or near the lower end of the socio-economic hierarchy. As with all social classes in the United States, the lower class is loosely defined and its boundaries and definitions subject to debate and ambiguous popular opinions. Sociologists such as W. Lloyd Warner, Dennis Gilbert and James Henslin divide the lower classes into two. The contemporary division used by Gilbert divides the lower class into the working poor and underclass. Service and low-rung manual laborers are commonly identified as being among the working poor. Those who do not participate in the labor force and rely on public assistance as their main source of income are commonly identified as members of the underclass. Overall the term describes those in easily filled employment positions with little prestige or economic compensation who often lack a high school education and are to some extent disenfranchised from mainstream society.

Income in the United Kingdom National income overview

In terms of global poverty criteria, the United Kingdom is a wealthy country, with virtually no people living on less than £4 a day. In 2012–13, median personal income was approximately £21,000 a year but varies considerably by age, location, data source and occupation. There is both significant income redistribution and income inequality; for instance, in 2013/14 income in the top and bottom fifth of households was £80,800 and £5,500, respectively, before taxes and benefits (15:1). After tax and benefits, household income disparities are significantly reduced to £60,000 and £15,500 (4:1).

In sociology, the upper middle class of the United States is the social group constituted by higher-status members of the middle class. This is in contrast to the term lower middle class, which refers to the group at the opposite end of the middle class scale. There is considerable debate as to how the upper middle class might be defined. According to Max Weber, the upper middle class consists of well-educated professionals with graduate degrees and comfortable incomes.

In the United States, despite the efforts of equality proponents, income inequality persists among races and ethnicities. Asian Americans have the highest average income, followed by white Americans, Latino Americans, African Americans, and Native Americans. A variety of explanations for these differences have been proposed—such as differing access to education, two parent home family structure, high school dropout rates and experience of discrimination—and the topic is highly controversial.

References

  1. 1 2 3 4 5 "US Federal Reserve on wealth distribution in the United States" (PDF). Retrieved 2006-07-12.
  2. "America Is the Richest, and Most Unequal, Country".
  3. 1 2 "Americans' net worth up for 3rd straight quarter". U.S. Federal Reserve. 2010-03-11. Archived from the original on March 13, 2010. Retrieved 2010-03-11.
  4. 1 2 3 "Growing Wealth, Inequality, and Housing in the United States." Zhu Xiao Di. Feb. 2007. Joint Center for Housing Studies.
  5. "Wealth Inequality: Data and Models." Marco Cagetti and Mariacristina De Nardi. Aug. 2005. Federal Reserve Bank of Chicago.
  6. "Households and Nonprofit Organizations; Net Worth, Level". 7 June 2018.
  7. Broder, David (4 February 2010). "Syndicated column:A sobering message. Budget show US on 'unsustainable path'". Melbourne, Florida: Florida Today. pp. 11A.
  8. "Archived copy". Archived from the original on 2015-05-16. Retrieved 2015-07-28.CS1 maint: Archived copy as title (link)
  9. 1 2 Haskins, Ron: "Wealth and Economic Mobility". Economic Mobility Project, 2007.
  10. Sponsored by (2012-06-30). "Free exchange: The real wealth of nations". The Economist. Retrieved 2012-07-14.
  11. "Inclusive Wealth Report - IHDP". Ihdp.unu.edu. 2012-07-09. Archived from the original on 2012-06-30. Retrieved 2012-07-14.
  12. 1 2 3 Recent Trends in Household Wealth in the United States: Rising Debt and the Middle-Class Squeeze—an Update to 2007 by Edward N. Wolff, Levy Economics Institute of Bard College, March 2010
  13. 1 2 Wealth, Income, and Power by G. William Domhoff of the UC-Santa Cruz Sociology Department
  14. Pensions, Social Security, and the Distribution of Wealth by Arthur B. Kennickell and Annika E. Sundén of Board of Governors of the Federal Reserve System
  15. Dave Gilson and Carolyn Perot, "It's the Inequality, Stupid", Mother Jones, March/April 2011 Issue
  16. Who are the 1 percent?, CNN, October 29, 2011
  17. 1 2 "Tax Data Show Richest 1 Percent Took a Hit in 2008, But Income Remained Highly Concentrated at the Top. Recent Gains of Bottom 90 Percent Wiped Out." Center on Budget and Policy Priorities. Accessed October 2011.
  18. Robert Pear, "Top Earners Doubled Share of Nation's Income, Study Finds", New York Times, October 25, 2011
  19. Kertscher, Tom; Borowski, Greg (March 10, 2011). "The Truth-O-Meter Says: True - Michael Moore says 400 Americans have more wealth than half of all Americans combined". PolitiFact . Retrieved August 11, 2013.
  20. Moore, Michael (March 6, 2011). "America Is Not Broke". Huffington Post . Retrieved August 11, 2013.
  21. Moore, Michael (March 7, 2011). "The Forbes 400 vs. Everybody Else". michaelmoore.com. Archived from the original on 2011-03-09. Retrieved 2014-08-28.
  22. Pepitone, Julianne (September 22, 2010). "Forbes 400: The super-rich get richer". CNN . Retrieved August 11, 2013.
  23. Bruenig, Matt (March 24, 2014). "You call this a meritocracy? How rich inheritance is poisoning the American economy". Salon . Retrieved August 24, 2014.
  24. Staff (March 18, 2014). "Inequality - Inherited wealth". The Economist . Retrieved August 24, 2014.
  25. Pizzigati, Sam (September 24, 2012). "The 'Self-Made' Hallucination of America's Rich". Institute for Policy Studies . Retrieved August 24, 2014.
  26. Summary Results; Public Date, Estimates inflation-adjusted to 2013 dollars, Table 4; Population number in: Changes in U.S. Family Finances(pdf); Also see table below in Statistics
  27. Addition reading on income mobility: http://research.stlouisfed.org/publications/es/11/ES1115.pdf
  28. Summary Results, Public Date, Estimates inflation-adjusted to 2013 dollars, Table 4