Pacific Islands Americans

Last updated

Pacific Islands Americans
Oceanian Americans
Total population
608,219 alone
0.2% of the total U.S. population (2017) [1]
1,225,195 alone or in combination
0.4% of the total U.S. population (2010 Census)
Regions with significant populations
Flag of American Samoa.svg  American Samoa, Flag of Guam.svg  Guam,
Flag of the Northern Mariana Islands.svg  Northern Mariana Islands,
Flag of California.svg  California, Flag of Hawaii.svg  Hawaii, Flag of Washington.svg  Washington, Flag of Oregon.svg  Oregon, Flag of Nevada.svg  Nevada, Flag of Alaska.svg  Alaska,
Flag of Texas.svg  Texas, Flag of Florida.svg  Florida
Languages
American English, Polynesian languages, Micronesian languages
Religion
Christianity, Polytheism, Bahá'í, Judaism, Hinduism, Buddhism, Taoism, Islam, Sikhism, Jainism, Confucianism, Druze
Related ethnic groups
Pacific Islanders, Austronesians

Pacific Islands Americans, also known as Oceanian Americans, Pacific Islander Americans or Native Hawaiian and/or other Pacific Islander Americans, are Americans who have ethnic ancestry among the indigenous peoples of Oceania (viz. Polynesians, Melanesians and Micronesians). For its purposes, the U.S. Census also counts Indigenous Australians as part of this group. [2] [3]

Contents

Pacific Islander Americans make up 0.5% of the U.S. population including those with partial Pacific Islander ancestry, enumerating about 1.4 million people. The largest ethnic subgroups of Pacific Islander Americans are Native Hawaiians, Samoans, Chamorros, Fijians, Palauans and Tongans. Native Hawaiians, Samoans, Tongans, and Chamorros have large communities in Hawaii, California, Utah, American Samoa, Guam and the Northern Mariana Islands, with sizable communities in Washington, Nevada, Oregon, Texas, Florida, and Alaska. Fijians are predominantly based in California.

American Samoa, Guam, and the Northern Mariana Islands are insular areas (U.S. territories), while Hawaii is a state.

History

The US occupied Hawaii in 1896, the Mariana Islands in 1898 and American Samoa in 1899. [4] From then on, the emigration of the Pacific Islanders to the US began, being initiated by the natives of those islands. While the emigration of Pacific Islanders to the US was small until the end of World War II, when many islanders (at least Tongan missionaries) emigrated to the United States. Emigration was increasing progressively and by the end of the 60s there were hundreds of indigenous people from Oceania who emigrated to the US, especially thanks to the increase in Fijian migration (one of the main groups of Pacific Islanders in the US, which exceeded one hundred immigrants in this age). However, the first great wave of Pacific Islanders came from the 70s, a decade in which the emigration of Tonga, Fiji and Micronesia was markedly increased (more than 1,000 Fijians emigrated to the US in the 1970s). Many of these people emigrated to the US to study at its universities. [5] In addition, in the 1980s, Marshallese emigration to the USA began, when this country gave sovereignty to the Marshall Islands through an agreement called the Compact of Free Association. The Tyson Foods company (which employed a significant part of the population of the islands) relocated many of its Marshellese employees in Springdale, Arkansas, where the company is based. [6] Since then, the emigration of Pacific Islanders has been significant in the US.

Population

In the 2000 and 2010 U.S. Census, the term "Native Hawaiian or other Pacific Islander" refers to people having origins in any of the original peoples of Hawaii, Guam, Tonga, Samoa, Fiji, New Zealand and the Marshalls or other Pacific Islands.

In the 2010 census 1,225,195 Americans claimed "'Native Hawaiian or other Pacific Islander'" as their race alone or in combination.

Pacific Islands Americans in the 2000 [7] 2010 U.S. Census [8] (From over 1,000 people)

Ancestry20002000 % of Pacific Islands American population20102010 % of Pacific Islands American population
Flag of Fiji.svg Fijian 13,5811.6%32,3042.6%
Flag of French Polynesia.svg French Polynesian 3,3130.4%5,0620.4%
Flag of the Marshall Islands.svg Marshallese 6,6500.8%22,4341.8%
"Micronesian" (not specified)9,9401.1%29,1122.4%
Flag of Federated States of Micronesia.svg Micronesian (FSM) 1,9480.2%8,1850.7%
Flag of New Zealand.svg Polynesians with New Zealand citizenship (Māori, Tokelauans, Niueans, Cook Islanders)2,422 (Māori: 1,994; Tokelauans: 574)0.3%925 (Tokelauans only)0.1%
Flag of the Northern Mariana Islands.svg Flag of Guam.svg Chamorro 93,237 (Guamanian or Chamorro: 92,611; Saipanese: 475; Mariana Islander: 141)10.7%148,220 (Guamanian or Chamorro: 147,798; Saipanese: 1,031; Mariana Islander: 391)12.2%
Flag of Hawaii.svg Native Hawaiians 401,16245.9%527,07743.0%
Flag of Palau.svg Palauan 3,4690.4%7,4500.6%
"Polynesian" (not specified)8,7961.0%9,1530.7%
Flag of American Samoa.svg Flag of Samoa.svg Samoan 133,28115.2%184,44015.1%
Flag of Tonga.svg Tongan 36,8404.2%57,1834.7%
Others188,389%241,952%
TOTAL874,414100.0%1,225,195100.0%

Location

State/territoryPacific Islands
Americans alone
(2010 US Census) [9]
Pacific Islands Americans
alone or in combination
(2010 US Census) [10]
Percentage
(Pacific Islands
Americans alone) [note 1]
Flag of Alabama.svg  Alabama 5,2087,9840.1%
Flag of Alaska.svg  Alaska 7,66211,3601.0%
Flag of American Samoa.svg  American Samoa 51,403 [11] 52,790 [12] 92.6% [13]
Flag of Arizona.svg  Arizona 16,11228,4310.2%
Flag of Arkansas.svg  Arkansas 6,6858,5970.2%
Flag of California.svg  California 181,431320,0360.8%
Flag of Colorado.svg  Colorado 8,42016,8230.1%
Flag of Connecticut.svg  Connecticut 3,4916,8640.0%
Flag of Delaware.svg  Delaware 6901,4230.0%
Flag of Washington, D.C..svg  District of Columbia 7701,514-
Flag of Florida.svg  Florida 18,79043,416-
Flag of Georgia (U.S. state).svg Georgia 10,45418,5870.1%
Flag of Guam.svg  Guam 78,582 [14] 90,238 [15] 49.3% [16]
Flag of Hawaii.svg  Hawaii 138,292358,95110.0%
Flag of Idaho.svg  Idaho 2,7865,5080.1%
Flag of Illinois.svg  Illinois 7,43615,873-
Flag of Indiana.svg  Indiana 3,5327,3920.1%
Flag of Iowa.svg  Iowa 2,4194,1730.1%
Flag of Kansas.svg  Kansas 2,8645,4450.1%
Flag of Kentucky.svg  Kentucky 3,1995,6980.1%
Flag of Louisiana.svg  Louisiana 2,5885,333-
Flag of Maine.svg  Maine 3771,008-
Flag of Maryland.svg  Maryland 5,39111,553-
Flag of Massachusetts.svg  Massachusetts 5,97112,369-
Flag of Michigan.svg  Michigan 3,44210,010<0.1%
Flag of Minnesota.svg  Minnesota 2,9586,8190.0%
Flag of Mississippi.svg  Mississippi 1,7003,228-
Flag of Missouri.svg  Missouri 7,17812,1360.1%
Flag of Montana.svg  Montana 7341,7940.1%
Flag of Nebraska.svg  Nebraska 2,0613,5510.1%
Flag of Nevada.svg  Nevada 19,30735,4350.6%
Flag of New Hampshire.svg  New Hampshire 5321,236-
Flag of New Jersey.svg  New Jersey 7,73115,777-
Flag of New Mexico.svg  New Mexico 3,1325,7500.1%
Flag of New York.svg  New York 24,00045,8010.1%
Flag of North Carolina.svg  North Carolina 10,30917,8910.1%
Flag of North Dakota.svg  North Dakota 3348010.1%
Flag of the Northern Mariana Islands.svg  Northern Mariana Islands 18,800 [17] 24,891 [18] 34.9% [19]
Flag of Ohio.svg  Ohio 5,33611,3800.03%
Flag of Oklahoma.svg  Oklahoma 5,3549,0520.1%
Flag of Oregon.svg  Oregon 14,64926,9360.4%
Flag of Pennsylvania.svg  Pennsylvania 7,11514,662-
Flag of Puerto Rico.svg  Puerto Rico 370 [20] [21] 555 [22] 0.0%
Flag of Rhode Island.svg  Rhode Island 1,6022,8030.1%
Flag of South Carolina.svg  South Carolina 3,9576,9880.1%
Flag of South Dakota.svg  South Dakota 5171,0400.1%
Flag of Tennessee.svg  Tennessee 5,4269,3590.1%
Flag of Texas.svg  Texas 31,24254,8010.1%
Flag of Utah.svg  Utah 26,04937,9941.3%
Flag of Vermont.svg  Vermont 175476-
Flag of the United States Virgin Islands.svg Virgin Islands (U.S.) 16 [23] 212 [24] 0.0%
Flag of Virginia.svg  Virginia 8,20117,2330.1%
Flag of Washington.svg  Washington 43,50573,2130.6%
Flag of West Virginia.svg  West Virginia 4851,295-
Flag of Wisconsin.svg  Wisconsin 2,5055,558-
Flag of Wyoming.svg  Wyoming 5211,1370.1%
Flag of the United States.svg  United States 674,6251,332,4940.2%

Micronesian Americans

Micronesian Americans are Americans of Micronesian descent.

According to the 2010 census, the largest Chamoru populations were located in California, Washington and Texas, but their combined number from these three states totaled less than half the number living throughout the U.S. It also revealed that the Chamoru people are the most geographically dispersed Oceanic ethnicity in the country. [25]

Marshallese Americans or Marshallese come from the Marshall Islands. In the 2010 census 22,434 Americans identified as being of Marshallese descent.

Because of the Marshall Islands entering the Compact of Free Association in 1986, Marshallese have been allowed to migrate and work in the United States. There are many reasons why Marshallese came to the United States. Some Marshallese came for educational opportunities, particularly for their children. Others sought work or better health care than what is available in the islands. Massive layoffs by the Marshallese government in 2000 led to a second big wave of immigration.

Arkansas has the largest Marshallese population with over 6,000 residents. Many live in Springdale, and the Marshallese comprise over 5% of the city's population. Other significant Marshallese populations include Spokane and Costa Mesa.

Polynesian Americans

Polynesian Americans are Americans of Polynesian descent.

Large subcategories of Polynesian Americans include Native Hawaiians and Samoan Americans. In addition there are smaller communities of Tongan Americans (see Culture and diaspora of Tonga), French Polynesian Americans, and Māori Americans.

A Samoan American is an American who is of ethnic Samoan descent from either the independent nation Samoa or the American territory of American Samoa. Samoan American is a subcategory of Polynesian American. About 55,000 people live on American Samoa, while the US census in 2000 and 2008 has found 4 times the number of Samoan Americans live in the mainland USA.

California has the most Samoans; concentrations live in the San Francisco Bay Area, Los Angeles County, and San Diego County. San Francisco has approximately 2,000 people of Samoan ancestry, and other Bay Area cities such as East Palo Alto and Daly City have Samoan communities. In Los Angeles County, Long Beach and Carson have abundant Samoan communities, as well as in Oceanside in San Diego County. [26] [27] [28] Other West Coast metropolitan areas such as Seattle have strong Samoan communities, mainly in King County and in Tacoma. Anchorage, Alaska, and Honolulu, Hawaii, both have thousands of Samoan Americans residing in each city.

Persons born in American Samoa are United States nationals, but not United States citizens. [29] (This is the only circumstance under which an individual would be one and not the other.) For this reason, Samoans can move to Hawaii or the mainland United States and obtain citizenship comparatively easily. Like Hawaiian Americans, the Samoans arrived in the mainland in the 20th century as agricultural laborers and factory workers.

Elsewhere in the United States, Samoan Americans are plentiful throughout the state of Utah, as well as in Killeen, Texas; Norfolk, Virginia; and Independence, Missouri.

A Tongan American is an American who is of ethnic Tongan descent. Utah has the largest Tongan American population and Hawaii has the second largest. Many of the first Tongan Americans came to the United States in connection to the LDS Church.

Military

Based on 2003 recruiting data, Pacific Islander Americans were 249% over-represented in the military. [30]

American Samoans are distinguished among the wider Pacific Islander group for enthusiasm for enlistment. In 2007, a Chicago Tribune reporter covering the island's military service noted, "American Samoa is one of the few places in the nation where military recruiters not only meet their enlistment quotas but soundly exceed them." [31] As of 23 March 2009 there have been 10 American Samoans who have died in Iraq, and 2 who have died in Afghanistan. [32]

Pacific Islander Americans are also represented in the Navy SEALS, making up .6% of the enlisted and .1% of the officers. [33]

See also

Notes

  1. Percentage of the state population that identifies itself as Pacific Islanders relative to the state/territory population as a whole — the percentage is of Pacific Islands Americans alone.

Related Research Articles

Micronesia Subregion of Oceania

Micronesia is a subregion of Oceania, composed of thousands of small islands in the western Pacific Ocean. It has a close shared cultural history with two other island regions: Polynesia to the east and Island Melanesia to the south; as well as with the wider Austronesian peoples.

Hawaiian Paradise Park, Hawaii Census-designated place in the United States

Hawaiian Paradise Park, also referred to as Paradise Park and known by many as HPP, is a census-designated place (CDP) in Hawaiʻi County, Hawaiʻi, United States, located in the District of Puna. The population was 11,404 at the 2010 census, up from 7,051 at the 2000 census.

Pacific Islander indigenous peoples of the Pacific Islands

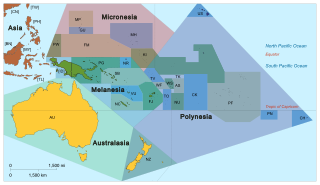
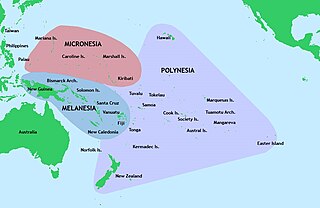
Pacific Islanders, or Pasifika, are the peoples of the Pacific Islands. It is a geographic and ethnic/racial term to describe the inhabitants and diaspora of any of the three major sub-regions of Oceania: Micronesia, Melanesia, and Polynesia. These people speak various Austronesian languages. It is not used to describe non-native inhabitants of the Pacific islands.

Polynesia is a group of island chains spread across much of the Pacific Ocean, and includes many countries and territories. Internationally, Polynesian music is mostly associated with twinkling guitars, grass skirts and beautiful relaxing sounds, Hawaiian hula and other tourist-friendly forms of music. While these elements are justifiably a part of Polynesian history and Polynesian culture, there is actually a wide variety of music made in the far-flung reaches of Polynesia.

Polynesians are an ethnolinguistic group of closely related peoples who are native to Polynesia, an expansive region of Oceania in the Pacific Ocean. They trace their origins to Island Southeast Asia and are part of the larger Austronesian ethnolinguistic group with an Urheimat in Taiwan. They speak the Polynesian languages, a branch of the Oceanic subfamily of the Austronesian language family.

Territories of the United States Political division that is directly overseen by the United States federal government

Territories of the United States are sub-national administrative divisions overseen by the United States government. The various U.S. territories differ from the U.S. states and Native American tribes in that they are not sovereign entities. They are classified by incorporation and whether they have an "organized" government through an organic act passed by Congress. All U.S. territories are part of the United States, but the unincorporated territories are not considered to be integral parts of the United States, and the Constitution of the United States applies only partially in those territories.

Fijians are a nation and ethnic group native to Fiji, who speak Fijian and share a common history and culture.

Polynesian culture the culture of the indigenous people of the Polynesian islands.

Polynesian culture is the culture of the indigenous peoples of Polynesia who share common traits in language, customs and society. Sequentially, the development of Polynesian culture can be divided into four different historical eras:

Samoan Americans are Americans of Samoan origin, including those who emigrated from the Independent State of Samoa or American Samoa to the United States. However they are not American Citizens. Samoan Americans are Pacific Islanders in the United States Census, and are the second largest Pacific Islander group in the U.S., after Native Hawaiians.

The indigenous peoples of Oceania are Polynesians, Melanesians, Micronesians, Papuans and Australian Aboriginals. With the notable exceptions of Australia, New Zealand, Hawaii, New Caledonia and Guam, indigenous peoples make up the majority of the populations of Oceania.

Race and ethnicity in the United States is a complex topic because the United States of America has a racially and ethnically diverse population. At the federal level, race and ethnicity have been categorized separately.

The Rotumans are the indigenous inhabitants of Rotuma, a small island group forming part of the Republic of Fiji. The island itself is a cultural melting pot at the crossroads of the Micronesian, Melanesian and Polynesian divisions of the Pacific Ocean, and due to the seafaring nature of traditional Pacific cultures, the indigenous Rotuman have adopted or share many aspects of its multifaceted culture with its Melanesian, Micronesian and Polynesian neighbours.

Micronesian Americans are Americans who are descended from people of the Federated States of Micronesia. According to the 2010 census, a total of 8,185 residents self-identified as having origins in the country, which consists of four states. More than half of these residents identified their origin as Chuuk State (4,211) with the rest as follows: 2,060 people from Pohnpei, 1,018 from Yap, and 906 people from Kosrae.

Polynesia Subregion of Oceania

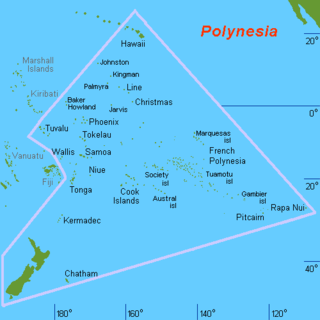
Polynesia is a subregion of Oceania, made up of more than 1,000 islands scattered over the central and southern Pacific Ocean. The indigenous people who inhabit the islands of Polynesia are termed Polynesians, sharing many similar traits including language family, culture and beliefs. Historically, they had a strong tradition of sailing and using stars to navigate at night. The largest country in Polynesia is New Zealand.

Asian Pacific American

Asian-Pacific American (APA) or Asian-Pacific Islander (API) is a term sometimes used in the United States to include both Asian Americans and Pacific Islands Americans.

Tongan Americans are Americans who can trace their ancestry to Tonga, officially known as the Kingdom of Tonga. There are approximately 57,000 Tongans and Tongan Americans living in the United States, as of 2012. Tongans are considered to be Pacific Islanders in the United States Census, and are the fourth largest Pacific Islander American group in terms of population, after Native Hawaiians, Samoan Americans, and Guamanian/Chamorro Americans.

Mormonism and Pacific Islanders

Relations between The Church of Jesus Christ of Latter-day Saints and the natives of the Pacific Island groups of Polynesia, Melanesia, Micronesia and surrounding island groups are quite complex.

Marshallese Americans are Americans of Marshallese descent or Marshallese people naturalized in the United States. According to the 2010 census, 22,434 people of Marshallese origin live in the United States. The United States has the highest concentration of Marshallese people outside the Marshall Islands. Most of these Marshallese people live in Hawaii and Arkansas.

References

  1. "Pacific Islanders 2017 Origin: 2017". US Census Bureau.
  2. University of Virginia. Geospatial and Statistical Data Center. "1990 PUMS Ancestry Codes." 2003. August 30, 2007. "Archived copy". Archived from the original on August 25, 2007. Retrieved August 31, 2007.CS1 maint: archived copy as title (link)
  3. "Clark Library - U-M Library". www.lib.umich.edu.
  4. > "American Samoa Office of Insular Affairs". www.doi.gov. U.S. Department of the Interior. June 11, 2015.
  5. "Micronesians Abroad", Micronesian Counselor, published by Micronesian Seminar, authored by Francis X. Hezel and Eugenia Samuel, number 64, December 2006, retrieved 8 July 2013
  6. Marshallese immigration. Consulted on 25 October 2013, to 1:30 am.
  7. The Native Hawaiian and Other Pacific Islander Population, Census 2000
  8. The Native Hawaiian and Other Pacific Islander Population: 2010 Census, 2010 Census Briefs, United States Bureau of the Census, May 2012
  9. US Census Bureau: " Annual Estimates of the Resident Population by Sex, Race, and Hispanic Origin for the United States, States, and Counties: April 1, 2010 to July 1, 2015" retrieved September 05, 2016 - select state from drop-down menu
  10. US Census Bureau: " Annual Estimates of the Resident Population by Sex, Race, and Hispanic Origin for the United States, States, and Counties: April 1, 2010 to July 1, 2015" retrieved September 05, 2016 - select state from drop-down menu
  11. Bureau, U. S. Census. "American FactFinder - Results". factfinder.census.gov.
  12. Bureau, U. S. Census. "American FactFinder - Results". factfinder.census.gov.
  13. https://www.indexmundi.com/american_samoa/demographics_profile.html Indexmundi.com. American Samoa. Retrieved October 8, 2018.
  14. Bureau, U. S. Census. "American FactFinder - Results". factfinder.census.gov.
  15. Bureau, U. S. Census. "American FactFinder - Results". factfinder.census.gov.
  16. https://www.indexmundi.com/guam/demographics_profile.html Indexmundi.com. Guam. Retrieved October 8, 2018.
  17. Bureau, U. S. Census. "American FactFinder - Results". factfinder.census.gov.
  18. Bureau, U. S. Census. "American FactFinder - Results". factfinder.census.gov.
  19. https://www.indexmundi.com/northern_mariana_islands/demographics_profile.html Indexmundi.com. Northern Mariana Islands. Retrieved October 8, 2018.
  20. https://factfinder.census.gov/faces/tableservices/jsf/pages/productview.xhtml?src=bkmk American FactFinder. Race and Hispanic or Latino Origin: 2010. 2010 Census Summary File 1. Retrieved November 9, 2018.
  21. https://suburbanstats.org/race/puerto-rico/how-many-native-hawaiian-pacific-islander-people-live-in-puerto-rico Suburbanstats.org. Pacific Islanders in Puerto Rico. Retrieved October 10, 2018.
  22. NATIVE HAWAIIAN AND OTHER PACIFIC ISLANDER ALONE OR IN COMBINATION WITH ONE OR MORE OTHER RACES (in Puerto Rico)
  23. https://factfinder.census.gov/faces/tableservices/jsf/pages/productview.xhtml?pid=DEC_10_VISF_P3&prodType=table American FactFinder. Race (Total Population). 2010 U.S. Virgin Islands Summary File. Retrieved November 9, 2018.
  24. RACE (TOTAL RACES TALLIED)
  25. "2010 Census Shows More than Half of Native Hawaiians and Other Pacific Islanders Report Multiple Races". United States Census 2010. United States government. Retrieved December 29, 2014.
  26. Knight, Heather (March 1, 2006). "A YEAR AT MALCOLM X: Second Chance at Success Samoan families learn American culture". San Francisco Chronicle. Retrieved April 4, 2012.
  27. Sahagun, Louis (October 1, 2009). "Samoans in Carson hold church services for tsunami, earthquake victims". Los Angeles Times. Retrieved April 4, 2012.
  28. Garrison, Jessica. "Samoan Americans at a Crossroads", Los Angeles Times , April 14, 2000. Retrieved 2010-10-3.
  29. https://harvardlawreview.org/2017/04/american-samoa-and-the-citizenship-clause/ American Samoa and the Citizenship Clause: A Study in Insular Cases Revisionism. Chapter 3. Harvard Law Review. Retrieved October 10, 2018.
  30. "Who Bears the Burden?". Heritage Foundation.
  31. Scharnberg, Kirsten (March 21, 2007). "Young Samoans have little choice but to enlist". Chicago Tribune.
  32. Congressman Faleomavaega (March 23, 2009). "WASHINGTON, D.C.—AMERICAN SAMOA DEATH RATE IN THE IRAQ WAR IS HIGHEST AMONG ALL STATES AND U.S. TERRITORIES". Press Release. United States House of Representatives. Archived from the original on October 9, 2009. Retrieved September 30, 2009.
  33. "Navy SEALS to Diversify". Time. March 12, 2012.