| |||||||||||||||||||||||||||||||||||||||||||||||||||||||||||||||||||||||||||||
22 of 66 seats (One Third) to Wirral Metropolitan Borough Council 34 seats needed for a majority | |||||||||||||||||||||||||||||||||||||||||||||||||||||||||||||||||||||||||||||
---|---|---|---|---|---|---|---|---|---|---|---|---|---|---|---|---|---|---|---|---|---|---|---|---|---|---|---|---|---|---|---|---|---|---|---|---|---|---|---|---|---|---|---|---|---|---|---|---|---|---|---|---|---|---|---|---|---|---|---|---|---|---|---|---|---|---|---|---|---|---|---|---|---|---|---|---|---|
Turnout | 69.1% ( | ||||||||||||||||||||||||||||||||||||||||||||||||||||||||||||||||||||||||||||
| |||||||||||||||||||||||||||||||||||||||||||||||||||||||||||||||||||||||||||||
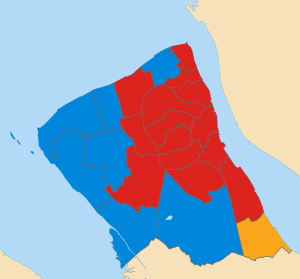
Map of results of 2015 election | |||||||||||||||||||||||||||||||||||||||||||||||||||||||||||||||||||||||||||||
|
The 2015 Wirral Metropolitan Borough Council election took place on 7 May 2015 to elect members of Wirral Metropolitan Borough Council in England. [1] This election was held on the same day as other local elections.
England is a country that is part of the United Kingdom. It shares land borders with Wales to the west and Scotland to the north-northwest. The Irish Sea lies west of England and the Celtic Sea lies to the southwest. England is separated from continental Europe by the North Sea to the east and the English Channel to the south. The country covers five-eighths of the island of Great Britain, which lies in the North Atlantic, and includes over 100 smaller islands, such as the Isles of Scilly and the Isle of Wight.
After the election, the composition of the council was:
Party | Seats | ± | |
---|---|---|---|
Labour | 39 | ||
Conservative | 21 | ||
Liberal Democrat | 5 | ||
Green | 1 | ||
Overall result compared with 2014.
Wirral Metropolitan Borough Council election result, 2015 | |||||||||||||||
---|---|---|---|---|---|---|---|---|---|---|---|---|---|---|---|
Party | Candidates | Votes | |||||||||||||
Stood | Elected | Gained | Unseated | Net | % of total | % | № | Net % | |||||||
Labour | 22 | 14 | 1 | 0 | 63.6 | 47.9 | 79,409 | ||||||||
Conservative | 21 | 7 | 0 | 0 | 31.8 | 28.1 | 46,611 | ||||||||
UKIP | 20 | 0 | 0 | 0 | 0.0 | 9.0 | 14,919 | ||||||||
Liberal Democrat | 18 | 1 | 0 | 1 | 4.5 | 8.2 | 13,572 | ||||||||
Green | 22 | 0 | 0 | 0 | 0.0 | 6.3 | 10,446 | ||||||||
TUSC | 6 | 0 | 0 | 0 | 0.0 | 0.4 | 632 | ||||||||
Independent | 3 | 0 | 0 | 0 | 0.0 | 0.1 | 195 |
Prior to the election the composition of the council was:
38 | 21 | 6 | 1 |
Lab | Con | LD | G |
After the election the composition of the council was:
39 | 21 | 5 | 1 |
Lab | Con | LD | G |
Party | Candidate | Votes | % | ± | |
---|---|---|---|---|---|
Labour | Jerry Williams | 5,107 | 57.7 | ||
Conservative | Des Drury | 2,106 | 23.8 | ||
UKIP | Jim Bradshaw | 931 | 10.5 | ||
Green | Anthony Smith | 452 | 5.1 | ||
Liberal Democrat | Brian Gill | 261 | 2.9 | ||
Majority | 3,001 | 33.9 | |||
Registered electors | 12,107 | ||||
Turnout | 73.7 | ||||
Labour hold | Swing |
Party | Candidate | Votes | % | ± | |
---|---|---|---|---|---|
Labour | Brian Kenny | 4,255 | 76.9 | ||
Conservative | Geoffrey Dormand | 590 | 10.7 | ||
Green | Karl Cumings | 316 | 5.7 | ||
TUSC | Ben Halligan | 199 | 3.6 | ||
Liberal Democrat | Roy Wood | 175 | 3.2 | ||
Majority | 3,665 | 66.2 | |||
Registered electors | 10,049 | ||||
Turnout | 56.0 | ||||
Labour hold | Swing |
Party | Candidate | Votes | % | ± | |
---|---|---|---|---|---|
Labour | Phillip Davies | 3,130 | 56.0 | ||
Green | Jayne Clough | 1,763 | 31.6 | ||
UKIP | Laurence Sharpe-Stevens | 447 | 8.0 | ||
Conservative | June Cowin | 183 | 3.3 | ||
Liberal Democrat | Mary Price | 61 | 1.1 | New | |
Majority | 1,367 | 24.5 | N/A | ||
Registered electors | 9,854 | ||||
Turnout | 56.9 | ||||
Labour hold | Swing |
Party | Candidate | Votes | % | ± | |
---|---|---|---|---|---|
Labour | Joe Walsh | 4,478 | 59.3 | ||
Conservative | Mike Collins | 1,396 | 18.5 | ||
UKIP | Sue Colquhoun | 865 | 11.5 | ||
Liberal Democrat | Penelope Golby | 367 | 4.9 | ||
Green | Percy Hogg | 330 | 4.4 | ||
TUSC | Mark Halligan | 118 | 1.6 | New | |
Majority | 3,082 | 40.8 | |||
Registered electors | 11,464 | ||||
Turnout | 66.3 | ||||
Labour hold | Swing |
Party | Candidate | Votes | % | ± | |
---|---|---|---|---|---|
Conservative | Adam Sykes | 3,656 | 41.3 | ||
Labour | Jenny Holliday | 3,371 | 38.1 | ||
UKIP | Roger Jones | 864 | 9.8 | ||
Liberal Democrat | Jan Cambridge | 644 | 7.3 | ||
Green | Vinny Spencer | 323 | 3.6 | ||
Majority | 285 | 3.2 | |||
Registered electors | 11,689 | ||||
Turnout | 76.2 | ||||
Conservative hold | Swing |
Party | Candidate | Votes | % | ± | |
---|---|---|---|---|---|
Labour | Stephen Foulkes | 4,101 | 56.8 | ||
Conservative | Barbara Sinclair | 1,309 | 18.1 | ||
UKIP | Philip Griffiths | 810 | 11.2 | ||
Liberal Democrat | Christopher Teggin | 512 | 7.1 | ||
Green | Tom Cubbin | 488 | 6.8 | ||
Majority | 2,792 | 38.7 | |||
Registered electors | 11,266 | ||||
Turnout | 64.5 | ||||
Labour hold | Swing |
Party | Candidate | Votes | % | ± | |
---|---|---|---|---|---|
Liberal Democrat | Dave Mitchell | 3,589 | 45.1 | ||
Labour | Helen Robinson | 2,772 | 34.8 | ||
Conservative | Keith Jack | 1,314 | 16.5 | ||
Green | Paul Cartlidge | 291 | 3.7 | ||
Majority | 817 | 10.3 | |||
Registered electors | 11,089 | ||||
Turnout | 72.5 | ||||
Liberal Democrat hold | Swing |
Party | Candidate | Votes | % | ± | |
---|---|---|---|---|---|
Conservative | David Burgess-Joyce | 3,655 | 40.4 | ||
Labour | Julie McManus | 2,980 | 33.0 | ||
Liberal Democrat | Peter Reisdorf | 1,330 | 14.7 | ||
UKIP | Laurence Jones | 723 | 8.0 | ||
Green | Catherine Page | 352 | 3.9 | ||
Majority | 675 | 7.4 | |||
Registered electors | 11,583 | ||||
Turnout | 78.4 | ||||
Conservative hold | Swing |
Party | Candidate | Votes | % | ± | |
---|---|---|---|---|---|
Conservative | Andrew Hodson | 5,035 | 59.5 | ||
Labour | Mike Holliday | 1,718 | 20.3 | ||
UKIP | David Scott | 715 | 8.4 | ||
Liberal Democrat | David Tyrrell | 535 | 6.3 | ||
Green | Barbara Burton | 464 | 5.4 | ||
Majority | 3,317 | 39.2 | |||
Registered electors | 10,874 | ||||
Turnout | 78.5 | ||||
Conservative hold | Swing |
Party | Candidate | Votes | % | ± | |
---|---|---|---|---|---|
Conservative | Gerry Ellis | 4,125 | 50.8 | ||
Labour | Bill McGenity | 2,367 | 29.1 | ||
Green | Yvonne McGinley | 758 | 9.3 | ||
UKIP | George Robinson | 497 | 6.1 | ||
Liberal Democrat | Michael Redfern | 374 | 4.6 | ||
Majority | 1,758 | 21.7 | |||
Registered electors | 10,610 | ||||
Turnout | 77.0 | ||||
Conservative hold | Swing |
Party | Candidate | Votes | % | ± | |
---|---|---|---|---|---|
Labour | Ron Abbey | 4,297 | 60.8 | ||
Conservative | Denis Knowles | 1,744 | 24.7 | ||
UKIP | Jan Davison | 734 | 10.4 | ||
Green | Craig Reynolds | 291 | 4.1 | ||
Majority | 2,553 | 36.1 | |||
Registered electors | 10,764 | ||||
Turnout | 65.9 | ||||
Labour hold | Swing |
Party | Candidate | Votes | % | ± | |
---|---|---|---|---|---|
Labour | Bernie Mooney | 4,397 | 62.9 | ||
UKIP | Lynda Williams | 1,352 | 19.4 | ||
Liberal Democrat | Daniel Clein | 578 | 8.3 | ||
Green | Lindsey Stowell-Smith | 542 | 7.8 | ||
TUSC | Adam Khan | 118 | 1.7 | New | |
Majority | 3,045 | 43.5 | |||
Registered electors | 11,091 | ||||
Turnout | 64.5 | ||||
Labour hold | Swing |
Party | Candidate | Votes | % | ± | |
---|---|---|---|---|---|
Conservative | Steve Williams | 3,324 | 44.3 | ||
Labour | Karl Greaney | 3,191 | 42.5 | ||
UKIP | Susan Whitham | 716 | 9.5 | ||
Green | Perle Sheldricks | 272 | 3.6 | ||
Majority | 133 | 1.8 | |||
Registered electors | 10,860 | ||||
Turnout | 69.3 | ||||
Conservative hold | Swing |
Party | Candidate | Votes | % | ± | |
---|---|---|---|---|---|
Labour | Patrick Hackett | 3,822 | 52.5 | ||
Conservative | Tony Pritchard | 2,223 | 30.6 | ||
Green | Gillian Homeri | 634 | 8.7 | ||
UKIP | Tim Power | 595 | 8.2 | ||
Majority | 1,599 | 21.9 | |||
Registered electors | 11,003 | ||||
Turnout | 66.4 | ||||
Labour hold | Swing |
Party | Candidate | Votes | % | ± | |
---|---|---|---|---|---|
Labour | Paul Doughty [n 1] | 3,085 | 39.7 | ||
Liberal Democrat | Stuart Kelly | 2,788 | 35.9 | ||
Conservative | Hilary Jones | 854 | 11.0 | ||
UKIP | David Martin | 615 | 7.9 | ||
Green | Liz Heydon | 424 | 5.5 | ||
Majority | 297 | 3.8 | N/A | ||
Registered electors | 11,236 | ||||
Turnout | 69.4 | ||||
Labour gain from Liberal Democrat | Swing | ||||
Party | Candidate | Votes | % | ± | |
---|---|---|---|---|---|
Labour | Phillip Brightmore | 3,085 | 39.1 | ||
Conservative | Ian MacKenzie | 2,918 | 36.9 | ||
UKIP | Hilary Jones | 796 | 10.1 | ||
Liberal Democrat | Damien Cummins | 602 | 7.6 | ||
Green | Allen Burton | 378 | 4.8 | ||
Independent | Maureen Wilkinson | 69 | 0.9 | New | |
TUSC | Phil Simpson | 50 | 0.6 | New | |
Majority | 167 | 2.2 | |||
Registered electors | 10,589 | ||||
Turnout | 75.2 | ||||
Labour hold | Swing |
Party | Candidate | Votes | % | ± | |
---|---|---|---|---|---|
Labour | Angela Davies | 4,362 | 59.3 | ||
Conservative | Robert Hughes | 1,307 | 17.8 | ||
UKIP | James Shorthall | 864 | 11.7 | ||
Liberal Democrat | Allan Brame | 481 | 6.5 | ||
Green | Moira Gommon | 342 | 4.6 | ||
Majority | 3,055 | 41.5 | |||
Registered electors | 10,790 | ||||
Turnout | 68.4 | ||||
Labour hold | Swing |
Party | Candidate | Votes | % | ± | |
---|---|---|---|---|---|
Labour | Chris Meaden | 3,767 | 66.7 | ||
UKIP | Terry Hansen | 617 | 10.9 | ||
Conservative | Cy Ferguson | 552 | 9.8 | ||
Green | Paul Harris | 430 | 7.6 | ||
Liberal Democrat | Brian Hall | 148 | 2.6 | ||
TUSC | Morag Reid | 72 | 1.3 | ||
Independent | Jim Pritchard | 62 | 1.1 | ||
Majority | 3,150 | 55.8 | |||
Registered electors | 9,727 | ||||
Turnout | 58.3 | ||||
Labour hold | Swing |
Party | Candidate | Votes | % | ± | |
---|---|---|---|---|---|
Labour | Chris Jones | 4,157 | 71.1 | ||
UKIP | Christopher Wellstead | 726 | 12.4 | ||
Conservative | Christine Jones | 581 | 9.9 | ||
Green | Lily Clough | 244 | 4.2 | ||
TUSC | Gregory North | 75 | 1.3 | New | |
Independent | Karl Mercer | 64 | 1.1 | ||
Majority | 3,431 | 58.7 | |||
Registered electors | 10,309 | ||||
Turnout | 57.1 | ||||
Labour hold | Swing |
Party | Candidate | Votes | % | ± | |
---|---|---|---|---|---|
Labour | Tony Smith | 5,347 | 62.4 | ||
Conservative | Geoffrey Gubb | 1,807 | 21.1 | ||
UKIP | Geoffrey Caton | 853 | 9.9 | ||
Green | Marian Hussenbux | 306 | 3.6 | ||
Liberal Democrat | Alan Davies | 262 | 3.1 | ||
Majority | 3,540 | 41.3 | |||
Registered electors | 12,394 | ||||
Turnout | 69.6 | ||||
Labour hold | Swing |
Party | Candidate | Votes | % | ± | |
---|---|---|---|---|---|
Conservative | Paul Hayes | 3,831 | 44.8 | ||
Labour | Giuseppe Roberto | 3,309 | 38.7 | ||
UKIP | Brian Farrell | 647 | 7.6 | ||
Green | Cynthia Stonall | 464 | 5.4 | ||
Liberal Democrat | John Codling | 302 | 3.5 | ||
Majority | 522 | 6.1 | |||
Registered electors | 11,871 | ||||
Turnout | 72.5 | ||||
Conservative hold | Swing |
Party | Candidate | Votes | % | ± | |
---|---|---|---|---|---|
Conservative | David Elderton | 4,099 | 50.6 | ||
Labour | Thomas Usher | 2,311 | 28.5 | ||
Green | Trevor Desrosiers | 582 | 7.2 | ||
Liberal Democrat | John Cresswell | 563 | 6.9 | ||
UKIP | Dave Evennett | 552 | 6.8 | ||
Majority | 1,788 | 22.1 | |||
Registered electors | 10,380 | ||||
Turnout | 78.7 | ||||
Conservative hold | Swing |
• italics denote the sitting councillor • bold denotes the winning candidate
The 1998 Wirral Metropolitan Borough Council election took place on 7 May 1998 to elect members of Wirral Metropolitan Borough Council in England. This election was held on the same day as other local elections.
The 1999 Wirral Metropolitan Borough Council election took place on 6 May 1999 to elect members of Wirral Metropolitan Borough Council in England. This election was held on the same day as other local elections.
The 2002 Wirral Metropolitan Borough Council election took place on 2 May 2002 to elect members of Wirral Metropolitan Borough Council in England. This election was held on the same day as other local elections.
The 2003 Wirral Metropolitan Borough Council election took place on 1 May 2003 to elect members of Wirral Metropolitan Borough Council in England. This election was held on the same day as other local elections.
The 2004 Wirral Metropolitan Borough Council election took place on 10 June 2004 to elect members of Wirral Metropolitan Borough Council in England. This election was held on the same day as other local elections.
The 2006 Wirral Metropolitan Borough Council election took place on 4 May 2006 to elect members of Wirral Metropolitan Borough Council in England. This election was held on the same day as other local elections.
The 2007 Wirral Metropolitan Borough Council election took place on 3 May 2007 to elect members of Wirral Metropolitan Borough Council in England. This election was held on the same day as other local elections.
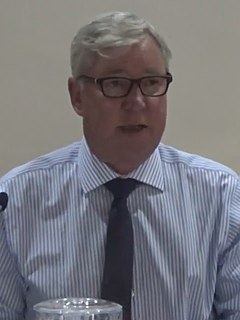
The 2008 Wirral Metropolitan Borough Council election took place on 1 May 2008 to elect members of Wirral Metropolitan Borough Council in England. This election was held on the same day as other local elections.
The 2010 Wirral Metropolitan Borough Council election took place on 6 May 2010 to elect members of Wirral Metropolitan Borough Council in England. This election was held on the same day as other local elections.
The 2011 Wirral Metropolitan Borough Council election took place on 5 May 2011 to elect members of Wirral Metropolitan Borough Council in England. This election was held on the same day as other local elections.
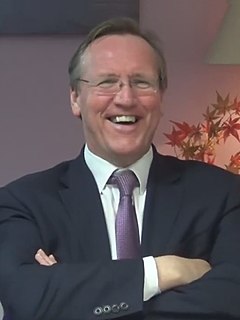
The 2012 Wirral Metropolitan Borough Council election took place on 3 May 2012 to elect members of Wirral Metropolitan Borough Council in England. This election was held on the same day as other local elections.
Wirral Metropolitan Borough Council, or simply Wirral Council, is the local authority of the Metropolitan Borough of Wirral in Merseyside, England. It is a metropolitan district council, one of five in Merseyside and one of 36 in the metropolitan counties of England, and provides the majority of local government services in Wirral. It is a constituent council of Liverpool City Region Combined Authority.
The 2014 Wirral Metropolitan Borough Council election took place on 22 May 2014 to elect members of Wirral Metropolitan Borough Council in England. This election was held on the same day as other local elections.
The 2016 Wirral Metropolitan Borough Council election took place on 5 May 2016 to elect members of Wirral Metropolitan Borough Council in England. This election was held on the same day as other local elections.
Prenton is a Wirral Metropolitan Borough Council Ward in the Birkenhead Parliamentary constituency.
The 2019 Wirral Metropolitan Borough Council election took place on 2 May 2019 to elect members of Wirral Metropolitan Borough Council in England. This election was held on the same day as other local elections.
Oxton is a Wirral Metropolitan Borough Council ward in the Birkenhead Parliamentary constituency.
The 1990 Wirral Metropolitan Borough Council election took place on 3 May 1990 to elect members of Wirral Metropolitan Borough Council in England. This election was held on the same day as other local elections.
The 1991 Wirral Metropolitan Borough Council election took place on 2 May 1991 to elect members of Wirral Metropolitan Borough Council in England. This election was held on the same day as other local elections.
The 1995 Wirral Metropolitan Borough Council election took place on 4 May 1995 to elect members of Wirral Metropolitan Borough Council in England. This election was held on the same day as other local elections.