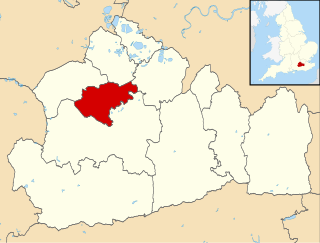
The 2004 Woking Council election took place on 10 June 2004 to elect members of Woking Borough Council in Surrey, England. One third of the council was up for election and the council stayed under no overall control. [1]
Borough status in the United Kingdom is granted by royal charter to local government districts in England, Wales and Northern Ireland. The status is purely honorary, and does not give any additional powers to the council or inhabitants of the district. In Scotland, similarly chartered communities were known as royal burghs, although the status is no longer granted.
Surrey is a subdivision of the English region of South East England in the United Kingdom. A historic and ceremonial county, Surrey is also one of the home counties. The county borders Kent to the east, East Sussex and West Sussex to the south, Hampshire to the west, Berkshire to the northwest, and Greater London to the northeast.
England is a country that is part of the United Kingdom. It shares land borders with Wales to the west and Scotland to the north-northwest. The Irish Sea lies west of England and the Celtic Sea lies to the southwest. England is separated from continental Europe by the North Sea to the east and the English Channel to the south. The country covers five-eighths of the island of Great Britain, which lies in the North Atlantic, and includes over 100 smaller islands, such as the Isles of Scilly and the Isle of Wight.
After the election, the composition of the council was
The results saw no party win a majority on the council with the Conservatives remaining the largest party on 17 seats. [3] They gained 2 seats in Knaphill and Maybury and Sheerwater wards from an independent and Labour respectively, but also lost 2 seats to the Liberal Democrats in Byfleet and Horsell West. [3] The Liberal Democrats were the most happy after gaining 3 seats to hold 15, which was their best election for the council in nearly 20 years. [3] Labour suffered a collapse in support losing both of the seats which they were defending in Maybury and Sheerwater and Kingfield and Westfield, leaving them with only 4 seats on the council but still holding the balance of power. [3]
The Conservative Party, officially the Conservative and Unionist Party, is a centre-right political party in the United Kingdom. The governing party since 2010, it is the largest in the House of Commons, with 313 Members of Parliament, and also has 249 members of the House of Lords, 18 members of the European Parliament, 31 Members of the Scottish Parliament, 12 members of the Welsh Assembly, eight members of the London Assembly and 8,916 local councillors.
Knaphill is an urban village in Surrey, England. To the east is Woking, to the west is Aldershot, while to the south and north on the A322 – which forms its effective western border – are Brookwood, and Bisley, respectively. Some of the village is set on a hill, hence the name. Knaphill has a cricket team formed in 2015. The team's home games are played at Waterers Park with an annual charity match in August. The club play against local teams such as Brookwood CC and Byfleet CC.
Sheerwater is a residential neighbourhood or small suburb of the Borough of Woking in Surrey, England, occasionally described as a village, between West Byfleet and Horsell. Its border is defined to the north by a gently winding part of the Basingstoke Canal and to the south by the South Western Main Line which passes from cutting level to that of an embankment. The neighbourhood has a business park and light industry at its south-western end. The whole area is linear, includes diverse green spaces to north and south, and covers 0.92 square kilometres (0.36 sq mi) or 92 hectares.
Overall 7 sitting councillors were re-elected, [4] 2 were defeated and 6 new people were elected. [5] [6] Turnout in the election was 41%, [7] a rise from the 2003 election with the biggest increase in Maybury and Sheerwater where it nearly doubled to just under 44%. [3]
A Councillor is a member of a local government council.
Voter turnout is the percentage of eligible voters who cast a ballot in an election. Eligibility varies by country, and the voting-eligible population should not be confused with the total adult population. Age and citizenship status are often among the criteria used to determine eligibility, but some countries further restrict eligibility based on sex, race, or religion.
Following the election the Conservatives remained in control of the executive with Jim Armitage continuing as leader of the council. [8] Meanwhile, the Liberal Democrats took the leadership of all 3 Overview and Scrutiny Committees. [8]
Overview and Scrutiny is a function of local authorities in England and Wales. It was introduced by the Local Government Act 2000 which created separate Executive and Overview and Scrutiny functions within councils.
Party | Seats | Gains | Losses | Net gain/loss | Seats % | Votes % | Votes | +/− | |
---|---|---|---|---|---|---|---|---|---|
Liberal Democrat | 8 | 3 | 0 | +3 | 61.5 | 39.6 | 9,520 | +4.2% | |
Conservative | 5 | 2 | 2 | 0 | 38.5 | 40.8 | 9,818 | -5.9% | |
Labour | 0 | 0 | 2 | -2 | 0 | 10.2 | 2,462 | -2.9% | |
UKIP | 0 | 0 | 0 | 0 | 0 | 6.8 | 1,631 | +4.9% | |
Independent | 0 | 0 | 1 | -1 | 0 | 1.6 | 378 | -0.9% | |
Health and Community Issues Party | 0 | 0 | 0 | 0 | 0 | 0.9 | 218 | +0.9% | |
Green | 0 | 0 | 0 | 0 | 0 | 0.1 | 35 | -0.3% |
Party | Candidate | Votes | % | ± | |
---|---|---|---|---|---|
Liberal Democrat | Philip Goldenberg | 509 | 49.3 | +5.2 | |
Conservative | Justin Boorman | 467 | 45.3 | +2.1 | |
Green | Sandra Simkin | 35 | 3.4 | -6.0 | |
Labour | Eric Kennedy | 21 | 2.0 | -1.3 | |
Majority | 42 | 4.0 | +3.1 | ||
Turnout | 1,032 | 54.5 | +10.7 | ||
Liberal Democrat hold | Swing |
Party | Candidate | Votes | % | ± | |
---|---|---|---|---|---|
Liberal Democrat | Anne Roberts | 918 | 38.0 | -6.8 | |
Conservative | Beryl Marlow | 853 | 35.4 | -10.6 | |
Independent | Suzanne Kittelsen | 378 | 15.7 | +15.7 | |
UKIP | Francis Squire | 172 | 7.1 | +7.1 | |
Labour | Brian Cozens | 92 | 3.8 | -5.5 | |
Majority | 65 | 2.6 | |||
Turnout | 2,413 | 43.3 | +2.3 | ||
Liberal Democrat gain from Conservative | Swing | ||||
Party | Candidate | Votes | % | ± | |
---|---|---|---|---|---|
Liberal Democrat | Rosie Sharpley | 1,122 | |||
Liberal Democrat | Robert Leach | 966 | |||
Conservative | Gary Carey | 500 | |||
Conservative | Bernard Wright | 358 | |||
Labour | Christopher Martin | 196 | |||
UKIP | Judith Squire | 194 | |||
Labour | Celia Wand | 135 | |||
Health and Community Issues Party | Michael Osman | 68 | |||
Turnout | 3,539 | 33 | |||
Liberal Democrat hold | Swing | ||||
Liberal Democrat hold | Swing |
Party | Candidate | Votes | % | ± | |
---|---|---|---|---|---|
Liberal Democrat | Ian Eastwood | 561 | 52.2 | -6.0 | |
Conservative | Jeremy Yates | 297 | 27.6 | -4.3 | |
UKIP | Marcia Taylor | 122 | 11.3 | +11.3 | |
Labour | John Bramall | 73 | 6.8 | -3.2 | |
Health and Community Issues Party | Shane Osman | 22 | 2.0 | +2.0 | |
Majority | 264 | 24.6 | 1.7 | ||
Turnout | 1,075 | 28.0 | +6.0 | ||
Liberal Democrat hold | Swing |
Party | Candidate | Votes | % | ± | |
---|---|---|---|---|---|
Conservative | Michael Smith | 914 | 57.6 | -1.1 | |
Liberal Democrat | John Craig | 380 | 24.0 | +0.0 | |
UKIP | Michael Harvey | 207 | 13.1 | -0.1 | |
Labour | John Pitt | 85 | 5.4 | +1.4 | |
Majority | 534 | 33.6 | -1.1 | ||
Turnout | 1,586 | 46.1 | +5.5 | ||
Conservative hold | Swing |
Party | Candidate | Votes | % | ± | |
---|---|---|---|---|---|
Liberal Democrat | Ann-Marie Barker | 1,090 | 42.7 | +1.2 | |
Conservative | Tony Branagan | 1,078 | 42.2 | -7.9 | |
UKIP | Timothy Shaw | 253 | 9.9 | +6.8 | |
Labour | Christopher Lowe | 132 | 5.2 | -0.2 | |
Majority | 12 | 0.5 | |||
Turnout | 2,553 | 47.4 | +5.2 | ||
Liberal Democrat gain from Conservative | Swing | ||||
Party | Candidate | Votes | % | ± | |
---|---|---|---|---|---|
Liberal Democrat | Derek McCrum | 629 | 38.6 | +19.8 | |
Conservative | Colin Kemp | 421 | 25.9 | -2.2 | |
Labour | David Mitchell | 349 | 21.4 | -22.1 | |
UKIP | Dennis Davey | 199 | 12.2 | +2.6 | |
Health and Community Issues Party | Caroline Schwark | 30 | 1.8 | +1.8 | |
Majority | 208 | 12.7 | |||
Turnout | 1,628 | 40.3 | +11.5 | ||
Liberal Democrat gain from Labour | Swing | ||||
Party | Candidate | Votes | % | ± | |
---|---|---|---|---|---|
Conservative | Caroline Fisher | 1,250 | 52.6 | +6.1 | |
Liberal Democrat | Bejan Shoraka | 977 | 41.1 | -6.7 | |
Labour | Chanchal Kapoor | 150 | 6.3 | +0.6 | |
Majority | 273 | 11.5 | |||
Turnout | 2,377 | 34.5 | +4.0 | ||
Conservative gain from Independent | Swing | ||||
Party | Candidate | Votes | % | ± | |
---|---|---|---|---|---|
Conservative | Riasat Khan | 1,142 | 39.4 | +19.5 | |
Labour | Sabir Hussain | 995 | 34.4 | -6.4 | |
Liberal Democrat | Colin Scott | 661 | 22.8 | -4.5 | |
Health and Community Issues Party | Katrina Osman | 98 | 3.4 | -8.6 | |
Majority | 147 | 5.0 | |||
Turnout | 2,896 | 43.4 | +21.2 | ||
Conservative gain from Labour | Swing | ||||
Party | Candidate | Votes | % | ± | |
---|---|---|---|---|---|
Conservative | Valerie Tinney | 809 | 56.4 | -4.2 | |
Liberal Democrat | David Everett | 397 | 27.7 | +0.3 | |
UKIP | Richard Squire | 136 | 9.5 | +5.0 | |
Labour | Michael Byrne | 92 | 6.4 | -1.1 | |
Majority | 412 | 28.7 | -4.5 | ||
Turnout | 1,434 | 39.7 | +5.6 | ||
Conservative hold | Swing |
Party | Candidate | Votes | % | ± | |
---|---|---|---|---|---|
Liberal Democrat | Ian Johnson | 840 | 54.1 | +3.6 | |
Conservative | Michele Maddock | 485 | 31.3 | -11.1 | |
UKIP | Mark Kingston | 151 | 9.7 | +7.4 | |
Labour | Vincenzo Congliaro | 76 | 4.9 | +0.1 | |
Majority | 355 | 22.8 | +14.7 | ||
Turnout | 1,552 | 40.3 | -0.3 | ||
Liberal Democrat hold | Swing |
Party | Candidate | Votes | % | ± | |
---|---|---|---|---|---|
Conservative | Ian Fidler | 1,244 | 62.9 | -9.4 | |
Liberal Democrat | Andrew Grimshaw | 470 | 23.8 | -1.1 | |
UKIP | Robin Milner | 197 | 10.0 | +10.0 | |
Labour | Richard Cowley | 66 | 3.3 | +0.5 | |
Majority | 774 | 39.1 | -8.3 | ||
Turnout | 1,977 | 49.4 | +4.5 | ||
Conservative hold | Swing |
The Borough of Woking is a local government district with borough status in the west of Surrey, England. It is one of eleven districts in the county which has administrative status as to a different set of local government powers and responsibilities.
The 2008 Wokingham Borough Council election took place on 1 May 2008 to elect members of Wokingham Unitary Council in Berkshire, England. One third of the council was up for election and the Conservative party stayed in overall control of the council.
One third of Woking Borough Council in Surrey, England is elected each year, followed by one year without election. Since the last boundary changes in 2016, 30 councillors have been elected from 10 wards.
The 2003 Woking Council election took place on 1 May 2003 to elect members of Woking Borough Council in Surrey, England. One third of the council was up for election and the council stayed under no overall control.
The 2006 Woking Council election took place on 4 May 2006 to elect members of Woking Borough Council in Surrey, England. One third of the council was up for election and the council stayed under no overall control.
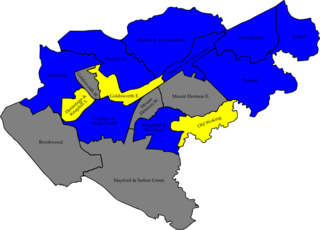
The 2007 Woking Council election took place on 3 May 2007 to elect members of Woking Borough Council in Surrey, England. One third of the council was up for election and the Conservative party gained overall control of the council from no overall control.
The 2008 Woking Council election took place on 1 May 2008 to elect members of Woking Borough Council in Surrey, England. One third of the council was up for election and the Conservative party stayed in overall control of the council.
The 2006 Rushmoor Council election took place on 4 May 2006 to elect members of Rushmoor Borough Council in Hampshire, England. One third of the council was up for election and the Conservative party stayed in overall control of the council.
The 2004 Fareham Council election took place on 10 June 2004 to elect members of Fareham Borough Council in Hampshire, England. Half of the council was up for election and the Conservative party stayed in overall control of the council.
The 2004 Solihull Metropolitan Borough Council election took place on 10 June 2004 to elect members of Solihull Metropolitan Borough Council in the West Midlands, England. The whole council was up for election with boundary changes since the last election in 2003. The Conservative party stayed in overall control of the council.
The 1998 Pendle Borough Council election took place on 7 May 1998 to elect members of Pendle Borough Council in Lancashire, England. One third of the council was up for election and the Liberal Democrats stayed in overall control of the council.
The 2010 Woking Council election took place on 1 May 2010, on the same day as the 2010 general election, to elect members of Woking Borough Council in Surrey, England. One third of the council was up for election and the council stayed under no overall control.
The 2004 Basingstoke and Deane Council election took place on 10 June 2004 to elect members of Basingstoke and Deane Borough Council in Hampshire, England. One third of the council was up for election and the council stayed under no overall control.
The 2004 Hertsmere Borough Council election took place on 10 June 2004 to elect members of Hertsmere Borough Council in Hertfordshire, England. One third of the council was up for election and the Conservative party stayed in overall control of the council.
The 2004 Colchester Borough Council election took place on 10 June 2004 to elect members of Colchester Borough Council in Essex, England. This was the same day as the other 2004 United Kingdom local elections and as the 2004 European Parliament Elections. One third of the seats were up for election and the council stayed under no overall control.
The 2006 Havant Borough Council election took place on 4 May 2006 to elect members of Havant Borough Council in Hampshire, England. One third of the council was up for election and the Conservative party stayed in overall control of the council.
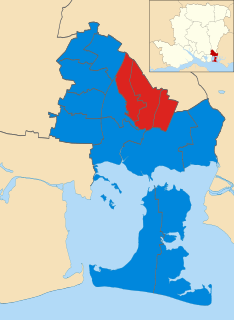
The 2012 Havant Borough Council election took place on 3 May 2012 to elect members of Havant Borough Council in Hampshire, England. One third of the council was up for election and the Conservative party stayed in overall control of the council.
The 2016 Woking Borough Council election took place on 5 May 2016 to elect members of Woking Borough Council in England. This was on the same day as other elections across the UK and the Police and Crime Commissioner election for Surrey Police.
The 2018 Woking Borough Council election took place on 3 May 2018 to elect one third of members to Woking Borough Council in England coinciding with other local elections held across much of England. Elections in each ward are held in three years out of four.