Demographics of South Dakota

Last updated

South Dakota Population Density Map South Dakota population map.png
South Dakota Population Density Map

South Dakota is the 46th-most populous U.S. state; in 2019, the U.S. Census Bureau estimated a population of about 884,659. The majority of South Dakotans are White, and the largest religion is Christianity. In 2010, 93.46% of the population spoke English as their primary language.

Contents

Population

Graph showing the age distribution of the population of South Dakota USA South Dakota age pyramid.svg
Graph showing the age distribution of the population of South Dakota

According to the U.S. Census Bureau, as of 2012, South Dakota has an estimated population of 833,354, which is an increase of 2.4% from 2010. Females made up approximately 49.8% of the population. In 2011, 2.4% of the population was foreign born. In the same year, there were 71,125 veterans. [1] The center of population of South Dakota is located in Buffalo County, in the unincorporated county seat of Gann Valley. [2]

Growth and rural flight

Historical population
CensusPop.Note
1860 4,837
1870 11,776143.5%
1880 98,268734.5%
1890 348,600254.7%
1900 401,57015.2%
1910 583,88845.4%
1920 636,5479.0%
1930 692,8498.8%
1940 642,961−7.2%
1950 652,7401.5%
1960 680,5144.3%
1970 665,507−2.2%
1980 690,7683.8%
1990 696,0040.8%
2000 754,8448.5%
2010 814,1807.9%
2020 886,6678.9%
Sources: 1910–2020 [3]

South Dakota, in common with five other nearby states (Nebraska, Kansas, Oklahoma, North Dakota, and Iowa), is experiencing a trend of falling populations in rural counties. 89% of the total number of cities in these six states have fewer than 3,000 people; hundreds have fewer than 1000. Between 1996 and 2004, almost half a million people, nearly half with college degrees, left the six states. "Rural flight" as it is called has led to offers of free land and tax breaks as enticements to newcomers.

The effect of rural flight has not been spread evenly through South Dakota, however. Although most rural counties and small towns have lost population, the Sioux Falls area and the Black Hills have gained population. In fact, Lincoln County, near Sioux Falls, is the ninth-fastest-growing county (by percentage) in the United States. [4] The growth in these areas has compensated for losses in the rest of the state, and South Dakota's total population continues to increase steadily, albeit at a slower rate than the national average. [5]

Birth data

Note: Births in table don't add up, because Hispanics are counted both by their ethnicity and by their race, giving a higher overall number.

Live Births by Single Race/Ethnicity of Mother
Race 2013 [6] 2014 [7] 2015 [8] 2016 [9] 2017 [10] 2018 [11] 2019 [12] 2020 [13] 2021 [14] 2022 [15]
White:9,527 (77.8%)9,601 (78.1%)9,504 (77.0%).....................
> Non-Hispanic White 9,127 (74.5%)9,122 (74.2%)9,063 (73.5%)8,837 (72.0%)8,620 (71.0%)8,481 (71.3%)8,154 (71.2%)7,740 (70.6%)8,111 (71.3%)8,008 (71.5%)
American Indian 2,100 (17.1%)2,055 (16.7%)2,166 (17.5%)1,788 (14.6%)1,807 (14.9%)1,652 (13.9%)1,613 (14.1%)1,501 (13.7%)1,525 (13.4%)1,483 (13.2%)
Black 342 (2.8%)356 (2.9%)344 (2.8%)363 (3.0%)398 (3.3%)416 (3.5%)416 (3.6%)390 (3.5%)385 (3.4%)362 (3.2%)
Asian 279 (2.3%)271 (2.2%)322 (2.6%)269 (2.2%)248 (2.0%)224 (1.9%)206 (1.8%)215 (2.0%)202 (1.8%)191 (1.7%)
Hispanic (of any race)521 (4.3%)603 (4.9%)559 (4.5%)634 (5.2%)624 (5.1%)661 (5.6%)642 (5.6%)660 (6.0%)695 (6.1%)726 (6.5%)
Total South Dakota12,248 (100%)12,283 (100%)12,336 (100%)12,275 (100%)12,134 (100%)11,893 (100%)11,449 (100%)10,960 (100%)11,369 (100%)11,201 (100%)

Age distribution

7.3% of South Dakota's population was reported as under 5 years of age, 24.5% under 18, and 14.7% were 65 or older. [1]

In 2010, the United States Census Bureau reported that the age distribution amongst South Dakotans was:

The median age was 36.9 years. [16]

Location

The largest metropolitan area (MSA) in South Dakota is the Sioux Falls metropolitan area, which consists of the counties of Lincoln, McCook, Minnehaha, and Turner. Its anchor is Sioux Falls. As of 2010, it had a population of 228,261. [17]

The second-largest MSA is the Rapid City metropolitan area, which had an estimated population of 124,766 in 2009. The MSA includes the counties of Pennington and Meade and is anchored to Rapid City. [18]

Top 10 Most Populated Counties in 2019

The most populous county in South Dakota is Minnehaha, which has an estimated 193,134 residents. The least populous county is Jones, with a population of about 903. [19]

CountySeatProjected Population
Minnehaha Sioux Falls 193,134
Pennington Rapid City 113,775
Lincoln Canton 61,128
Brown Aberdeen 38,839
Brookings Brookings 35,007
Meade Sturgis 28,332
Codington Watertown 28,009
Lawrence Deadwood 25,844
Yankton Yankton 22,814
Davison Mitchell 19,775

Ethnicity

South Dakota has a number of large Indian reservations (shown in pink). National-atlas-indian-reservations-south-dakota.gif
South Dakota has a number of large Indian reservations (shown in pink).
Ethnic origins in South Dakota Ethnic Origins in South Dakota.png
Ethnic origins in South Dakota

In 2012, the Census Bureau estimated that 86.2% of South Dakotans were White, 8.9% were American Indian or Alaskan Native, 3.1% were Hispanic or Latino, 1.7% were Black or African American, 1.1% were Asian, and 0.1% were Pacific Islander or Native Hawaiian. 2.1% of South Dakotans belonged to more than one race. [1]

In 2011, 25.4% of children less than one year old were minorities. [20]

From 2007 to 2011, the American Community Survey estimated that 42.8% (345,951) of South Dakotans were of German ancestry, 14.7% (118,603) were Norwegian, 11.1% (89,912) were Irish, 6.9% (55,425) were English, and 4.9% (39,420) were Dutch. [21]

In the 2000 census, the five largest ancestry groups in South Dakota were: German (40.7%), Norwegian (15.3%), Irish (10.4%), Native American (8.3%), and English (7.1%). [22] German-Americans are the largest ancestry group in most parts of the state, especially in the east, although there are also large Scandinavian populations in some counties.

South Dakota has the nation's largest population of Hutterites, [23] a communal Anabaptist group who emigrated from Europe in 1874. About one hundred Hutterite families came from Russia to Dakota Territory, then left for Canada to escape military conscription during the First World War. [24] Many families returned to South Dakota and today about 35 colonies exist in the state. (Approximately another 40 colonies are in other U.S. states and 200 in Canada.) [25]

American Indians, largely Lakota, Dakota, and Nakota (Sioux) are predominant in several counties. South Dakota has the third highest proportion of Native Americans of any state, behind Alaska and New Mexico. [26] Five of the state's counties lie entirely within Indian reservations. [27] Living standards on many reservations is often very low when compared with the national average. The unemployment rate in Fort Thompson, on the Crow Creek Indian Reservation, is 70%, and 21% of households there lack plumbing or basic kitchen appliances. [28] A 1995 study by the U.S. Census Bureau found that 58% of homes on the Pine Ridge Indian Reservation did not have a telephone. [29]

Demographics of South Dakota (csv)
By race WhiteBlackAIAN*AsianNHPI*
2000 (total population)90.36%0.90%9.06%0.80%0.07%
2000 (Hispanic only)1.21%0.04%0.24%0.02%0.01%
2005 (total population)89.64%1.17%9.43%0.92%0.06%
2005 (Hispanic only)1.83%0.07%0.23%0.02%0.00%
Growth 2000–05 (total population)1.98%33.36%7.02%17.99%-9.87%
Growth 2000–05 (non-Hispanic only)1.25%31.10%7.20%18.58%-5.69%
Growth 2000–05 (Hispanic only)55.60%78.64%0.17%-6.21%-41.54%
* AIAN is American Indian or Alaskan Native; NHPI is Native Hawaiian or Pacific Islander

Languages

Top 10 Non-English Languages Spoken in South Dakota
LanguagePercentage of population
(as of 2010) [30]
Spanish 2.06%
Dakota 1.39%
German 1.37%
Vietnamese 0.16%
Chinese (including Cantonese and Mandarin)0.12%
Russian 0.10%
Amharic and French (tied)0.09%
Other American Indian and Serbo-Croatian (tied)0.08%
Tagalog 0.06%
Czech and Korean (tied)0.05%

As of 2010, 93.46% (692,504) of South Dakota residents aged 5 and older spoke English as their primary language. 6.54% (48,498) of the population spoke a language other than English. 2.06% (15,292) of the population spoke Spanish, 1.39% (10,282) spoke Dakota, and 1.37% (10,140) spoke German. Other languages spoken included Vietnamese (0.16%), Chinese (0.12%), and Russian (0.10%). [30]

Since 2019, "the language of the Great Sioux Nation, comprised of three dialects, Dakota, Lakota, and Nakota" is an official language in the state. [31] [32]

In 2000, 93.65% (658,245) of South Dakota residents spoke English as their first language. 1.91% (13,425) of the population aged 5 or older spoke German, 1.52% (10,675) spoke Dakota, and 1.43% (10,055) spoke Spanish. Another 0.18% spoke French, 0.12% spoke Norwegian, and 0.09% spoke Czech. [33]

From 2000 to 2010, Spanish replaced German as the most common non-English language spoken in South Dakota. Dakota also passed German, making German the third-most common non-English language in the state. The percentage of non-English languages spoken rose from 6.35% in 2000 to 6.56% in 2010. [34]

Religion

The majority of South Dakotans who claim a religious affiliation are Christians. As of 2010, Mainline Protestantism was the most popular religious tradition in South Dakota, with 196,001 adherents. Catholicism was second with 148,883 adherents, and Evangelical Protestantism was third with 118,142 adherents. 337,348 residents remained unclaimed. [35]

Also in 2010, the Catholic Church was the largest church in South Dakota, with 148,883 members. The Evangelical Lutheran Church in America had 112,649 followers. The United Methodist Church had 36,020 members. [35]

According to a 2001 survey, 86% of South Dakotans described themselves as being members of a Christian denomination, while 8% said that they were not religious and 3% claimed faith in a non-Christian religion. The largest Christian denomination was Lutheran (27%), followed closely by Roman Catholic at 25%. Other Christian denominations mentioned included Methodist (13%), Baptist (4%), Presbyterian (4%), Pentecostal (2%), Congregational (2%), Episcopal/Anglican (1%), and Seventh-day Adventist (1%). 7% responded either as a non-denominational Christian or a Protestant, while 2% refused to answer. [36]

Related Research Articles

<span class="mw-page-title-main">Nebraska</span> U.S. state

Nebraska is a triply landlocked state in the Midwestern region of the United States. It borders South Dakota to the north; Iowa to the east and Missouri to the southeast, both across the Missouri River; Kansas to the south; Colorado to the southwest; and Wyoming to the west. Nebraska is the 16th largest state by land area, with just over 77,220 square miles (200,000 km2). With a population of over 1.9 million, it is the 37th most populous state and the 7th least densely populated. Its capital is Lincoln, and its most populous city is Omaha, which is on the Missouri River. Nebraska was admitted into the United States in 1867, two years after the end of the American Civil War. The Nebraska Legislature is unlike any other American legislature in that it is unicameral, and its members are elected without any official reference to political party affiliation.

<span class="mw-page-title-main">North Dakota</span> U.S. state

North Dakota is a landlocked U.S. state in the Upper Midwest, named after the indigenous Dakota Sioux. It is bordered by the Canadian provinces of Saskatchewan and Manitoba to the north and by the U.S. states of Minnesota to the east, South Dakota to the south, and Montana to the west. North Dakota is part of the Great Plains region, characterized by broad prairies, steppe, temperate savanna, badlands, and farmland. North Dakota is the 19th largest state, but with a population of less than 780,000, it is the 4th least populous and 4th most sparsely populated. The state capital is Bismarck while the most populous city is Fargo, which accounts for nearly a fifth of the state's population; both cities are among the fastest-growing in the U.S., although half of all residents live in rural areas.

<span class="mw-page-title-main">South Dakota</span> U.S. state

South Dakota is a landlocked state in the North Central region of the United States. It is also part of the Great Plains. South Dakota is named after the Dakota Sioux tribe, which comprises a large portion of the population with nine reservations currently in the state and has historically dominated the territory. South Dakota is the 17th largest by area, but the 5th least populous, and the 5th least densely populated of the 50 United States. Pierre is the state capital, and Sioux Falls, with a population of about 213,900, is South Dakota's most populous city. The state is bisected by the Missouri River, dividing South Dakota into two geographically and socially distinct halves, known to residents as "East River" and "West River". South Dakota is bordered by North Dakota to the north, Minnesota to the east, Iowa to the southeast, Nebraska to the south, Wyoming to the west, and Montana to the northwest.

<span class="mw-page-title-main">Demographics of the United States</span>

The United States had an official estimated resident population of 334,914,895 on July 1, 2023, according to the U.S. Census Bureau. This figure includes the 50 states and the District of Columbia but excludes the population of five unincorporated U.S. territories as well as several minor island possessions. The United States is the third most populous country in the world. The Census Bureau showed a population increase of 0.4% for the twelve-month period ending in July 2022, below the world average annual rate of 0.9%. The total fertility rate in the United States estimated for 2022 is 1.665 children per woman, which is below the replacement fertility rate of approximately 2.1.

<span class="mw-page-title-main">Mobridge, South Dakota</span> City in South Dakota, United States

Mobridge also Kȟowákataŋ Otȟúŋwahe is a city in Walworth County, South Dakota, United States. The population was 3,261 according to the 2020 census.

<span class="mw-page-title-main">Demographics of Alaska</span>

As of 2020, Alaska has a population of 733,391.

<span class="mw-page-title-main">Demographics of Oklahoma</span> Oklahoma Demographics

According to the U.S. Census Bureau, as of 2020, the state of Oklahoma had a population of 3,959,353, which is an increase of 208,002 or 5.54% since the year 2010. Oklahoma is the 28th most populous state in the United States.

<span class="mw-page-title-main">Geography of South Dakota</span> Overview of the geography of South Dakota

South Dakota is a state located in the north-central United States. It is usually considered to be in the Midwestern region of the country. The state can generally be divided into three geographic regions: eastern South Dakota, western South Dakota, and the Black Hills. Eastern South Dakota is lower in elevation and higher in precipitation than the western part of the state, and the Black Hills are a low, isolated mountain group in the southwestern corner of the state. Smaller sub-regions in the state include the Coteau des Prairies, Missouri Coteau, James River Valley, and the Dissected Till Plains. Geologic formations in South Dakota range in age from two billion-year-old Precambrian granite in the Black Hills to glacial till deposited over the last few million years. South Dakota is the 17th-largest state in the country.

The demographics of Virginia are the various elements used to describe the population of the Commonwealth of Virginia and are studied by various government and non-government organizations. Virginia is the 12th-most populous state in the United States with over 8 million residents and is the 35th largest in area.

The District of Columbia is a federal district with an ethnically diverse population. In 2020, the District had a population of 689,545 people, with a resident density of 11,515 people per square mile.

Florida is the third-most populous state in the United States. Its residents include people from a wide variety of ethnic, racial, national and religious backgrounds. The state has attracted immigrants, particularly from Latin America. Florida's majority ethnic group are European Americans, with approximately 65% of the population identifying as White. National ethnic communities in the state include Cubans, who migrated en masse following the revolution in the mid 20th century. They have been joined by other immigrants from Latin America, and Spanish is spoken by more than 20% of the state's population, with high usage especially in the Miami-Dade County area.

<span class="mw-page-title-main">Demographics of Massachusetts</span> Demographics of the U.S. state

Massachusetts has an estimated population of 6.981 million as of 2022 according to the U.S. Census Bureau. This represents a −0.7% decrease in population from the 2020 census, when the population was 7.029 million. Currently, Massachusetts is the sixteenth most populous U.S. state.

<span class="mw-page-title-main">Demographics of Arizona</span>

As of the 2020 United States census, Arizona had a population of 7,151,502.

<span class="mw-page-title-main">Demographics of Louisiana</span>

Louisiana is a South Central U.S. state, with a 2020 U.S. census resident population of 4,657,757, and apportioned population of 4,661,468. Much of the state's population is concentrated in southern Louisiana in the Greater New Orleans, Florida Parishes, and Acadiana regions, with the remainder in North and Central Louisiana's major metropolitan areas. The center of population of Louisiana is located in Pointe Coupee Parish, in the city of New Roads.

<span class="mw-page-title-main">Demographics of Arkansas</span>

Arkansas is the 32nd largest U.S. state, with a population of 3,011,524 as of the 2020 United States census.

Demographics of North Carolina covers the varieties of ethnic groups who reside in North Carolina and relevant trends.

<span class="mw-page-title-main">Demographics of New England</span> Demographics of the US region

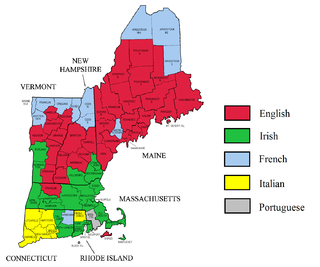
According to the 2018 American Community Survey, New England had an estimated population of 14,853,290, of which 48.7% were male and 51.3% were female. Approximately 19.7% of the population were under 18 years of age; 17.4% were 65 years of age or over.

<span class="mw-page-title-main">Demographics of Georgia (U.S. state)</span>

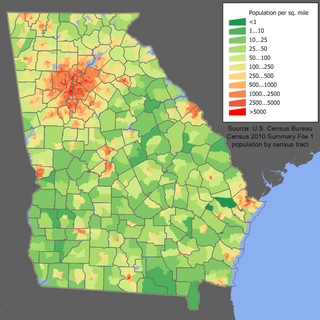
Georgia is a South Atlantic U.S. state with a population of 10,711,908 according to the 2020 United States census, or just over 3% of the U.S. population. The majority of the state's population is concentrated within Metro Atlanta, although other highly populated regions include: West Central and East Central Georgia; West, Central, and East Georgia; and Coastal Georgia; and their Athens, Columbus, Macon and Warner Robins, Augusta, Savannah, Hinesville, and Brunswick metropolitan statistical areas.

Utah is the 30th most populous state in the United States with a population of about 3.3 million, according to projections from the US Census Bureau's 2017 estimates. The state has also been characterized by a tremendous amount of growth in the last decade, with the highest percent increase in population of any state since 2010. Utah has a surface area of 84,899 square miles, though around 80% of its population is concentrated around a metropolitan area in the north-central part of the state known as the Wasatch Front.

<span class="mw-page-title-main">Norwegian Dakotan</span> American of Norwegian ancestry in Dakota

A Norwegian Dakotan is a Norwegian American in the U.S. states of North and South Dakota. One in three of all North Dakotans is of Norwegian heritage, which is the highest among all U.S. states. South Dakota is number three, behind Minnesota. The immigrants settled primarily between 1870 and 1920.

References

  1. 1 2 3 "South Dakota QuickFacts". U.S. Census Bureau. Archived from the original on 2004-09-11. Retrieved 2013-12-14.
  2. "Population and Population Centers by State - 2000". United States Census Bureau. Archived from the original on September 18, 2008. Retrieved 2007-08-18.
  3. "Historical Population Change Data (1910–2020)". Census.gov. United States Census Bureau. Archived from the original on April 29, 2021. Retrieved May 1, 2021.
  4. "100 Fastest Growing Counties". United States Census Bureau. Archived from the original on 2007-04-03. Retrieved 2007-04-10.
  5. "State and County Quickfacts (South Dakota)". United States Census Bureau. Archived from the original on 2004-09-11. Retrieved 2007-04-10.
  6. https://www.cdc.gov/nchs/data/nvsr/nvsr64/nvsr64_01.pdf [ bare URL PDF ]
  7. https://www.cdc.gov/nchs/data/nvsr/nvsr64/nvsr64_12.pdf [ bare URL PDF ]
  8. https://www.cdc.gov/nchs/data/nvsr/nvsr66/nvsr66_01.pdf [ bare URL PDF ]
  9. https://www.cdc.gov/nchs/data/nvsr/nvsr67/nvsr67_01.pdf [ bare URL PDF ]
  10. https://www.cdc.gov/nchs/data/nvsr/nvsr67/nvsr67_08-508.pdf [ bare URL PDF ]
  11. "Data" (PDF). www.cdc.gov. Retrieved 2019-12-21.
  12. "Data" (PDF). www.cdc.gov. Retrieved April 9, 2021.
  13. "Data" (PDF). www.cdc.gov. Retrieved 2022-02-20.
  14. "Data" (PDF). www.cdc.gov. Retrieved 2022-02-03.
  15. "Data" (PDF). www.cdc.gov. Retrieved 2024-04-05.
  16. "Profile of General Population and Housing Characteristics: 2010". United States Census Bureau . U.S. Census Bureau . Retrieved 2013-12-15.
  17. "South Dakota". USA Today . Retrieved 2011-05-12.
  18. "Table 1. Annual Estimates of the Population of Metropolitan and Micropolitan Statistical Areas: April 1, 2000 to July 1, 2009 (CBSA-EST2009-01)". 2009 Population Estimates. United States Census Bureau, Population Division. 2010-03-23. Archived from the original (CSV) on 2010-03-26. Retrieved 2010-03-26.
  19. "Annual Estimates of the Resident Population". United States Census Bureau . American Community Survey . Retrieved 2013-12-15.
  20. Exner, Rich (June 3, 2012). "Americans under age 1 now mostly minorities, but not in Ohio: Statistical Snapshot". The Plain Dealer. Cleveland, OH: Northeast Ohio Media Group. Retrieved January 10, 2014.
  21. "Selected Social Characteristics in the United States". American FactFinder. American Community Survey. Archived from the original on 2020-02-12. Retrieved 2013-12-15.
  22. "Quick Tables". United States Census Bureau. Archived from the original on 2020-02-12. Retrieved 2008-08-29.
  23. "Color them plain but successful". The Federal Reserve Bank of Minneapolis. Retrieved 2008-12-14.
  24. Johnson, Dirk (November 25, 1987). "Wolf Creek Journal; Idealists With a Knack For Being Prosperous". The New York Times . Retrieved June 20, 2015.
  25. Griffith, T. D. (1994). South Dakota. Compass American Guides. p. 75.
  26. "States Ranked by American Indian and Alaska Native Population, July 1, 1999". United States Census Bureau. Retrieved 2008-12-14.
  27. "Press Releases - Uniquely South Dakota". South Dakota Department of Tourism. Archived from the original on 2008-12-10. Retrieved 2008-08-22.
  28. Hetland, Cara. South Dakota has nation's poorest county. Minnesota Public Radio. October 1, 2002. (accessed December 19, 2008)
  29. "Transportation and Tourism Development at the Pine Ridge Indian Reservation". Federal Highway Administration. Retrieved 2008-12-19.
  30. 1 2 "Most Spoken Languages in South Dakota In 2010". Modern Language Association. Archived from the original on 2013-08-15. Retrieved 2013-12-14.
  31. "South Dakota recognizes official indigenous language".
  32. http://sdlegislature.gov/docs/legsession/2019/Amendments/amd126ca.htm
  33. "Most Spoken Languages in South Dakota in 2000". Modern Language Association. Archived from the original on 2013-08-15. Retrieved 2007-08-18.
  34. "Most Spoken Languages in South Dakota: Compare 2000 and 2010". Modern Language Association. Archived from the original on 2013-08-15. Retrieved 2013-12-14.
  35. 1 2 "South Dakota". State Membership Report. The Association of Religion Data Archives. Archived from the original on 2018-04-16. Retrieved 2013-12-14.
  36. "American Religious Identification Survey". Exhibit 15. The Graduate Center, City University of New York. Archived from the original on March 20, 2007. Retrieved 2007-04-06.