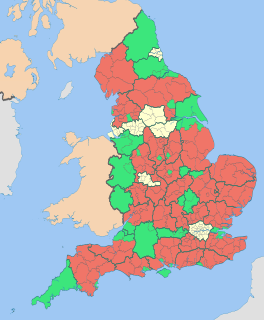
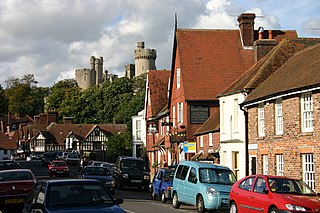
The 2003 Arun District Council election took place on 1 May 2003 to elect members of Arun District Council in West Sussex, England. The whole council was up for election with boundary changes since the last election in 1999. [1] The Conservative party stayed in overall control of the council. [2]
Arun is a local government district in West Sussex, England. It contains the towns of Arundel, Bognor Regis and Littlehampton, and takes its name from the River Arun, which runs through the centre of the district.
Non-metropolitan districts, or colloquially "shire districts", are a type of local government district in England. As created, they are sub-divisions of non-metropolitan counties in a two-tier arrangement.
West Sussex is a county in the south of England, bordering East Sussex to the east, Hampshire to the west and Surrey to the north, and to the south the English Channel.
Before the election the Conservatives ran the council, as they had since it was founded in 1973, with 37 seats, compared to 9 Liberal Democrats, 8 Labour and 2 independent councillors. [3] In total 138 candidates stood for the 56 seats being contested over 27 wards, with the boundaries having been changed since the 1999 election. [3]
The Liberal Democrats are a liberal political party in the United Kingdom. They presently have 11 Members of Parliament in the House of Commons, 96 members of the House of Lords, and one member of the European Parliament. They also have five Members of the Scottish Parliament and a member each in the Welsh Assembly and London Assembly. The party reached the height of its influence in the early 2010s, forming a junior partner in a coalition government from 2010 to 2015. It is presently led by Vince Cable.
The Labour Party is a centre-left political party in the United Kingdom which has been described as an alliance of social democrats, democratic socialists and trade unionists. The party's platform emphasises greater state intervention, social justice and strengthening workers' rights.
A Councillor is a member of a local government council.
Issues in the election included council tax levels, refuse collection, the closure of Arundel Pool, a shortage of low cost homes, crime and anti-social behaviour and plans to devolve power more locally within the council area. [3]
Arundel is a market town and civil parish in a steep vale of the South Downs, West Sussex, England.
Anti-social behaviours are actions that harm or lack consideration for the well-being of others. It has also been defined as any type of conduct that violates the basic rights of another person and any behaviour that is considered to be disruptive to others in society. This can be carried out in various ways, which includes but is not limited to intentional aggression, as well as covert and overt hostility. Anti-social behaviour also develops through social interaction within the family and community. It continuously affects a child's temperament, cognitive ability and their involvement with negative peers, dramatically affecting children's problem solving skills. Many people also label behaviour which is deemed contrary to prevailing norms for social conduct as anti-social behaviour. However, researchers have stated that it is a difficult term to define, particularly in the United Kingdom where there are an infinite number of acts that fall into its category. The term is especially used in British English.
The results saw the Conservatives stay in control of the council after winning 36 seats, compared to 11 Liberal Democrats, 8 Labour and 1 independent. [4] The leaders of each of the Liberal Democrats, John Richards, Labour, Roger Nash, and independents Bill Redman, were all defeated at the election, with the Labour leader Roger Nash losing by 1 vote in Pevensey ward. [4]
Party | Seats | Gains | Losses | Net gain/loss | Seats % | Votes % | Votes | +/− | |
---|---|---|---|---|---|---|---|---|---|
Conservative | 36 | 0 | 64.3 | 52.8 | 35,106 | +2.5% | |||
Liberal Democrat | 11 | +1 | 19.6 | 28.3 | 18,834 | +0.8% | |||
Labour | 8 | 0 | 14.3 | 13.9 | 9,250 | -4.2% | |||
Independent | 1 | -1 | 1.8 | 4.4 | 2,914 | +0.3% | |||
UKIP | 0 | 0 | 0 | 0.6 | 431 | +0.6% |
Party | Candidate | Votes | % | ± | |
---|---|---|---|---|---|
Conservative | Gillian Brown | 890 | 28.8 | ||
Conservative | Robin Brown | 872 | 28.2 | ||
Liberal Democrat | William Wolforth | 529 | 17.1 | ||
Liberal Democrat | Brian Dodd | 524 | 17.0 | ||
Labour | Michael Neville | 154 | 4.5 | ||
Labour | Simon Mouatt | 125 | 4.0 | ||
Turnout | 3,094 | 39.6 |
Party | Candidate | Votes | % | ± | |
---|---|---|---|---|---|
Conservative | Frances Coleman | 875 | 34.0 | ||
Conservative | Jacqueline Maconachie | 789 | 30.1 | ||
Liberal Democrat | Janet Collier | 289 | 11.2 | ||
Liberal Democrat | Gary Smith | 251 | 9.7 | ||
Labour | Raymond Leigh | 203 | 7.9 | ||
Labour | Leslie Rich | 171 | 6.6 | ||
Turnout | 2,578 | 33.3 |
Party | Candidate | Votes | % | ± | |
---|---|---|---|---|---|
Conservative | Julie Hazelhurst | 886 | 29.6 | ||
Conservative | Michael Church | 862 | 28.8 | ||
Conservative | Oliver Wingrove | 733 | 24.5 | ||
Liberal Democrat | Margaret Munro | 512 | 17.1 | ||
Turnout | 2,993 | 28.0 |
Party | Candidate | Votes | % | ± | |
---|---|---|---|---|---|
Independent | Donald Ayling | 803 | 30.6 | ||
Conservative | Steven Dendle | 675 | 25.7 | ||
Independent | William Redman | 631 | 24.0 | ||
Liberal Democrat | Ivan Olney | 410 | 15.6 | ||
Labour | Peter Slowe | 107 | 4.1 | ||
Turnout | 2,626 | 42.3 |
Party | Candidate | Votes | % | ± | |
---|---|---|---|---|---|
Conservative | Jean Goad | 1,322 | 25.4 | ||
Conservative | Anthony Dixon | 1,220 | 23.5 | ||
Conservative | Richard Wilby | 1,185 | 22.8 | ||
Liberal Democrat | Ian Menzies | 613 | 11.8 | ||
Liberal Democrat | Barbara Roberts | 442 | 8.5 | ||
Liberal Democrat | Alfred Roberts | 413 | 7.9 | ||
Turnout | 5,195 | 30.3 |
Party | Candidate | Votes | % | ± | |
---|---|---|---|---|---|
Liberal Democrat | James Walsh | 647 | 31.0 | ||
Liberal Democrat | Richard James | 558 | 26.8 | ||
Conservative | David Hodgson | 473 | 22.7 | ||
Labour | Andrew McTaggart | 211 | 10.1 | ||
Labour | Andy Parker | 196 | 9.4 | ||
Turnout | 2,085 | 33.0 |
Party | Candidate | Votes | % | ± | |
---|---|---|---|---|---|
Liberal Democrat | Simon McDougall | 801 | 22.0 | ||
Liberal Democrat | Sylvia Olliver | 780 | 21.4 | ||
Liberal Democrat | Martin Lury | 718 | 19.8 | ||
Conservative | Eric Pond | 375 | 10.3 | ||
Labour | Patrick Hastings | 364 | 10.0 | ||
Labour | Simon Holland | 319 | 8.8 | ||
Labour | Gail Walker | 278 | 7.6 | ||
Turnout | 3,635 | 24.6 |
Party | Candidate | Votes | % | ± | |
---|---|---|---|---|---|
Conservative | Alan Gammon | 357 | 24.4 | ||
Labour | David Dyball | 334 | 22.8 | ||
Labour | Mark Thomson | 303 | 20.7 | ||
Liberal Democrat | Paul Graydon | 238 | 16.2 | ||
Liberal Democrat | Nicholas Wiltshire | 233 | 15.9 | ||
Turnout | 1,465 | 22.0 |
Party | Candidate | Votes | % | ± | |
---|---|---|---|---|---|
Conservative | Richard Bower | 1,374 | 30.0 | ||
Conservative | John Rankin | 1,345 | 29.3 | ||
Conservative | Dennis Wilde | 1,308 | 28.5 | ||
Liberal Democrat | George Schlich | 563 | 12.3 | ||
Turnout | 4,590 | 32.9 |
Party | Candidate | Votes | % | ± | |
---|---|---|---|---|---|
Conservative | Susan Kelly | 712 | 32.0 | ||
Conservative | Simon Weston | 602 | 27.1 | ||
Independent | Michael Harvey | 571 | 25.7 | ||
Labour | Stephen McConnell | 172 | 7.7 | ||
Labour | Sharon Whitlam | 166 | 7.5 | ||
Turnout | 2,223 | 32.8 |
Party | Candidate | Votes | % | ± | |
---|---|---|---|---|---|
Conservative | Alan Stainton | 684 | 27.4 | ||
Conservative | Elaine Stainton | 612 | 24.5 | ||
Independent | Mary Harvey | 547 | 22.0 | ||
Liberal Democrat | Michael Chapman | 274 | 11.0 | ||
Liberal Democrat | Michelle White | 155 | 6.2 | ||
Labour | Melanie Webb | 121 | 4.8 | ||
Labour | Sharon Kingswell | 102 | 4.1 | ||
Turnout | 2,495 | 34.8 |
Party | Candidate | Votes | % | ± | |
---|---|---|---|---|---|
Conservative | Roger Elkins | 1,092 | 38.1 | ||
Conservative | David Hill | 1,052 | 36.7 | ||
Labour | Henry Miller | 382 | 13.3 | ||
Liberal Democrat | Lyndsey Green | 341 | 11.9 | ||
Turnout | 2,867 | 41.9 |
Party | Candidate | Votes | % | ± | |
---|---|---|---|---|---|
Conservative | Stephen Brookman | 564 | 77.3 | ||
Liberal Democrat | Kay Schlich | 166 | 22.7 | ||
Majority | 398 | 54.6 | |||
Turnout | 730 | 37.3 |
Party | Candidate | Votes | % | ± | |
---|---|---|---|---|---|
Labour | Anthony Squires | 375 | 29.3 | ||
Labour | Michael Northeast | 350 | 27.3 | ||
Conservative | Sarah Britton | 213 | 16.6 | ||
Liberal Democrat | Anchorette Blackstone | 179 | 14.0 | ||
Liberal Democrat | John Wedderburn | 163 | 12.7 | ||
Turnout | 1,280 | 21.0 |
Party | Candidate | Votes | % | ± | |
---|---|---|---|---|---|
Liberal Democrat | Jeanette Warr | 313 | 19.1 | ||
Liberal Democrat | Paul Wells | 313 | 19.1 | ||
Conservative | Andrew Evans | 287 | 17.5 | ||
Conservative | Edwin Gyde | 270 | 16.5 | ||
Labour | Michael Jones | 240 | 14.6 | ||
Labour | Carole Richmond | 217 | 13.2 | ||
Turnout | 1,640 | 23.1 |
Party | Candidate | Votes | % | ± | |
---|---|---|---|---|---|
Liberal Democrat | Kenneth Scutt | 455 | 23.6 | ||
Liberal Democrat | Ian Harding | 419 | 21.7 | ||
Conservative | Douglas Maconachie | 388 | 20.1 | ||
Conservative | George Blampied | 355 | 18.4 | ||
Labour | Pauline Nash | 158 | 8.2 | ||
Labour | Catherine Mouatt | 152 | 7.9 | ||
Turnout | 1,927 | 26.8 |
Party | Candidate | Votes | % | ± | |
---|---|---|---|---|---|
Conservative | Barbara Oakley | 1,008 | 38.0 | ||
Conservative | Paul Wotherspoon | 874 | 33.0 | ||
Liberal Democrat | Roslyn Kissell | 358 | 13.5 | ||
Labour | Priscilla Matcham | 268 | 10.1 | ||
Labour | Edward Nattrass | 143 | 5.4 | ||
Turnout | 2,651 | 33.8 |
Party | Candidate | Votes | % | ± | |
---|---|---|---|---|---|
Liberal Democrat | Francis Oppler | 417 | 26.1 | ||
Liberal Democrat | David Biss | 387 | 24.2 | ||
Labour | Jasper Richmond | 261 | 16.4 | ||
Labour | Alison Sharples | 255 | 16.0 | ||
Conservative | Jean Pereira | 140 | 8.8 | ||
Conservative | Martin Pereira | 136 | 8.5 | ||
Turnout | 1,596 | 21.1 |
Party | Candidate | Votes | % | ± | |
---|---|---|---|---|---|
Conservative | Leonard Brown | 918 | 19.9 | ||
Conservative | Anita Hall | 917 | 19.9 | ||
Conservative | Ashvinkumar Patel | 913 | 19.8 | ||
Liberal Democrat | Sara Allen | 406 | 8.8 | ||
Liberal Democrat | Jennifer Gillibrand | 354 | 7.7 | ||
Liberal Democrat | Robert Gillibrand | 331 | 7.2 | ||
Labour | Anne-Marie Norman | 283 | 6.1 | ||
Labour | Michael Phillips | 252 | 5.5 | ||
Labour | Jeremy Tomlinson | 236 | 5.1 | ||
Turnout | 4,610 | 27.3 |
Party | Candidate | Votes | % | ± | |
---|---|---|---|---|---|
Conservative | Sandra Daniells | 330 | 20.8 | ||
Labour | Jan Cosgrove | 324 | 20.4 | ||
Labour | Roger Nash | 323 | 20.4 | ||
Liberal Democrat | Kenneth Olliver | 311 | 19.6 | ||
Liberal Democrat | Vincent McCabe | 299 | 18.8 | ||
Turnout | 1,587 | 25.5 |
Party | Candidate | Votes | % | ± | |
---|---|---|---|---|---|
Labour | Mark Butler | 395 | 22.4 | ||
Labour | Wendy Squires | 360 | 20.4 | ||
Conservative | David Britton | 331 | 18.8 | ||
Liberal Democrat | Natasha Lear | 259 | 14.7 | ||
Independent | John Cockrell | 235 | 13.3 | ||
Liberal Democrat | Mark Winterford | 184 | 10.4 | ||
Turnout | 1,764 | 30.5 |
Party | Candidate | Votes | % | ± | |
---|---|---|---|---|---|
Conservative | Philippa Bower | 855 | 33.7 | ||
Conservative | John Rose | 845 | 33.3 | ||
Liberal Democrat | Irene Richards | 419 | 16.5 | ||
Liberal Democrat | Allan Turner | 416 | 16.4 | ||
Turnout | 2,535 | 33.8 |
Party | Candidate | Votes | % | ± | |
---|---|---|---|---|---|
Conservative | Raymond Steward | 1,009 | |||
Conservative | Harold Parris | 1,005 | 18.0 | ||
Conservative | Graham Tyler | 974 | 17.4 | ||
Liberal Democrat | Val Capon | 726 | 12.9 | ||
Liberal Democrat | John Ceriog-Hughes | 649 | 11.6 | ||
Liberal Democrat | John Richards | 595 | 10.6 | ||
UKIP | Janet Penn | 431 | 7.7 | ||
Labour | Edward Walsh | 222 | 4.0 | ||
Turnout | 5,611 | 33.1 |
Party | Candidate | Votes | % | ± | |
---|---|---|---|---|---|
Conservative | Norman Dingemans | 646 | 72.3 | ||
Liberal Democrat | George Fletcher | 248 | 27.7 | ||
Majority | 398 | 44.6 | |||
Turnout | 894 | 39.8 |
Party | Candidate | Votes | % | ± | |
---|---|---|---|---|---|
Labour | George O'Neill | 373 | 20.3 | ||
Labour | Alan Butcher | 355 | 19.3 | ||
Conservative | Derek Hulmes | 344 | 18.7 | ||
Liberal Democrat | David Jones | 338 | 18.4 | ||
Liberal Democrat | Kevin Weller | 304 | 16.5 | ||
Independent | Lilias Cheyne | 127 | 6.9 | ||
Turnout | 1,841 | 29.8 |
Party | Candidate | Votes | % | ± | |
---|---|---|---|---|---|
Conservative | John Matthews | 752 | 37.2 | ||
Conservative | Stephen Haymes | 737 | 36.4 | ||
Liberal Democrat | Ronald Probert | 270 | 13.3 | ||
Liberal Democrat | William Robinson | 264 | 13.0 | ||
Turnout | 2,023 | 28.0 |
The 2002 Harlow District Council election took place on 2 May 2002 to elect members of Harlow District Council in Essex, England. The whole council was up for election with boundary changes since the last election in 2000 reducing the number of seats by 9. The Labour party lost overall control of the council to no overall control.
The 2003 Hart Council election took place on 1 May 2003 to elect members of Hart District Council in Hampshire, England. One third of the council was up for election and the Conservative party stayed in overall control of the council.
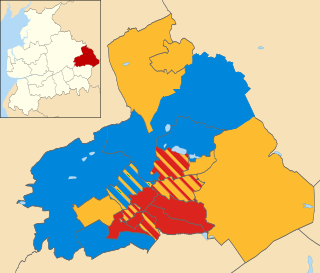
The 2002 Pendle Borough Council election took place on 2 May 2002 to elect members of Pendle Borough Council in Lancashire, England. The whole council was up for election with boundary changes since the last election in 2000 reducing the number of seats by 2. The council stayed under no overall control.
The 2006 Maidstone Borough Council election took place on 4 May 2006 to elect members of Maidstone Borough Council in Kent, England. One third of the council was up for election and the council stayed under no overall control.
The 2011 Ashfield District Council election took place on 5 May 2011 to elect members of Ashfield District Council in Nottinghamshire, England. The whole council was up for election and the Labour party gained overall control of the council from no overall control.
The 2002 Basingstoke and Deane Council election took place on 2 May 2002 to elect members of Basingstoke and Deane Borough Council in Hampshire, England. The whole council was up for election with boundary changes since the last election in 2000 increasing the number of seats by 3. The council stayed under no overall control.
The 2008 South Lakeland District Council election took place on 1 May 2008 to elect members of South Lakeland District Council in Cumbria, England. The whole council was up for election with boundary changes since the last election in 2007 reducing the number of seats by 1. The Liberal Democrats stayed in overall control of the council.
The 2011 Swindon Borough Council election took place on 5 May 2011 to elect members of Swindon Unitary Council in Wiltshire, England. One third of the council was up for election and the Conservative party stayed in overall control of the council.
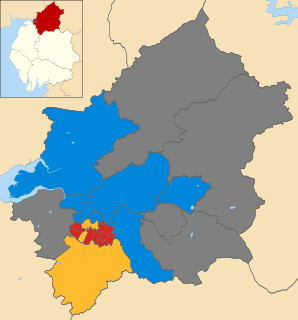
The 2006 Carlisle City Council election took place on 4 May 2006 to elect members of Carlisle District Council in Cumbria, England. One third of the council was up for election and the council stayed under no overall control.
The 2007 Carlisle City Council election took place on 3 May 2007 to elect members of Carlisle District Council in Cumbria, England. One third of the council was up for election and the council stayed under no overall control.
The 2011 Carlisle City Council election took place on 5 May 2011 to elect members of Carlisle District Council in Cumbria, England. One third of the council was up for election and the council stayed under no overall control.
The 2003 Eastbourne Borough Council election took place on 1 May 2003 to elect members of Eastbourne Borough Council in East Sussex, England. One third of the council was up for election and the Liberal Democrats stayed in overall control of the council.
The 2003 Wealden District Council election took place on 1 May 2003 to elect members of Wealden District Council in East Sussex, England. The whole council was up for election with boundary changes since the last election in 1999 reducing the number of seats by 3. The Conservative party stayed in overall control of the council.
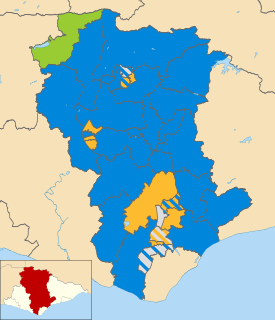
The 2007 Wealden District Council election took place on 3 May 2007 to elect members of Wealden District Council in East Sussex, England. The whole council was up for election and the Conservative party stayed in overall control of the council.
The 2003 Rother District Council election took place on 1 May 2003 to elect members of Rother District Council in East Sussex, England. The whole council was up for election after boundary changes reduced the number of seats by 7. The Conservative party stayed in overall control of the council.
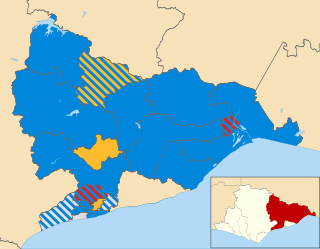
The 2011 Rother District Council election took place on 5 May 2011 to elect members of Rother District Council in East Sussex, England. The whole council was up for election and the Conservative party stayed in overall control of the council.
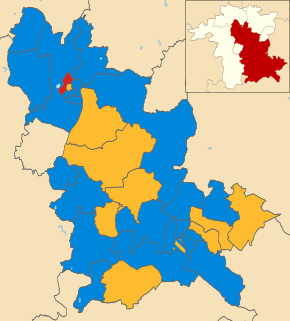
The 2003 Wychavon District Council election took place on 1 May 2003 to elect members of Wychavon District Council in Worcestershire, England. The whole council was up for election with boundary changes since the last election in 1999 reducing the number of seats by four. The Conservative party stayed in overall control of the council.
The 2015 East Dorset District Council election took place on 7 May 2015 in order to elect members of the East Dorset District Council in Dorset, England. The whole council was up for election after boundary changes reduced the number of seats by seven. The Conservative party stayed in overall control of the council.
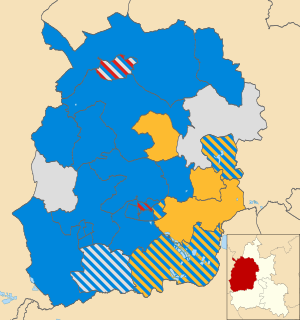
The 2002 West Oxfordshire District Council election took place on 2 May 2002 to elect members of West Oxfordshire District Council in Oxfordshire, England. The whole council was up for election with boundary changes since the last election in 2000. The Conservative party stayed in overall control of the council.