Belfast South | |
---|---|
Former borough constituency for the House of Commons | |
![]() Boundary of Belfast South in Northern Ireland | |
Districts of Northern Ireland | |
Electorate | 60,914 (March 2011) |
Borough | Belfast |
1922–2024 | |
Seats | 1 |
Created from | |
Replaced by | Belfast South and Mid Down |
1885–1918 | |
Seats | 1 |
Type of constituency | Borough constituency |
Created from | Belfast |
Replaced by |
Belfast South was a parliamentary constituency in the United Kingdom House of Commons from 1985 to 1918 and from 1922 to 2024. From the 2024 general election, it was succeeded by the constituency of Belfast South and Mid Down.
This section needs additional citations for verification .(August 2025) |
In the late nineteenth and early twentieth centuries, Belfast South tended to elect 'rebel unionists' such as William Johnston, who defied a ban on Orange marches, and Thomas Sloan, founder of the Independent Orange Order.
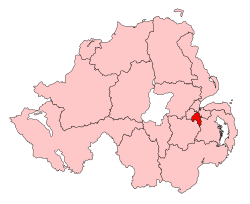
Belfast South contained some of Belfast's most expensive residential districts as well as Queen's University Belfast. The overall tenor of the constituency is middle-class – young, trendy and cosmopolitan towards the city centre, with Northern Ireland's biggest concentrations of both students and ethnic minorities, and further out from the city centre it is settled and prosperous. Despite this, significant pockets of inner-city working class areas such as the Markets and a number of isolated suburban estates exist in the constituency.
There had been particularly rapid demographic change in Belfast South from around the year 2000. The 2011 census revealed that Belfast South consisted of a slightly larger Catholic population than Protestant and while the constituency traditionally has had a unionist majority, the nationalist vote surpassed this in more recent elections. There have also been strong votes for other parties such as the Alliance Party of Northern Ireland, Green Party, the Conservatives and the Northern Ireland Women's Coalition. The constituency has witnessed a steady series of candidates backed by groups who aspire to support the British Labour Party despite its prior ban on membership and organisation in Northern Ireland, though their results have been minimal. Until the 1990s the main focus of attention had been on contests between unionist candidates.
In the February 1974 general election the seat was won by Robert Bradford of the Vanguard Unionist Progressive Party on a united anti-Sunningdale Agreement slate with the Ulster Unionist Party and the Democratic Unionist Party. He defeated Rafton Pounder, the sitting Unionist MP who defended his seat as a Pro-Assembly Unionist. Bradford held the seat for the next seven years, though in February 1978 he and the rump of Vanguard reunited with the Ulster Unionists. At the end of 1981 Bradford was assassinated by the IRA in a Belfast community centre while hosting a political surgery.
The subsequent by-election garnered much interest as it was expected that the Democratic Unionist Party would take the seat, building on their steady rise which had seen them gain both Belfast North and Belfast East at the previous general election. However, the DUP came third, behind the Alliance Party of Northern Ireland, and the UUP's candidate Martin Smyth won the seat, holding it until 2005. The by-election was extremely significant at the time in that it was the first at which the DUP tide ebbed.
In January 2005 Smyth announced that he would retire at the 2005 general election, raising speculation both as to whom the Ulster Unionists would field in succession to him and what effect a different candidate would have upon their share of the vote. The UUP selected Assembly member Michael McGimpsey, albeit with a highly controversial and bitter selection. McGimpsey was repudiated by many prominent Unionists, including both Smyth and former UUP leader James Molyneaux. The DUP selected Jimmy Spratt and offered an electoral pact to the UUP that would give each party a free run at one out of South Belfast and Fermanagh and South Tyrone. This offer was rejected by the UUP.
In the event, the DUP and UUP both fielded candidates which split the vote. The nationalist vote mainly went for the SDLP over Sinn Féin, with the result that the SDLP took the seat despite a majority of votes cast for unionist candidates. [1]
In the 2010 general election, Sinn Féin opted not to stand against the SDLP to avoid splitting the nationalist vote. [2] The SDLP won the seat with a majority of 6,000. This was the seat in which the Alliance Party had their second-best showing, polling 15% of the votes. Alasdair McDonnell retained the seat in May 2015, with only 24.5% of the vote, as Sinn Féin opted to stand. This is the smallest proportion of the vote a winning candidate has ever achieved in a UK general election. [3]
In the 2017 general election the seat was won by Emma Little-Pengelly of the DUP [4] with Alasdair McDonnell losing his seat along with all other SDLP MPs in Northern Ireland. [5] This was won back for the SDLP by Claire Hanna in 2019, with Sinn Féin again opting not to stand. [6] This was the first time since 1987 that the winning candidate in the constituency had a majority of the vote.
Under the Redistribution of Seats Act 1885, the parliamentary borough of Belfast was expanded. The 2-seat borough constituency of Belfast in the House of Commons of the United Kingdom was divided into four divisions: East, South, West, and North.
The city boundaries were expanded under the Belfast Corporation Act 1896. [7] Under the Redistribution of Seats (Ireland) Act 1918, the parliamentary borough was extended to include the whole city and the number of divisions increased from 4 to 9. The Cromac and Ormeau divisions largely replaced the South division. [8] [9] These boundaries were in effect at the 1918 general election.
The Government of Ireland Act 1920 established the Parliament of Northern Ireland, which came into operation in 1921. The representation of Northern Ireland in the Parliament of the United Kingdom was reduced from 30 MPs to 13 MPs, taking effect at the 1922 United Kingdom general election. These changes saw a 4-seat Belfast South constituency in the House of Commons of Northern Ireland and Belfast South re-established as a one-seat constituency at Westminster.
1885–1918 | Cromac Ward (except so much as is comprised in the East division), St. George's Ward (except so much as is comprised in West division), and in the parish of Shankill, County of Antrim, the Townland of Malone Lower, and so much of the Townland of Malone Upper as is included in the parliamentary borough. [10] |
1922–1950 | The divisions of Cromac (Cromac and Windsor wards) and Ormeau (Ormeau ward) [11] |
1950–1974 | In the county borough of Belfast, the wards of Cromac, Ormeau and Windsor. [12] |
1974–1983 | In the county borough of Belfast, the wards of Cromac, Ormeau and Windsor; In the rural district of Lisburn, the electoral divisions of Ardmore, Dunmurry, Finaghy, and Upper Malone; and in the rural district of Hillsborough, the electoral divisions of Breda and Edenderry. [13] |
1983–1997 | In Belfast, the wards of Ballynafeigh, Cromac, Donegall, Finaghy, Malone, Ormeau, Rosetta, St George's, Stranmillis, university, Upper Malone, Willowfield, and Windsor. [14] |
1997–2010 | In Belfast, the wards of Ballynafeigh, Blackstaff, Botanic, Finaghy, Malone, Musgrave, Ravenhill, Rosetta, Shaftesbury, Stranmillis, Upper Malone, Windsor and Woodstock, and in Castlereagh, the wards of Beechill, Cairnshill, Galwally, Knockbracken, Minnowburn and Newtownbreda. [15] |
2010–2024 | In Belfast, the wards of Ballynafeigh, Blackstaff, Botanic, Finaghy, Malone, Musgrave, Ravenhill, Rosetta, Shaftesbury, Stranmillis, Upper Malone, Windsor and Woodstock and in Castlereagh, the wards of Beechill, Cairnshill, Carryduff East, Carryduff West, Galwally, Hillfoot, Knockbracken, Minnowburn, Newtownbreda and Wynchurch. [16] |
Under the 2023 review of Westminster constituencies, the seat was proposed to be replaced by Belfast South and Mid Down. [17] The redrawn constituency contained 90.8% of the population of the former Belfast South. [18] [19] [20] This seat was first contested at the 2024 United Kingdom general election.
The Member of Parliament for Belfast South at the time of its abolition was Claire Hanna of the Social Democratic and Labour Party, who defeated Emma Little-Pengelly of the Democratic Unionist Party in the 2019 general election.
Election | Member | Party | |
---|---|---|---|
1885 | William Johnston | Ind. Conservative | |
1886 | Irish Conservative | ||
1891 | Irish Unionist | ||
1902 | Thomas Sloan | Ind. Unionist | |
1910 | James Chambers | Irish Unionist | |
1917 | William Arthur Lindsay | ||
1918 | constituency abolished | ||
1922 | constituency recreated | ||
1922 | Thomas Moles | UUP | |
1929 | William Stewart | ||
1938 | Progressive Unionist | ||
1945 | Conolly Gage | UUP | |
1952 | David Campbell | ||
1963 | Rafton Pounder | ||
February 1974 | Robert Bradford | Vanguard | |
1977 | UUP | ||
1982 | Martin Smyth | ||
2003 | Ind. Unionist | ||
2004 | UUP | ||
2005 | Alasdair McDonnell | SDLP | |
2017 | Emma Little-Pengelly | DUP | |
2019 | Claire Hanna | SDLP |
Party | Candidate | Votes | % | ±% | |
---|---|---|---|---|---|
SDLP | Claire Hanna | 27,079 | 57.2 | +31.3 | |
DUP | Emma Little-Pengelly | 11,678 | 24.7 | −5.7 | |
Alliance | Paula Bradshaw | 6,786 | 14.3 | −3.9 | |
UUP | Michael Henderson | 1,259 | 2.7 | −0.8 | |
Aontú | Chris McHugh | 550 | 1.2 | New | |
Majority | 15,401 | 32.5 | N/A | ||
Turnout | 47,352 | 67.6 | +1.5 | ||
Registered electors | 70,047 | ||||
SDLP gain from DUP | Swing | +18.5 |
This seat saw the largest SDLP vote share and the largest increase in vote share for the party at the 2019 general election. This came as Sinn Féin did not contest the seat. It also saw the only fall in vote share for Alliance. [22]
Party | Candidate | Votes | % | ±% | |
---|---|---|---|---|---|
DUP | Emma Little-Pengelly | 13,299 | 30.4 | +8.2 | |
SDLP | Alasdair McDonnell | 11,303 | 25.9 | +1.4 | |
Alliance | Paula Bradshaw | 7,946 | 18.2 | +1.0 | |
Sinn Féin | Máirtín Ó Muilleoir | 7,143 | 16.3 | +2.4 | |
Green (NI) | Clare Bailey | 2,241 | 5.1 | −0.6 | |
UUP | Michael Henderson | 1,527 | 3.5 | −5.6 | |
NI Conservatives | Clare Salier | 246 | 0.6 | −0.9 | |
Majority | 1,996 | 4.5 | N/A | ||
Turnout | 43,699 | 66.1 | +6.1 | ||
Registered electors | 66,105 | ||||
DUP gain from SDLP | Swing | +3.5 |
Party | Candidate | Votes | % | ±% | |
---|---|---|---|---|---|
SDLP | Alasdair McDonnell | 9,560 | 24.5 | −16.5 | |
DUP | Jonathan Bell | 8,654 | 22.2 | −1.5 | |
Alliance | Paula Bradshaw | 6,711 | 17.2 | +2.2 | |
Sinn Féin | Máirtín Ó Muilleoir | 5,402 | 13.9 | New | |
UUP | Rodney McCune | 3,549 | 9.1 | −8.2 | |
Green (NI) | Clare Bailey | 2,238 | 5.7 | +2.7 | |
UKIP | Bob Stoker | 1,900 | 4.9 | New | |
NI Conservatives | Ben Manton | 582 | 1.5 | New | |
Workers' Party | Lily Kerr | 361 | 0.9 | New | |
Majority | 906 | 2.3 | −15.0 | ||
Turnout | 38,957 | 60.0 | +2.6 | ||
Registered electors | 64,927 | ||||
SDLP hold | Swing | −7.5 |
The SDLP won the lowest winning share of the vote in modern British history.
Party | Candidate | Votes | % | ±% | |
---|---|---|---|---|---|
SDLP | Alasdair McDonnell | 14,026 | 41.0 | +8.7 | |
DUP | Jimmy Spratt | 8,100 | 23.7 | −5.9 | |
UCU-NF | Paula Bradshaw [30] | 5,910 | 17.3 | −4.9 | |
Alliance | Anna Lo | 5,114 | 15.0 | +7.7 | |
Green (NI) | Adam McGibbon | 1,036 | 3.0 | New | |
Majority | 5,926 | 17.3 | +13.4 | ||
Turnout | 34,186 | 57.4 | −5.1 | ||
Registered electors | 59,524 | ||||
SDLP hold | Swing | +6.7 |
Party | Candidate | Votes | % | ±% | |
---|---|---|---|---|---|
SDLP | Alasdair McDonnell | 10,339 | 32.3 | +1.7 | |
DUP | Jimmy Spratt | 9,104 | 28.4 | New | |
UUP | Michael McGimpsey | 7,263 | 22.7 | −22.1 | |
Sinn Féin | Alex Maskey | 2,882 | 9.0 | +1.4 | |
Alliance | Geraldine Rice | 2,012 | 6.3 | +0.9 | |
Rainbow Dream Ticket | Lynda Gilby | 235 | 0.7 | +0.4 | |
Workers' Party | Paddy Lynn | 193 | 0.6 | +0.1 | |
Majority | 1,235 | 3.9 | N/A | ||
Turnout | 32,028 | 60.8 | −3.1 | ||
Registered electors | 52,218 | ||||
SDLP gain from UUP | Swing | −13.4 |
Party | Candidate | Votes | % | ±% | |
---|---|---|---|---|---|
UUP | Martin Smyth | 17,008 | 44.8 | +8.8 | |
SDLP | Alasdair McDonnell | 11,609 | 30.6 | +6.3 | |
NI Women's Coalition | Monica McWilliams | 2,968 | 7.8 | +4.8 | |
Sinn Féin | Alex Maskey | 2,894 | 7.6 | +2.5 | |
Alliance | Geraldine Rice | 2,042 | 5.4 | −7.5 | |
PUP | Dawn Purvis | 1,112 | 2.9 | −11.5 | |
Workers' Party | Paddy Lynn | 204 | 0.5 | −0.2 | |
Rainbow Dream Ticket | Rainbow George Weiss | 115 | 0.3 | New | |
Majority | 5,399 | 14.2 | +2.5 | ||
Turnout | 37,952 | 63.9 | +1.7 | ||
Registered electors | 59,436 | ||||
UUP hold | Swing | +1.3 |
Party | Candidate | Votes | % | ±% | |
---|---|---|---|---|---|
UUP | Martin Smyth | 14,201 | 36.0 | −18.7 | |
SDLP | Alasdair McDonnell | 9,601 | 24.3 | +10.1 | |
PUP | David Ervine | 5,687 | 14.4 | New | |
Alliance | Steve McBride | 5,112 | 12.9 | −2.8 | |
Sinn Féin | Seán Hayes | 2,019 | 5.1 | +2.6 | |
NI Women's Coalition | Annie Campbell | 1,204 | 3.0 | New | |
NI Conservatives | Myrtle Boal | 962 | 2.4 | −9.3 | |
Independent Labour | Niall Cusack | 292 | 0.7 | New | |
Workers' Party | Paddy Lynn | 286 | 0.7 | New | |
Natural Law | James Anderson | 120 | 0.3 | New | |
Majority | 4,600 | 11.7 | −19.3 | ||
Turnout | 39,484 | 62.2 | −2.3 | ||
Registered electors | 63,633 | ||||
UUP hold | Swing | −13.4 |
1997 Changes are compared to the 1992 notional results shown below.
Party | Candidate | Votes | % | ±% | |
---|---|---|---|---|---|
UUP | N/A | 23,258 | 52.7 | N/A | |
Alliance | N/A | 6,921 | 15.7 | N/A | |
SDLP | N/A | 6,266 | 14.2 | N/A | |
NI Conservatives | N/A | 5,154 | 11.7 | N/A | |
Others | N/A | 1,437 | 3.3 | N/A | |
Sinn Féin | N/A | 1,116 | 2.5 | N/A | |
Majority | 16,337 | 37.0 | N/A |
Party | Candidate | Votes | % | ±% | |
---|---|---|---|---|---|
UUP | Martin Smyth | 16,336 | 48.6 | −9.2 | |
SDLP | Alasdair McDonnell | 6,266 | 18.7 | +5.6 | |
Alliance | John Montgomery | 5,054 | 15.0 | −6.3 | |
NI Conservatives | Andrew Fee | 3,356 | 10.0 | New | |
Sinn Féin | Seán Hayes | 1,123 | 3.3 | +0.1 | |
Labour and Trade Union | Peter Hadden | 875 | 2.6 | New | |
Workers' Party | Paddy Lynn | 362 | 1.1 | −3.6 | |
Natural Law | Teresa Mullen | 212 | 0.6 | New | |
Majority | 10,070 | 29.9 | −6.6 | ||
Turnout | 33,584 | 64.5 | +4.2 | ||
Registered electors | 52,050 | ||||
UUP hold | Swing |
Party | Candidate | Votes | % | ±% | |
---|---|---|---|---|---|
UUP | Martin Smyth | 18,917 | 57.8 | +7.8 | |
Alliance | David Cook | 6,963 | 21.3 | −2.6 | |
SDLP | Alasdair McDonnell | 4,268 | 13.1 | +4.5 | |
Workers' Party | Gerard Carr | 1,528 | 4.7 | +2.4 | |
Sinn Féin | Seán McKnight | 1,030 | 3.2 | +0.2 | |
Majority | 11,954 | 36.5 | +10.5 | ||
Turnout | 32,706 | 60.3 | −9.3 | ||
Registered electors | 54,208 | ||||
UUP hold | Swing |
Party | Candidate | Votes | % | ±% | |
---|---|---|---|---|---|
UUP | Martin Smyth | 21,771 | 71.3 | +21.3 | |
Alliance | David Cook | 7,635 | 25.0 | +1.1 | |
Workers' Party | Gerry Carr | 1,109 | 3.6 | +1.3 | |
Majority | 14,136 | 46.3 | +20.3 | ||
Turnout | 30,515 | 56.9 | −12.7 | ||
Registered electors | 53,944 | ||||
UUP hold | Swing |
Note: The by-election was caused by the decision of all Unionist MPs to resign their seats and seek re-election on a platform of opposition to the Anglo-Irish Agreement.
Party | Candidate | Votes | % | ±% | |
---|---|---|---|---|---|
UUP | Martin Smyth | 18,669 | 50.0 | −11.7 | |
Alliance | David Cook | 8,945 | 23.9 | −1.2 | |
DUP | Raymond McCrea | 4,565 | 12.2 | N/A | |
SDLP | Alasdair McDonnell | 3,216 | 8.6 | −0.7 | |
Sinn Féin | Sean McKnight | 1,107 | 3.0 | New | |
Workers' Party | Gerry Carr | 856 | 2.3 | New | |
Majority | 9,724 | 26.0 | −10.6 | ||
Turnout | 37,358 | 69.6 | +1.7 | ||
Registered electors | 53,674 | ||||
UUP hold | Swing |
Party | Candidate | Votes | % | ±% | |
---|---|---|---|---|---|
UUP | Martin Smyth | 17,123 | 39.3 | −22.4 | |
Alliance | David Cook | 11,726 | 26.9 | +1.8 | |
DUP | William McCrea | 9,818 | 22.6 | New | |
SDLP | Alasdair McDonnell | 3,839 | 8.8 | +0.9 | |
Ulster Loyalist Democratic Party | John McMichael | 576 | 1.3 | New | |
United Labour Party | Brian Caul | 303 | 0.7 | New | |
One Human Family | Jagat Narain | 137 | 0.3 | New | |
Peace State | Simon Hall-Raleigh | 12 | 0.03 | New | |
Majority | 5,397 | 12.4 | −24.2 | ||
Turnout | 43,534 | 66.2 | −1.7 | ||
Registered electors | 66,219 | ||||
UUP hold | Swing |
Party | Candidate | Votes | % | ±% | |
---|---|---|---|---|---|
UUP | Robert Bradford | 28,875 | 61.7 | +2.5 | |
Alliance | Basil Glass | 11,745 | 25.1 | +2.1 | |
SDLP | Alasdair McDonnell | 3,694 | 7.9 | +3.2 | |
Unionist Party NI | Victor Brennan | 1,784 | 3.8 | New | |
Labour Integrationist | Jeffrey Dudgeon | 692 | 1.5 | New | |
Majority | 17,130 | 36.6 | +0.4 | ||
Turnout | 46,790 | 67.9 | +0.2 | ||
Registered electors | 68,920 | ||||
UUP hold | Swing |
Party | Candidate | Votes | % | ±% | |
---|---|---|---|---|---|
Vanguard | Robert Bradford | 30,116 | 59.2 | +16.6 | |
Alliance | John Glass | 11,715 | 23.0 | +13.1 | |
Ind. Unionist | Stanley McMaster | 4,982 | 9.8 | New | |
SDLP | Ben Caraher | 2,390 | 4.7 | −3.3 | |
NI Labour | Erskine Holmes | 1,643 | 3.2 | −1.5 | |
Majority | 18,401 | 36.2 | +28.5 | ||
Turnout | 50,846 | 67.7 | −1.9 | ||
Registered electors | 75,112 | ||||
Vanguard hold | Swing |
Party | Candidate | Votes | % | ±% | |
---|---|---|---|---|---|
Vanguard | Robert Bradford | 22,083 | 42.6 | New | |
Pro-Assembly Unionist | Rafton Pounder | 18,085 | 34.9 | New | |
Alliance | David Cook | 5,118 | 9.9 | New | |
SDLP | Ben Caraher | 4,149 | 8.0 | New | |
NI Labour | Erskine Holmes | 2,455 | 4.7 | −24.9 | |
Majority | 3,998 | 7.7 | N/A | ||
Turnout | 51,890 | 69.6 | +1.2 | ||
Registered electors | 75,443 | ||||
Vanguard gain from UUP | Swing |
Party | Candidate | Votes | % | ±% | |
---|---|---|---|---|---|
UUP | Rafton Pounder | 27,523 | 70.4 | +5.0 | |
NI Labour | John Coulthard | 11,567 | 29.6 | −5.0 | |
Majority | 15,956 | 40.8 | +10.0 | ||
Turnout | 39,090 | 68.4 | +5.1 | ||
Registered electors | 57,112 | ||||
UUP hold | Swing | +5.0 |
Party | Candidate | Votes | % | ±% | |
---|---|---|---|---|---|
UUP | Rafton Pounder | 23,329 | 65.4 | −4.4 | |
NI Labour | Erskine Holmes | 12,364 | 34.6 | +12.2 | |
Majority | 10,965 | 30.8 | −16.6 | ||
Turnout | 35,693 | 63.3 | −5.0 | ||
Registered electors | 56,390 | ||||
UUP hold | Swing |
Party | Candidate | Votes | % | ±% | |
---|---|---|---|---|---|
UUP | Rafton Pounder | 27,422 | 69.8 | −0.1 | |
NI Labour | John Barkley | 8,792 | 22.4 | +0.8 | |
Ulster Liberal | Judith Rosenfield | 1,941 | 4.9 | −2.6 | |
Ind. Republican | Robert McKnight | 1,159 | 3.0 | New | |
Majority | 18,630 | 47.4 | −0.9 | ||
Turnout | 39,314 | 68.3 | −3.8 | ||
Registered electors | 57,558 | ||||
UUP hold | Swing |
Party | Candidate | Votes | % | ±% | |
---|---|---|---|---|---|
UUP | Rafton Pounder | 17,989 | 64.3 | −5.6 | |
NI Labour | Norman Searight | 7,209 | 25.8 | +4.2 | |
Ulster Liberal | Albert Hamilton | 2,774 | 9.9 | +2.4 | |
Majority | 10,780 | 38.5 | −9.8 | ||
Turnout | 27,972 | 48.3 | −23.8 | ||
Registered electors | 57,864 | ||||
UUP hold | Swing |
Party | Candidate | Votes | % | ±% | |
---|---|---|---|---|---|
UUP | David Campbell | 30,164 | 69.9 | −8.5 | |
NI Labour | Norman Searight | 9,318 | 21.6 | +4.0 | |
Ulster Liberal | Sheelagh Murnaghan | 3,253 | 7.5 | New | |
Sinn Féin | Brendan O'Reilly | 434 | 1.0 | −2.9 | |
Majority | 20,846 | 48.3 | −12.5 | ||
Turnout | 43,169 | 72.1 | +6.4 | ||
Registered electors | 59,864 | ||||
UUP hold | Swing |
Party | Candidate | Votes | % | ±% | |
---|---|---|---|---|---|
UUP | David Campbell | 33,392 | 78.4 | +2.6 | |
NI Labour | Edward Brown | 7,508 | 17.6 | −3.6 | |
Sinn Féin | Patrick Kearney | 1,679 | 3.9 | New | |
Majority | 25,884 | 60.8 | +9.2 | ||
Turnout | 42,579 | 65.7 | −8.1 | ||
Registered electors | 64,844 | ||||
UUP hold | Swing |
Party | Candidate | Votes | % | ±% | |
---|---|---|---|---|---|
UUP | David Campbell | 23,067 | 75.1 | −0.7 | |
NI Labour | Samuel Napier | 7,655 | 24.9 | +0.7 | |
Majority | 15,412 | 50.2 | −1.4 | ||
Turnout | 30,722 | 46.4 | −27.4 | ||
Registered electors | 65,196 | ||||
UUP hold | Swing |
Party | Candidate | Votes | % | ±% | |
---|---|---|---|---|---|
UUP | Hugh Gage | 37,046 | 75.8 | +0.6 | |
NI Labour | Robert McBrinn | 11,815 | 24.2 | −0.6 | |
Majority | 25,231 | 51.6 | +1.2 | ||
Turnout | 48,861 | 73.8 | +4.5 | ||
Registered electors | 66,212 | ||||
UUP hold | Swing |
Party | Candidate | Votes | % | ±% | |
---|---|---|---|---|---|
UUP | Hugh Gage | 34,620 | 75.2 | +23.0 | |
NI Labour | James McKernan | 11,428 | 24.8 | +7.3 | |
Majority | 23,192 | 50.4 | +28.5 | ||
Turnout | 46,048 | 69.3 | +2.9 | ||
Registered electors | 66,486 | ||||
UUP hold | Swing |
Party | Candidate | Votes | % | ±% | |
---|---|---|---|---|---|
UUP | Conolly Gage | 24,282 | 52.2 | N/A | |
Commonwealth Labour | Harry Midgley | 14,096 | 30.3 | New | |
NI Labour | James Morrow | 8,166 | 17.5 | New | |
Majority | 10,186 | 21.9 | N/A | ||
Turnout | 46,544 | 66.4 | N/A | ||
Registered electors | 70,140 | ||||
UUP hold | Swing | N/A |
Party | Candidate | Votes | % | ±% | |
---|---|---|---|---|---|
UUP | William Stewart | Unopposed | |||
Registered electors | 63,004 | ||||
UUP hold |
Party | Candidate | Votes | % | ±% | |
---|---|---|---|---|---|
UUP | William Stewart | Unopposed | |||
Registered electors | 59,394 | ||||
UUP hold |
Party | Candidate | Votes | % | ±% | |
---|---|---|---|---|---|
UUP | William Stewart | 24,019 | 62.9 | N/A | |
Ind. Unionist | Philip James Woods | 14,148 | 37.1 | New | |
Majority | 9,871 | 25.8 | N/A | ||
Turnout | 38,167 | 64.7 | N/A | ||
Registered electors | 59,025 | ||||
UUP hold | Swing | N/A |
Party | Candidate | Votes | % | ±% | |
---|---|---|---|---|---|
UUP | Thomas Moles | Unopposed | |||
Registered electors | |||||
UUP hold |
Party | Candidate | Votes | % | ±% | |
---|---|---|---|---|---|
UUP | Thomas Moles | Unopposed | |||
Registered electors | |||||
UUP hold |
Party | Candidate | Votes | % | ±% | |
---|---|---|---|---|---|
UUP | Thomas Moles | Unopposed | |||
Registered electors | |||||
UUP win (new seat) |
Party | Candidate | Votes | % | ±% | |
---|---|---|---|---|---|
Irish Unionist | William Arthur Lindsay | Unopposed | |||
Registered electors | |||||
Irish Unionist hold |
Party | Candidate | Votes | % | ±% | |
---|---|---|---|---|---|
Irish Unionist | James Chambers | Unopposed | |||
Registered electors | |||||
Irish Unionist hold |
Party | Candidate | Votes | % | ±% | |
---|---|---|---|---|---|
Irish Unionist | James Chambers | 5,585 | 67.2 | +5.3 | |
Ind. Unionist | Thomas Sloan | 2,722 | 32.8 | −5.3 | |
Majority | 2,863 | 34.4 | +10.6 | ||
Turnout | 8,307 | 78.2 | −9.6 | ||
Registered electors | 10,622 | ||||
Irish Unionist hold | Swing | +5.3 |
Party | Candidate | Votes | % | ±% | |
---|---|---|---|---|---|
Irish Unionist | James Chambers | 5,772 | 61.9 | +16.9 | |
Ind. Unionist | Thomas Sloan | 3,553 | 38.1 | −16.9 | |
Majority | 2,219 | 23.8 | N/A | ||
Turnout | 9,325 | 87.8 | +3.0 | ||
Registered electors | 10,622 | ||||
Irish Unionist gain from Ind. Unionist | Swing | +16.9 |
Party | Candidate | Votes | % | ±% | |
---|---|---|---|---|---|
Ind. Unionist | Thomas Sloan | 4,450 | 55.0 | N/A | |
Irish Unionist | Arthur Hill | 3,634 | 45.0 | N/A | |
Majority | 816 | 10.0 | N/A | ||
Turnout | 8,084 | 84.8 | N/A | ||
Registered electors | 9,538 | ||||
Ind. Unionist hold | Swing | N/A |
Party | Candidate | Votes | % | ±% | |
---|---|---|---|---|---|
Ind. Unionist | Thomas Sloan | 3,795 | 56.1 | New | |
Irish Unionist | Charles William Dunbar Buller | 2,969 | 43.9 | N/A | |
Majority | 826 | 12.2 | N/A | ||
Turnout | 6,764 | 66.0 | N/A | ||
Registered electors | 10,246 | ||||
Ind. Unionist gain from Irish Unionist | Swing | N/A |
Party | Candidate | Votes | % | ±% | |
---|---|---|---|---|---|
Irish Unionist | William Johnston | Unopposed | |||
Registered electors | |||||
Irish Unionist hold |
Party | Candidate | Votes | % | ±% | |
---|---|---|---|---|---|
Irish Unionist | William Johnston | Unopposed | |||
Registered electors | 8,192 | ||||
Irish Unionist hold |
Party | Candidate | Votes | % | ±% | |
---|---|---|---|---|---|
Irish Unionist | William Johnston | Unopposed | |||
Registered electors | 7,563 | ||||
Irish Unionist hold |
Party | Candidate | Votes | % | ±% | |
---|---|---|---|---|---|
Irish Conservative | William Johnston | 4,542 | 87.4 | +21.4 | |
Irish Parliamentary | Andrew McErlean | 657 | 12.6 | New | |
Majority | 3,885 | 74.8 | N/A | ||
Turnout | 5,199 | 77.1 | −4.1 | ||
Registered electors | 6,740 | ||||
Irish Conservative gain from Ind. Conservative | Swing |
Party | Candidate | Votes | % | ±% | |
---|---|---|---|---|---|
Ind. Conservative | William Johnston | 3,610 | 66.0 | ||
Liberal | John Workman | 990 | 18.1 | ||
Ind. Conservative | Robert Seeds | 871 | 15.9 | ||
Majority | 2,620 | 47.9 | |||
Turnout | 5,471 | 81.2 | |||
Registered electors | 6,740 | ||||
Ind. Conservative win (new seat) |