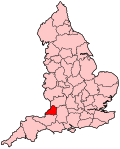
Bristol West | |
---|---|
Former Borough constituency for the House of Commons | |
County | City of Bristol |
Electorate | 84,571 (2018) [1] |
Major settlements | Bristol |
1885– 2024 | |
Seats | One |
Created from | Bristol |
Replaced by | Bristol Central Bristol East Bristol North West |
Bristol West is a borough constituency represented in the House of Commons of the Parliament of the United Kingdom since 2015 by Thangam Debbonaire of the Labour Party. It mostly covers the central and western parts of Bristol.
Further to the completion of the 2023 Periodic Review of Westminster constituencies, the seat will be reduced in size, with the Bishopston and Ashley Down ward being transferred to Bristol North West and Lawrence Hill and Easton wards to Bristol East. It will also be renamed Bristol Central , to be first contested at the next general election. [2] [3] [4]
More urban since boundary changes in 2010, the seat retains a high proportion of the city's most garden-rich, grandest houses and landscaped civic parks in affluent suburbs such as Clifton and Redland. Many of the townhouses in Bristol were subdivided in the latter half of the 20th century, during which time the size of the University of Bristol increased (the city's largest single independent employer which is chiefly in the seat). The seat also includes poorer areas such as Lawrence Hill and Easton.
1885–1918: The Municipal Borough of Bristol wards: Clifton, St Augustine's, St Michael's, and Westbury, and the local government district of Horfield.
1918–1950: The County Borough of Bristol wards: Clifton North, Clifton South, Horfield, Redland, St Michael, and Westbury-on-Trym.
1950–1955: The County Borough of Bristol wards: Bishopston, Clifton, Redland, St Augustine, St James, and St Michael.
1955–1974: The County Borough of Bristol wards: Bishopston, Cabot, Clifton, Durdham, and Redland.
1974–1983: as above plus District
1983–1997: The City of Bristol wards of Ashley, Bishopston, Cabot, Clifton, Cotham, Henleaze, Redland, and Stoke Bishop.
1997–2010: as above plus Westbury-on-Trym.
2010–present: as above less Westbury-on-Trym, Stoke Bishop and Henleaze, plus Clifton East, Easton, and Lawrence Hill
The above shows that the changes implemented for the 2010 general election boundaries were relatively great, recommended by a periodic impartial Boundary Commission review. [5] Easton and Lawrence Hill wards were transferred from Bristol East, while Henleaze, Stoke Bishop and Westbury-on-Trym wards were lost to Bristol North West. During the 2007 review, a proposal to rename the constituency as "Bristol Central" was rejected. [5]
Held by Conservatives continuously for 112 years, it was at various points represented by Conservative cabinet ministers Michael Hicks-Beach, Oliver Stanley, Walter Monckton and William Waldegrave. As part of a national Labour Party landslide, exceeding that of 1945, the 1997 gain by Valerie Davey was from a third-placed starting point for the party's candidate in 1992. At the 2005 election the seat was Liberal Democrat target number 18, and Conservative target number 50; it had been frequently described in the media as a "three-way marginal", and all parties fought hard for the constituency. The seat was taken by Liberal Democrat Stephen Williams with a large majority, thought to have been aided by the large student electorate, hostile to Labour's top-up fees policy. This Liberal Democrat success was similar to those in other seats with a large student population, such as Cambridge, Manchester Withington, Leeds North West and Cardiff Central. In the 2010 election, Stephen Williams held the seat with an increased majority. [6] In the 2015 general election, the Lib Dem vote fell by 29.2%; Williams came a distant third behind the winning Labour candidate Thangam Debbonaire and more than 5,000 votes behind the Green Party candidate, who achieved the greatest increase in the Green vote (+23%) in any seat that election. [7] In 2017 Bristol West had the biggest swing to Labour in the country. [8] The 52.1% majority was also the largest in the seat since 1931.
In the 2016 referendum to leave the European Union, the constituency voted remain by 79.3%. This was the second highest support for remain for a constituency. [9]
As a result of the formation of a Brexit 'Unite to Remain' pact between the Liberal Democrats, the Green Party and Plaid Cymru prior to the 2019 snap election, the Liberal Democrats agreed to withdraw from the Bristol West election in favour of the Green Party. [10] The result was a doubling of the Green vote and a reduction in the Labour majority by almost 10,000, but with a majority of over 28,000 for the Labour Party, the seat remains very safe.
As of February 2023, 17 of the 20 city councillors in the Bristol West Constituency were from the Green Party. [11]
Party | Candidate | Votes | % | ±% | |
---|---|---|---|---|---|
Labour | Thangam Debbonaire | 47,028 | 62.3 | ―3.6 | |
Green | Carla Denyer | 18,809 | 24.9 | +12.0 | |
Conservative | Suria Aujla | 8,822 | 11.7 | ―2.1 | |
Brexit Party | Neil Hipkiss | 869 | 1.2 | New | |
Majority | 28,219 | 37.4 | ―14.7 | ||
Turnout | 75,528 | 76.1 | ―1.0 | ||
Labour hold | Swing | ||||
Party | Candidate | Votes | % | ±% | |
---|---|---|---|---|---|
Labour | Thangam Debbonaire | 47,213 | 65.9 | +30.2 | |
Conservative | Annabel Tall | 9,877 | 13.8 | ―1.4 | |
Green | Molly Scott Cato | 9,216 | 12.9 | ―13.9 | |
Liberal Democrats | Stephen Williams | 5,201 | 7.3 | ―11.5 | |
Money Free Party | Jodian Rodgers | 101 | 0.1 | New | |
Majority | 37,336 | 52.1 | +43.2 | ||
Turnout | 71,608 | 77.1 | +5.1 | ||
Labour hold | Swing | +15.8 | |||
Party | Candidate | Votes | % | ±% | |
---|---|---|---|---|---|
Labour | Thangam Debbonaire | 22,900 | 35.7 | +8.2 | |
Green | Darren Hall | 17,227 | 26.8 | +23.0 | |
Liberal Democrats | Stephen Williams | 12,103 | 18.8 | ―29.2 | |
Conservative | Claire Hiscott | 9,752 | 15.2 | ―3.2 | |
UKIP | Paul Turner | 1,940 | 3.0 | +1.8 | |
Independent | Dawn Parry | 204 | 0.3 | New | |
Left Unity | Stewart Weston | 92 | 0.1 | New | |
Majority | 5,673 | 8.9 | N/A | ||
Turnout | 64,218 | 72.0 | +5.1 | ||
Labour gain from Liberal Democrats | Swing | ||||
(Note that the vote-share changes for 2010 are from the notional results on the new boundaries, not the actual 2005 results)
Party | Candidate | Votes | % | ±% | |
---|---|---|---|---|---|
Liberal Democrats | Stephen Williams | 26,593 | 48.0 | +8.9 | |
Labour | Paul Smith | 15,227 | 27.5 | –9.0 | |
Conservative | Nick Yarker | 10,169 | 18.4 | +2.0 | |
Green | Ricky Knight | 2,090 | 3.8 | –1.9 | |
UKIP | Christopher Lees | 655 | 1.2 | –0.1 | |
Independent | Danny Kushlick | 343 | 0.6 | New | |
English Democrat | Jon Baker | 270 | 0.5 | New | |
Majority | 11,366 | 20.5 | +11.6 | ||
Turnout | 55,347 | 66.9 | +3.3 | ||
Liberal Democrats hold | Swing | +9.0 | |||
Party | Candidate | Votes | % | ±% | |
---|---|---|---|---|---|
Liberal Democrats | Stephen Williams | 21,987 | 38.3 | +9.4 | |
Labour | Valerie Davey | 16,859 | 29.4 | –7.4 | |
Conservative | David Martin | 15,429 | 26.9 | –1.9 | |
Green | Justin Quinnell | 2,163 | 3.8 | +0.3 | |
UKIP | Simon Muir | 439 | 0.8 | –0.1 | |
Socialist Labour | Bernard Kennedy | 329 | 0.6 | –0.5 | |
Save Bristol North Baths Party | Douglas Reid | 190 | 0.3 | New | |
Majority | 5,128 | 8.9 | N/A | ||
Turnout | 57,396 | 70.5 | +4.9 | ||
Liberal Democrats gain from Labour | Swing | +8.4 | |||
Party | Candidate | Votes | % | ±% | |
---|---|---|---|---|---|
Labour | Valerie Davey | 20,505 | 36.8 | +1.6 | |
Liberal Democrats | Stephen Williams | 16,079 | 28.9 | +0.9 | |
Conservative | Pamela Chesters | 16,040 | 28.8 | –4.0 | |
Green | John Devaney | 1,961 | 3.5 | +2.1 | |
Socialist Labour | Bernard J. Kennedy | 590 | 1.1 | +0.7 | |
UKIP | Simon D. Muir | 490 | 0.9 | New | |
Majority | 4,426 | 7.9 | +5.5 | ||
Turnout | 55,665 | 65.6 | –7.8 | ||
Labour hold | Swing | ||||
Party | Candidate | Votes | % | ±% | |
---|---|---|---|---|---|
Labour | Valerie Davey | 22,068 | 35.2 | +10.5 | |
Conservative | William Waldegrave | 20,575 | 32.8 | –9.4 | |
Liberal Democrats | Charles R. Boney | 17,551 | 28.0 | –2.7 | |
Referendum | Margot Beauchamp | 1,304 | 2.1 | New | |
Green | Justin Quinnell | 852 | 1.4 | –0.3 | |
Socialist Labour | Roy Nurse | 244 | 0.4 | New | |
Natural Law | Jai Brierley | 47 | 0.1 | –0.1 | |
Majority | 1,493 | 2.4 | N/A | ||
Turnout | 62,641 | 73.8 | –0.2 | ||
Labour gain from Conservative | Swing | +10.0 | |||
Party | Candidate | Votes | % | ±% | |
---|---|---|---|---|---|
Conservative | William Waldegrave | 22,169 | 42.2 | –3.3 | |
Liberal Democrats | Charles Boney | 16,098 | 30.7 | –0.6 | |
Labour | Hedley Bashforth | 12,992 | 24.7 | +3.8 | |
Green | George Sawday | 906 | 1.7 | –0.3 | |
Natural Law | David James Cross | 104 | 0.2 | New | |
Revolutionary Communist | Ben Brent | 92 | 0.2 | New | |
Struck Off and Die Doctors Alliance | Phil Hammond | 87 | 0.2 | New | |
Anti-Federalist League | Timothy Hedges | 42 | 0.1 | New | |
Majority | 6,071 | 11.5 | –2.7 | ||
Turnout | 52,490 | 74.0 | –1.0 | ||
Conservative hold | Swing | –1.4 | |||
Party | Candidate | Votes | % | ±% | |
---|---|---|---|---|---|
Conservative | William Waldegrave | 24,695 | 45.5 | –3.6 | |
Liberal | George Ferguson | 16,992 | 31.3 | +1.9 | |
Labour | Mary Georghiou | 11,337 | 20.9 | +1.4 | |
Green | Gundula Dorey | 1,096 | 2.0 | +0.3 | |
Communist | Veronica Ralph | 134 | 0.3 | New | |
Majority | 7,703 | 14.2 | –5.5 | ||
Turnout | 54,254 | 75.0 | +4.3 | ||
Conservative hold | Swing | ||||
Party | Candidate | Votes | % | ±% | |
---|---|---|---|---|---|
Conservative | William Waldegrave | 25,400 | 49.1 | ||
Liberal | George Ferguson | 15,222 | 29.4 | ||
Labour | Pamela Tatlow | 10,094 | 19.5 | ||
Ecology | James Scott | 872 | 1.7 | ||
Independent | Sebastian Boyle | 142 | 0.3 | ||
Majority | 10,178 | 19.7 | |||
Turnout | 51,730 | 70.7 | |||
Conservative hold | Swing | ||||
Party | Candidate | Votes | % | ±% | |
---|---|---|---|---|---|
Conservative | William Waldegrave | 22,257 | 52.6 | +5.7 | |
Labour | Vivien Bath | 9,691 | 22.9 | -0.8 | |
Liberal | Bernard Silver | 8,881 | 21.0 | -8.3 | |
Ecology | John K. Ingham | 1,154 | 2.7 | New | |
National Front | M. Jones | 246 | 0.6 | New | |
United Democratic Party | Raymond R. Redmore | 93 | 0.2 | New | |
Majority | 12,566 | 29.7 | +12.1 | ||
Turnout | 42,322 | 71.6 | +6.2 | ||
Conservative hold | Swing | ||||
Party | Candidate | Votes | % | ±% | |
---|---|---|---|---|---|
Conservative | Robert Cooke | 18,555 | 46.9 | -1.4 | |
Liberal | Robert G.R. Stacey | 11,598 | 29.3 | -0.6 | |
Labour | John Malos | 9,372 | 23.7 | +1.9 | |
Majority | 6,957 | 17.6 | -0.8 | ||
Turnout | 39,525 | 65.4 | -7.3 | ||
Conservative hold | Swing | ||||
Party | Candidate | Votes | % | ±% | |
---|---|---|---|---|---|
Conservative | Robert Cooke | 21,141 | 48.3 | -11.9 | |
Liberal | Robert G.R. Stacey | 13,076 | 29.9 | +14.6 | |
Labour | John Malos | 9,526 | 21.8 | -2.7 | |
Majority | 8,065 | 18.4 | -17.3 | ||
Turnout | 43,743 | 72.7 | +6.4 | ||
Conservative hold | Swing | ||||
Party | Candidate | Votes | % | ±% | |
---|---|---|---|---|---|
Conservative | Robert Cooke | 20,110 | 60.2 | +3.5 | |
Labour | David J. Blackman | 8,175 | 24.5 | +0.8 | |
Liberal | Robert G.R. Stacey | 5,108 | 15.3 | -4.3 | |
Majority | 11,935 | 35.7 | +2.7 | ||
Turnout | 33,393 | 66.3 | -5.9 | ||
Conservative hold | Swing | ||||
Party | Candidate | Votes | % | ±% | |
---|---|---|---|---|---|
Conservative | Robert Cooke | 19,783 | 56.7 | -1.3 | |
Labour | Leslie Walter Bosisto | 8,265 | 23.7 | +3.7 | |
Liberal | Robert G.R. Stacey | 6,850 | 19.6 | -0.5 | |
Majority | 11,518 | 33.0 | -4.9 | ||
Turnout | 34,898 | 72.2 | -1.0 | ||
Conservative hold | Swing | ||||
Party | Candidate | Votes | % | ±% | |
---|---|---|---|---|---|
Conservative | Robert Cooke | 21,230 | 58.0 | -9.3 | |
Liberal | Keith Basil Wedmore | 7,366 | 20.1 | +6.0 | |
Labour | Donald McLaren | 7,306 | 20.0 | +1.4 | |
Taxpayers' Coalition Party | P. Michael Kingston | 709 | 1.9 | New | |
Majority | 13,864 | 37.9 | -10.8 | ||
Turnout | 36,611 | 73.2 | -0.4 | ||
Conservative hold | Swing | ||||
Party | Candidate | Votes | % | ±% | |
---|---|---|---|---|---|
Conservative | Robert Cooke | 27,768 | 67.3 | -8.0 | |
Labour | Michael Cocks | 7,651 | 18.6 | -6.1 | |
Liberal | Colin Hart-Leverton | 5,835 | 14.1 | New | |
Majority | 20,117 | 48.7 | -1.9 | ||
Turnout | 41,254 | 73.6 | -1.0 | ||
Conservative hold | Swing | ||||
Party | Candidate | Votes | % | ±% | |
---|---|---|---|---|---|
Conservative | Robert Cooke | 24,585 | 70.2 | 5.1 | |
Labour | Bill Rodgers | 10,423 | 29.8 | 5.1 | |
Majority | 14,162 | 40.4 | 10.2 | ||
Turnout | 35,008 | 61.1 | 13.5 | ||
Conservative hold | Swing | ||||
Party | Candidate | Votes | % | ±% | |
---|---|---|---|---|---|
Conservative | Walter Monckton | 32,767 | 75.3 | +11.7 | |
Labour | Walter Johnson | 10,766 | 24.7 | -4.1 | |
Majority | 22,001 | 50.6 | +15.8 | ||
Turnout | 43,533 | 74.6 | -6.0 | ||
Conservative hold | Swing | ||||
Party | Candidate | Votes | % | ±% | |
---|---|---|---|---|---|
Conservative | Walter Monckton | 25,858 | 63.6 | +4.7 | |
Labour | Harold Lawrance | 11,716 | 28.8 | -1.2 | |
Liberal | David Goldblatt | 3,115 | 7.7 | -3.4 | |
Majority | 14,142 | 34.8 | +5.9 | ||
Turnout | 40,689 | 80.6 | -1.8 | ||
Conservative hold | Swing | ||||
Party | Candidate | Votes | % | ±% | |
---|---|---|---|---|---|
Conservative | Walter Monckton | 22,216 | 81.4 | 22.5 | |
Labour | Harold Lawrance | 5,072 | 18.6 | 11.4 | |
Majority | 17,144 | 62.8 | 33.9 | ||
Turnout | 44,432 | 53.6 | 28.8 | ||
Conservative hold | Swing | ||||
Party | Candidate | Votes | % | ±% | |
---|---|---|---|---|---|
Conservative | Oliver Stanley | 24,920 | 58.9 | +10.3 | |
Labour | Edward Bishop | 12,677 | 30.0 | -8.0 | |
Liberal | Hilda Nuttall | 4,688 | 11.1 | -2.3 | |
Majority | 12,243 | 28.9 | +18.3 | ||
Turnout | 42,285 | 82.4 | +7.7 | ||
Conservative hold | Swing | ||||
Party | Candidate | Votes | % | ±% | |
---|---|---|---|---|---|
Conservative | Oliver Stanley | 32,149 | 48.6 | -22.4 | |
Labour | William Edward Balmer | 25,163 | 38.0 | +9.0 | |
Liberal | Desmond Allhusen | 8,849 | 13.4 | New | |
Majority | 6,986 | 10.6 | -31.4 | ||
Turnout | 66,161 | 74.7 | +3.9 | ||
Conservative hold | Swing | ||||
Party | Candidate | Votes | % | ±% | |
---|---|---|---|---|---|
Conservative | Cyril Culverwell | 36,820 | 71.0 | -12.0 | |
Labour | Percy Williams | 15,058 | 29.0 | +12.0 | |
Majority | 21,762 | 42.0 | -24.0 | ||
Turnout | 51,878 | 70.8 | -8.5 | ||
Conservative hold | Swing | ||||
Party | Candidate | Votes | % | ±% | |
---|---|---|---|---|---|
Conservative | Cyril Culverwell | 43,264 | 83.0 | +29.3 | |
Labour | F. E. White | 8,875 | 17.0 | -8.3 | |
Majority | 34,389 | 66.0 | +37.6 | ||
Turnout | 52,139 | 79.3 | +1.6 | ||
Conservative hold | Swing | ||||
Party | Candidate | Votes | % | ±% | |
---|---|---|---|---|---|
Unionist | Cyril Culverwell | 25,416 | 53.7 | −25.3 | |
Labour | Clare Annesley | 11,961 | 25.3 | +4.3 | |
Liberal | William Nichols Marcy | 9,909 | 21.0 | N/A | |
Majority | 13,455 | 28.4 | −29.6 | ||
Turnout | 47,286 | 77.7 | +2.6 | ||
Registered electors | 60,844 | ||||
Unionist hold | Swing | −14.8 | |||
Party | Candidate | Votes | % | ±% | |
---|---|---|---|---|---|
Unionist | Cyril Culverwell | 16,970 | 57.2 | −21.8 | |
Labour | Clare Annesley | 7,702 | 26.0 | +5.0 | |
Liberal | William Nichols Marcy | 4,996 | 16.8 | New | |
Majority | 9,268 | 31.2 | −26.8 | ||
Turnout | 29,688 | 67.6 | −7.5 | ||
Registered electors | 43,900 | ||||
Unionist hold | Swing | −13.4 | |||
Party | Candidate | Votes | % | ±% | |
---|---|---|---|---|---|
Unionist | George Gibbs | 23,574 | 79.0 | N/A | |
Labour | Matt Giles | 6,276 | 21.0 | New | |
Majority | 17,298 | 58.0 | N/A | ||
Turnout | 29,850 | 75.1 | N/A | ||
Registered electors | 39,752 | ||||
Unionist hold | Swing | N/A | |||
Party | Candidate | Votes | % | ±% | |
---|---|---|---|---|---|
Unionist | George Gibbs | Unopposed | |||
Unionist hold | |||||
Party | Candidate | Votes | % | ±% | |
---|---|---|---|---|---|
Unionist | George Gibbs | 18,124 | 62.0 | N/A | |
Liberal | Frank Raffety | 11,100 | 38.0 | New | |
Majority | 7,024 | 24.0 | N/A | ||
Turnout | 29,224 | 76.9 | N/A | ||
Registered electors | 38,013 | ||||
Unionist hold | Swing | N/A | |||
Party | Candidate | Votes | % | ±% | |
---|---|---|---|---|---|
C | Unionist | George Gibbs | Unopposed | ||
Unionist hold | |||||
Cindicates candidate endorsed by the coalition government. |
Party | Candidate | Votes | % | ±% | |
---|---|---|---|---|---|
C | Unionist | George Gibbs | Unopposed | ||
Unionist hold | |||||
Cindicates candidate endorsed by the coalition government. |
Party | Candidate | Votes | % | ±% | |
---|---|---|---|---|---|
Conservative | Michael Hicks Beach | 3,876 | 61.1 | ||
Liberal | Brinsley de Courcy Nixon | 2,463 | 38.9 | ||
Majority | 1,413 | 22.2 | |||
Turnout | 6,339 | 82.8 | |||
Registered electors | 7,657 | ||||
Conservative win (new seat) |
Party | Candidate | Votes | % | ±% | |
---|---|---|---|---|---|
Conservative | Michael Hicks Beach | 3,819 | 68.0 | 6.9 | |
Liberal | James Judd | 1,801 | 32.0 | 6.9 | |
Majority | 2,018 | 36.0 | 13.8 | ||
Turnout | 5,620 | 73.4 | 9.4 | ||
Registered electors | 7,657 | ||||
Conservative hold | Swing | 6.9 | |||
Hicks Beach was appointed Chief Secretary to the Lord Lieutenant of Ireland, requiring a by-election.
Party | Candidate | Votes | % | ±% | |
---|---|---|---|---|---|
Conservative | Michael Hicks Beach | Unopposed | |||
Conservative hold | |||||
Hicks Beach was appointed President of the Board of Trade, requiring a by-election.
Party | Candidate | Votes | % | ±% | |
---|---|---|---|---|---|
Conservative | Michael Hicks Beach | Unopposed | |||
Conservative hold | |||||
Party | Candidate | Votes | % | ±% | |
---|---|---|---|---|---|
Conservative | Michael Hicks Beach | Unopposed | |||
Conservative hold | |||||
Party | Candidate | Votes | % | ±% | |
---|---|---|---|---|---|
Conservative | Michael Hicks Beach | Unopposed | |||
Conservative hold | |||||
Party | Candidate | Votes | % | ±% | |
---|---|---|---|---|---|
Conservative | Michael Hicks Beach | 3,815 | 67.4 | N/A | |
Liberal | Henry Hamilton Lawless | 1,842 | 32.6 | New | |
Majority | 1,973 | 34.8 | N/A | ||
Turnout | 5,657 | 69.5 | N/A | ||
Registered electors | 8,144 | ||||
Conservative hold | Swing | N/A | |||
Party | Candidate | Votes | % | ±% | |
---|---|---|---|---|---|
Conservative | Michael Hicks Beach | Unopposed | |||
Conservative hold | |||||
Party | Candidate | Votes | % | ±% | |
---|---|---|---|---|---|
Conservative | George Gibbs | 4,267 | 52.2 | N/A | |
Liberal | Thomas Lennard | 3,902 | 47.8 | New | |
Majority | 365 | 4.4 | N/A | ||
Turnout | 8,169 | 86.7 | N/A | ||
Registered electors | 9,423 | ||||
Conservative hold | Swing | N/A | |||
Party | Candidate | Votes | % | ±% | |
---|---|---|---|---|---|
Conservative | George Gibbs | 5,159 | 57.1 | 4.9 | |
Liberal | Walter Saise | 3,881 | 42.9 | 4.9 | |
Majority | 1,278 | 14.2 | 9.8 | ||
Turnout | 9,040 | 89.3 | 2.6 | ||
Registered electors | 10,127 | ||||
Conservative hold | Swing | 4.9 | |||
Party | Candidate | Votes | % | ±% | |
---|---|---|---|---|---|
Conservative | George Gibbs | 4,871 | 57.5 | 0.4 | |
Liberal | Joseph Weston Stevens | 3,595 | 42.5 | 0.4 | |
Majority | 1,276 | 15.0 | 0.8 | ||
Turnout | 8,466 | 83.6 | 5.7 | ||
Registered electors | 10,127 | ||||
Conservative hold | Swing | 0.4 | |||
General Election 1914–15:
Another General Election was required to take place before the end of 1915. The political parties had been making preparations for an election to take place and by the July 1914, the following candidates had been selected;
Bishopston is a suburb of the city of Bristol in south west England. Bishopston is around Gloucester Road (A38), the main northern arterial road in the city and Bishop Road.
Reading East is a constituency represented in the House of Commons of the UK Parliament since 2017 by Matt Rodda, of the Labour Party. The seat is one of two Labour seats from a total of eight seats in Berkshire.
Horfield is a suburb of the city of Bristol, in southwest England. It lies on Bristol's northern edge, its border with Filton marking part of the boundary between Bristol and South Gloucestershire. Bishopston lies directly to the south. Monks Park and Golden Hill are to the west. Lockleaze and Ashley Down are on the eastern fringe. The Gloucester Road (A38) runs north–south through the suburb.
Birkenhead is a constituency in Merseyside represented in the House of Commons of the UK Parliament since 2019 by Mick Whitley of the Labour Party.
Greenwich and Woolwich is a constituency represented in the House of Commons of the UK Parliament since 2015 by Matthew Pennycook of the Labour Party.
Bristol North West is a constituency represented in the House of Commons of the UK Parliament since 2017 by Darren Jones of the Labour Party.
Bristol East is a constituency recreated in 1983 covering the eastern part of the City of Bristol, represented in the House of Commons of the UK Parliament since 2005 by Kerry McCarthy of the Labour Party.
Redland is a neighbourhood in Bristol, England. The neighbourhood is situated between Clifton, Cotham, Bishopston and Westbury Park. The boundaries of the district are not precisely defined, but are generally taken to be Whiteladies Road in the west, the Severn Beach railway line in the south and Cranbrook Road in the east.
Stephen Roy Williams is a British Liberal Democrat politician who served as Member of Parliament (MP) for Bristol West from the 2005 general election until his defeat by Labour Party candidate Thangam Debbonaire in 2015. As an MP, he served in the Cameron–Clegg coalition government as Parliamentary Under-Secretary of State in the Department of Communities and Local Government from 2013 to 2015.
Henleaze is a northern suburb of the city of Bristol in South West England.
The city of Bristol, England, is divided into many areas, which often overlap or have non-fixed borders. These include Parliamentary constituencies, council wards and unofficial neighbourhoods. There are no civil parishes in Bristol.
Bristol Central is a parliamentary constituency to be represented in the House of Commons of the Parliament of the United Kingdom, located within the City of Bristol, in South West England, from the 2024 general election. It returns one Member of Parliament (MP) to the House of Commons of the Parliament of the United Kingdom.
Westbury Park is a suburb of the city of Bristol, United Kingdom. It lies to the east of Durdham Down between the districts of Redland and Henleaze. The area is very similar in character to nearby Redland and comprises mainly Victorian and early twentieth-century architecture, along with a selection of Georgian buildings. Many of these buildings still have their original house names and many Victorian artifacts have been found in the gardens of Westbury Park.
The region of South West England has, since the 2010 general election, 55 parliamentary constituencies which is made up of 15 borough constituencies and 40 county constituencies. At that election the Conservative Party held the largest number of constituencies, with 36. The Liberal Democrats had 15 and Labour had 4. At the 2015 general election the Liberal Democrats lost all of their seats, while the Conservatives gained one seat from Labour, leaving the Conservatives with 51 and Labour with 4. In the 2017 general election, the Conservatives remained, by far, the largest party with 47 seats, though losing three to Labour, who won 7, and one to the Liberal Democrats, who won 1. In the 2019 general election, the Conservatives increased their number of seats to 48 by regaining Stroud from Labour, who held their other six seats, while the Liberal Democrats retained their sole seat in Bath.
The 2009 Bristol City Council elections were held on Thursday 4 June 2009, for 23 seats, that being one-third of the total number of councilors. The Liberal Democrats who had been leading a minority administration, won an overall majority of the council, the first time the party had achieved this on Bristol City Council. The Liberal Democrats were defending 11 seats, the Labour Party 10 and the Conservatives 2.
The 2010 Bristol City Council elections were held on Thursday 6 May 2010, for 23 seats, that being one third of the total number of councillors. The Liberal Democrats, who had won overall control of the council in 2009, increased their majority to six seats.
Elections for one third of Bristol City Council were held on 2 May 2013 as part of the 2013 United Kingdom local elections. No party gained overall control of the chamber, although administrative power rested with the Mayor of Bristol, who had been first elected in November 2012
The 2021 Bristol City Council election took place on 6 May 2021 to elect members of Bristol City Council in England. It coincided with nationwide local elections. Voters in the city also voted for the mayor of Bristol, the mayor of West of England and for Avon and Somerset's police and crime commissioner. The election was originally due to take place in May 2020, but was postponed due to the COVID-19 pandemic.
Bishopston and Ashley Down is one of the thirty-four council wards in the city of Bristol in the Southwest of England, United Kingdom.