| |||||||||||||||||||||||||||||||||||||||||||||||||
All 47 seats to City of York Council | |||||||||||||||||||||||||||||||||||||||||||||||||
| |||||||||||||||||||||||||||||||||||||||||||||||||
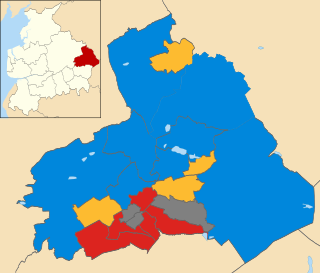
Map of results of 2011 election | |||||||||||||||||||||||||||||||||||||||||||||||||
|
Elections to City of York Council were held on Thursday 5 May 2011. The whole council was up for election. The vote took place alongside the United Kingdom Alternative Vote referendum, 2011.
York is a historic walled city in North Yorkshire, England. At the confluence of the Rivers Ouse and Foss, it is the historic county town of the historic county of Yorkshire. York Minster and a variety of cultural and sporting activities make it a popular tourist destination.
The Labour Party gained overall control of the council from no overall control. Labour had previously won a majority of seats on the new York unitary council in 1995 and again in 1999. The Liberal Democrats had controlled the council outright since 2003 and led a minority administration since the 2007 election.
The Labour Party is a centre-left political party in the United Kingdom which has been described as an alliance of social democrats, democratic socialists and trade unionists. The party's platform emphasises greater state intervention, social justice and strengthening workers' rights.
In the context of local authorities in the United Kingdom, the term no overall control refers to a situation in which no single political group achieves a majority of seats; and is analogous to a hung parliament. Of the 310 councils who had members up for election in the 2007 local elections, 85 resulted in a NOC administration.
A unitary authority is a type of local authority that has a single tier and is responsible for all local government functions within its area or performs additional functions which elsewhere in the relevant country are usually performed by national government or a higher level of sub-national government.
Andrew Waller, leader of the Liberal Democrats group and former leader of the Council, was not reelected. [1] Councillor Carol Runciman became leader of the Liberal Democrats group but stepped down in May 2013 and was replaced by Councillor Keith Aspden. [2] Councillor Chris Steward became leader of the Conservative group in January 2014, succeeding Councillor Ian Gillies. [3] Councillor James Alexander resigned as leader of the Labour Group and leader of the Council in November 2014, [4] with Councillor Dafydd Williams taking on both of these roles. [5] [6]
In August 2012, Lynn Jeffries, a Labour councillor resigned the whip in protest at the Council's cuts to social care, bringing the number of Independent Councillors to two; [7] she subsequently joined the Liberal Democrat group. [8] Labour Councillor Brian Watson became an independent councillor in May 2014 after being deselected in Guildhall ward. [9] In September 2014, Councillor Helen Douglas resigned from the Labour group and joined the Conservatives leading to Labour losing overall control of the Council. [10] Councillors Ken King and David Scott resigned from the Labour group in October 2014. [11] One seat was vacant following the death of councillor Lynn Jeffries in August 2014. [12] The subsequent by-election held in October 2014 was won by Liberal Democrat former Council leader Andrew Waller. [13] Conservative councillor Joe Watt left the Conservatives group in January 2015 after falling out with party leader Chris Steward. [14]
Party | Seats | Gains | Losses | Net gain/loss | Seats % | Votes % | Votes | +/− | |
---|---|---|---|---|---|---|---|---|---|
Labour | 26 | 8 | 0 | +8 | 55.3 | 31.6 | 20297 | +9.2% | |
Conservative | 10 | 3 | 0 | +3 | 24.1 | 21.9 | 15472 | -2.7% | |
Liberal Democrat | 8 | 0 | 12 | -12 | 17 | 26.4 | 16888 | -3.8% | |
Green | 2 | 0 | 0 | 0 | 4.3 | 14.6 | 9349 | -0.4% | |
Independent | 1 | 1 | 0 | +1 | 2.1 | 0.4 | 630 | +0.4% | |
BNP | 0 | 0 | 0 | 0 | 0 | 0.7 | 1076 | -4.1% | |
UKIP | 0 | 0 | 0 | 0 | 0 | 0.2 | 263 | +0.2% | |
TUSC | 0 | 0 | 0 | 0 | 0 | 0.1 | 219 | +0.1% | |
Party | Candidate | Votes | % | ± | |
---|---|---|---|---|---|
Labour | David Horton | 1571 | 31.4 | 6.4 | |
Labour | Tracey Simpson-Laing | 1528 | 30.5 | 5.6 | |
Conservative | Kirsten Ovenden | 597 | 11.9 | 1.8 | |
Conservative | Michael Tucker | 529 | 10.6 | 2.4 | |
Liberal Democrat | Reuban Mayne | 221 | 4.4 | -3.7 | |
Liberal Democrat | Samantha Jane Waudby | 148 | 3.0 | -4.7 | |
Green | John Norris | 165 | 3.3 | -2.4 | |
Green | Chantal Purchase | 147 | 2.9 | 2.9 | |
BNP | Trevor Brown | 103 | 2.1 | -7.9 | |
Turnout | 42.3 | 2.2 | |||
Labour hold | Swing | 2.3 | |||
Labour hold | Swing | 1.6 | |||
Party | Candidate | Votes | % | ± | |
---|---|---|---|---|---|
Conservative | John Galvin | 908 | 50.0 | 0.6 | |
Liberal Democrat | Carole Green | 488 | 26.9 | -2.4 | |
Labour | Benjamin Fox | 327 | 18.0 | 5.4 | |
Green | Jennifer Aitken | 94 | 5.2 | -3.7 | |
Turnout | 55.9 | 1.6 | |||
Conservative hold | Swing | 1.5 | |||
Party | Candidate | Votes | % | ± | |
---|---|---|---|---|---|
Labour | Helen Douglas | 1655 | 18.5 | 2.5 | |
Labour | Ken King | 1522 | 17.0 | 0.1 | |
Labour | David Scott | 1395 | 15.6 | 1.0 | |
Green | Ginnie Shaw | 777 | 8.7 | -0.1 | |
Conservative | Tom McConnell | 630 | 7.0 | 0.2 | |
Liberal Democrat | Richard Hill | 608 | 6.8 | 0.3 | |
Conservative | Matt Stephens | 606 | 6.8 | 0.0 | |
Green | Alan Dunnett | 493 | 5.5 | -3.2 | |
Liberal Democrat | Derek Waudby | 433 | 4.8 | -1.0 | |
Green | June Tranmer | 421 | 4.7 | 4.7 | |
Liberal Democrat | Davinia Walsh | 404 | 4.5 | -1.9 | |
Turnout | 8931 | 35.2 | 1.7 | ||
Labour hold | Swing | 1.3 | |||
Labour hold | Swing | -0.1 | |||
Labour hold | Swing | 0.3 | |||
Party | Candidate | Votes | % | ± | |
---|---|---|---|---|---|
Conservative | Jenny Brooks | 943 | 56.7 | 5.0 | |
Liberal Democrat | Linda Maggs | 562 | 33.8 | 2.2 | |
Labour | Andrew Collingwood | 100 | 6 | -7.3 | |
Green | Alice Rowan | 58 | 3.5 | 0.2 | |
Turnout | 1663 | 60.0 | 6.5 | ||
Conservative hold | Swing | 1.4 | |||
Party | Candidate | Votes | % | ± | |
---|---|---|---|---|---|
Liberal Democrat | Ann Reid | 1509 | 11.7 | -2.9 | |
Labour | Gerard Hodgson | 1508 | 11.7 | 4.2 | |
Labour | Anna Semlyen | 1504 | 11.7 | 3.2 | |
Labour | Benjamin Tanguay | 1377 | 10.7 | 2.9 | |
Liberal Democrat | Thomas Holvey | 1322 | 10.3 | -2.8 | |
Conservative | Adam Sinclair | 1309 | 10.2 | -0.3 | |
Conservative | Geoffrey Widdows | 1165 | 9.1 | -1.0 | |
Conservative | Thomas Wiseman | 1155 | 9.0 | -0.7 | |
Liberal Democrat | Tommy Spencer | 1065 | 8.3 | -5.3 | |
Green | Bronwen Gray | 352 | 2.7 | -1.8 | |
Green | John Gray | 303 | 2.4 | 2.4 | |
Green | Phoebe Taylor | 285 | 2.2 | 2.2 | |
Turnout | 12854 | 51.0 | 5.8 | ||
Liberal Democrat hold | Swing | -2.9 | |||
Labour gain from Liberal Democrat | Swing | 3.5 | |||
Labour gain from Liberal Democrat | Swing | 1.8 | |||
Party | Candidate | Votes | % | ± | |
---|---|---|---|---|---|
Green | Andy D'Agorne | 1632 | 29.5 | 4.6 | |
Green | Dave Taylor | 1422 | 25.7 | 5.0 | |
Labour | Kristina Blenkharn | 963 | 17.4 | 3.9 | |
Labour | Daniel Sidley | 765 | 13.8 | 2.8 | |
UKIP | Judith Morris | 263 | 4.8 | 4.8 | |
Liberal Democrat | Dean Knapper | 257 | 4.7 | 1.7 | |
Liberal Democrat | James Whiteside | 222 | 4.0 | 1.2 | |
Turnout | 5524 | 44.7 | -0.2 | ||
Green hold | Swing | 0.3 | |||
Green hold | Swing | 1.1 | |||
Party | Candidate | Votes | % | ± | |
---|---|---|---|---|---|
Liberal Democrat | Keith Aspden | 593 | 48.8 | 4.4 | |
Labour | Owain Gardner | 374 | 30.8 | 7.3 | |
Conservative | Andrew Simpson | 181 | 14.9 | 1.4 | |
Green | Candida Spillard | 68 | 5.6 | -13.1 | |
Turnout | 1216 | 55.8 | 4.2 | ||
Liberal Democrat hold | Swing | -1.4 | |||
Party | Candidate | Votes | % | ± | |
---|---|---|---|---|---|
Labour | Janet Looker | 978 | 25.2 | 1.1 | |
Labour | Brian Watson | 881 | 22.7 | 2.6 | |
Conservative | Lynne Carty | 537 | 13.8 | 1.2 | |
Green | Denise Craghill | 537 | 13.8 | 4.6 | |
Green | Andreas Heinemeyer | 326 | 8.4 | 0.8 | |
Liberal Democrat | Ian Packington | 313 | 8.1 | 2.5 | |
Liberal Democrat | Lizzie Beardsley | 310 | 8.0 | 2.6 | |
Turnout | 3882 | 35.1 | 3.9 | ||
Labour hold | Swing | 0.0 | |||
Labour hold | Swing | -1.0 | |||
Party | Candidate | Votes | % | ± | |
---|---|---|---|---|---|
Liberal Democrat | Paul Firth | 1908 | 14.8 | 0.5 | |
Conservative | Tony Richardson | 1729 | 13.4 | 0.4 | |
Liberal Democrat | Ian Cuthbertson | 1616 | 13.5 | -3.0 | |
Conservative | Roy Watson-Smith | 1561 | 12.1 | -0.5 | |
Conservative | Adrian Clarke | 1532 | 11.9 | 0.1 | |
Liberal Democrat | Jonathan Lancaster | 1364 | 10.6 | -3.0 | |
Labour | Mark Baker | 1117 | 8.7 | 3.8 | |
Labour | Patrick Evans | 792 | 6.1 | 1.8 | |
Labour | Jason Rose | 743 | 5.8 | 5.8 | |
Green | Alan Robertshaw | 535 | 4.1 | -0.7 | |
Turnout | 12897 | 47.9 | 3.6 | ||
Liberal Democrat hold | Swing | 0.5 | |||
Conservative gain from Liberal Democrat | Swing | 1.7 | |||
Liberal Democrat hold | Swing | -1.5 | |||
Party | Candidate | Votes | % | ± | |
---|---|---|---|---|---|
Labour | David Levene | 670 | 45.4 | 23.2 | |
Green | Caleb Wooding | 449 | 30.4 | 7.0 | |
Liberal Democrat | Christopher Wiggin | 358 | 24.2 | -14.2 | |
Turnout | 1477 | 37.8 | 0.6 | ||
Labour gain from Liberal Democrat | Swing | 18.7 | |||
Party | Candidate | Votes | % | ± | |
---|---|---|---|---|---|
Labour | Barbara Boyce | 1784 | 18.9 | 2.7 | |
Labour | Ruth Potter | 1702 | 18.1 | 2.0 | |
Labour | Christina Funnell | 1684 | 17.9 | 2.6 | |
Conservative | Jennifer Gambold | 863 | 9.2 | 0.0 | |
Conservative | Andrew Kay | 853 | 9.0 | -0.1 | |
Green | Stuart Oxbrow | 473 | 5.0 | -2.9 | |
Liberal Democrat | David Barker | 468 | 5.0 | -0.4 | |
Green | Stephen Walwyn | 427 | 4.5 | 4.5 | |
Liberal Democrat | Stelhan Ariyadasa-Sáez | 347 | 3.7 | -1.1 | |
Liberal Democrat | Frances Ryan | 324 | 3.4 | -0.8 | |
BNP | Jeff Kelly | 285 | 3.0 | -2.6 | |
TUSC | Nigel Smith | 219 | 2.3 | 2.3 | |
Turnout | 36.4 | -1.1 | |||
Labour hold | Swing | 1.4 | |||
Labour hold | Swing | 1.0 | |||
Labour hold | Swing | 2.8 | |||
Party | Candidate | Votes | % | ± | |
---|---|---|---|---|---|
Liberal Democrat | Nigel Ayre | 951 | 52.6 | 16.9 | |
Conservative | Laura Parrish | 438 | 24.4 | -13.5 | |
Labour | Charmian Walter | 288 | 15.9 | -1.0 | |
Green | Catherine Heinemeyer | 80 | 4.4 | 0.0 | |
BNP | Cathy Smurthwaite | 51 | 2.8 | 2.8 | |
Turnout | 1864 | 58.5 | 3.4 | ||
Liberal Democrat gain from Conservative | Swing | 15.2 | |||
Compared with 2007 results. The Liberal Democrats had previously gained this seat in a by-election in September 2007. [28]
Party | Candidate | Votes | % | ± | |
---|---|---|---|---|---|
Labour | James Alexander | 2211 | 18.9 | 5.7 | |
Labour | Sonja Crisp | 1991 | 17.0 | 4.8 | |
Labour | Joseph Riches | 1793 | 15.3 | 1.4 | |
Liberal Democrat | Martin Bartlett | 1263 | 10.8 | -0.5 | |
Liberal Democrat | Simon Rodgers | 1193 | 10.2 | -1.8 | |
Liberal Democrat | Nick Love | 1143 | 9.8 | -0.7 | |
Conservative | Matthew Keighley | 623 | 5.3 | -0.7 | |
Conservative | Petra Sobotkova | 474 | 4.1 | -1.6 | |
Green | Rodney Bell | 449 | 3.8 | -2.6 | |
Green | Owen Clayton | 360 | 3.1 | 3.1 | |
BNP | Lisa Kelly | 195 | 1.7 | -2.7 | |
Turnout | 11695 | 44.4 | 1.2 | ||
Labour hold | Swing | 3.1 | |||
Labour hold | Swing | 3.3 | |||
Labour hold | Swing | 1.1 | |||
Party | Candidate | Votes | % | ± | |
---|---|---|---|---|---|
Labour | Neil Barnes | 1172 | 26.5 | 8.2 | |
Labour | Fiona Fitzpatrick | 1046 | 23.7 | 5.8 | |
Conservative | Sam Croft | 626 | 14.2 | -0.2 | |
Liberal Democrat | Josh Allen | 460 | 10.4 | 1.2 | |
Green | John Cossham | 397 | 9.0 | 1.4 | |
Green | Luke Capps | 370 | 8.4 | 1.1 | |
Liberal Democrat | Jonathan Pannell | 351 | 7.9 | 0.5 | |
Turnout | 4422 | 35.1 | -0.7 | ||
Labour hold | Swing | 4.2 | |||
Labour hold | Swing | 2.3 | |||
Party | Candidate | Votes | % | ± | |
---|---|---|---|---|---|
Liberal Democrat | Keith Hyman | 2015 | 19.5 | 0.8 | |
Liberal Democrat | Keith Orrell | 1910 | 18.5 | -0.1 | |
Liberal Democrat | Carol Runciman | 1863 | 18.0 | 0.4 | |
Labour | Margaret Wells | 1254 | 12.1 | 5.2 | |
Labour | Robert Purrington | 1167 | 11.3 | 4.8 | |
Labour | Thomas Williams | 972 | 9.4 | 9.4 | |
Green | Clive Woolley | 546 | 5.3 | -1.6 | |
Green | Roxanne Kovacs | 350 | 3.4 | 3.4 | |
BNP | Jeffrey Kelly | 273 | 2.6 | 2.6 | |
Turnout | 10350 | 40.3 | 3.1 | ||
Liberal Democrat hold | Swing | -2.2 | |||
Liberal Democrat hold | Swing | -2.4 | |||
Liberal Democrat hold | Swing | -4.5 | |||
Party | Candidate | Votes | % | ± | |
---|---|---|---|---|---|
Labour | Julie Gunnell | 2049 | 16.7 | 3.4 | |
Labour | Sandy Fraser | 1977 | 16.1 | 2.7 | |
Labour | David Merrett | 1873 | 15.3 | 1.7 | |
Green | Andrew Chase | 1622 | 13.2 | 0.5 | |
Green | Caroline Boreham | 1094 | 8.9 | -0.9 | |
Green | Alan Swain | 854 | 7.0 | -4.4 | |
Conservative | Marc Allinson | 828 | 6.7 | 0.5 | |
Conservative | Bob Schofield | 679 | 5.5 | -0.2 | |
Liberal Democrat | Ashley Mason | 611 | 5.0 | 1.5 | |
Liberal Democrat | Matthew Reid | 355 | 2.9 | 0.2 | |
Liberal Democrat | Susan Willer | 325 | 2.6 | 0.2 | |
Turnout | 12267 | 47.1 | 4.3 | ||
Labour hold | Swing | 1.5 | |||
Labour hold | Swing | 1.8 | |||
Labour hold | Swing | 3.0 | |||
Party | Candidate | Votes | % | ± | |
---|---|---|---|---|---|
Independent | Mark Warters | 630 | 46.2 | 46.2 | |
Liberal Democrat | Jonathan Morley | 250 | 18.3 | -22.4 | |
Labour | Thomas Corker | 231 | 16.9 | -2.8 | |
Conservative | Robin Dickson | 216 | 15.8 | -12.5 | |
Green | Spinoza Pitman | 38 | 1.8 | -8.6 | |
Turnout | 1365 | 40.3 | -2.2 | ||
Independent gain from Liberal Democrat | Swing | 34.3 | |||
Party | Candidate | Votes | % | ± | |
---|---|---|---|---|---|
Conservative | Ian Gillies | 2298 | 18.8 | 1.8 | |
Conservative | Paul Healey | 1889 | 15.5 | 0.6 | |
Conservative | Chris Steward | 1690 | 13.8 | -0.4 | |
Liberal Democrat | Glen Bradley | 1232 | 10.1 | -3.9 | |
Liberal Democrat | Quentin MacDonald | 1027 | 8.4 | -4.7 | |
Liberal Democrat | Richard Brown | 1011 | 8.3 | -4.0 | |
Labour | Jacob Lister | 855 | 7.0 | 2.1 | |
Labour | William Owen | 686 | 5.6 | 1.1 | |
Labour | Iain Simpson-Laing | 669 | 5.5 | 5.5 | |
Green | Gillian Cossham | 298 | 2.4 | -2.5 | |
Green | Eve Halliday | 298 | 2.4 | 2.4 | |
Green | Charles Everett | 253 | 1.1 | 2.1 | |
Turnout | 12206 | 52.9 | 2.3 | ||
Conservative hold | Swing | 2.9 | |||
Conservative hold | Swing | 2.7 | |||
Conservative hold | Swing | 1.8 | |||
Party | Candidate | Votes | % | ± | |
---|---|---|---|---|---|
Labour | Linsay Cunningham-Cross | 1498 | 12.4 | 4.7 | |
Labour | Neil McIlveen | 1456 | 12.1 | 5.1 | |
Conservative | Joe Watt | 1435 | 11.9 | -0.8 | |
Labour | Tracy White | 1405 | 11.6 | 4.9 | |
Conservative | Ben Carty | 1316 | 10.9 | -0.9 | |
Conservative | Stuart Rawlings | 1268 | 10.5 | 2.1 | |
Liberal Democrat | Richard Shrimpton | 1088 | 9.0 | -4.3 | |
Liberal Democrat | Neil Gowans | 848 | 7.0 | -5.2 | |
Liberal Democrat | Donald Smith | 764 | 6.3 | -4.5 | |
Green | Nathan Adams | 300 | 2.5 | -2.5 | |
Green | David Williams | 277 | 2.3 | 2.3 | |
Green | Joel Hellewell | 242 | 2.0 | 2.0 | |
BNP | Terry Chafer | 169 | 1.4 | -2.8 | |
Turnout | 12066 | 42.7 | 3.8 | ||
Labour gain from Liberal Democrat | Swing | 4.5 | |||
Labour gain from Liberal Democrat | Swing | 5.1 | |||
Conservative hold | Swing | -2.8 | |||
Party | Candidate | Votes | % | ± | |
---|---|---|---|---|---|
Conservative | Paul Doughty | 1294 | 26.7 | 9.5 | |
Conservative | Sian Wiseman | 1255 | 25.9 | 3.6 | |
Liberal Democrat | Madeleine Kirk | 792 | 16.3 | -10.5 | |
Labour | Alexander Forbes | 499 | 10.3 | 4.6 | |
Liberal Democrat | Pat Hearn | 378 | 7.8 | -14.2 | |
Labour | Graham Meiklejohn | 348 | 7.2 | 7.2 | |
Green | Matthew Durrant | 151 | 3.1 | -2.9 | |
Green | Matthew Whitfield | 131 | 2.7 | 2.7 | |
Turnout | 4848 | 42.2 | 3.3 | ||
Conservative hold | Swing | 10.0 | |||
Conservative gain from Liberal Democrat | Swing | 8.9 | |||
Party | Candidate | Votes | % | ± | |
---|---|---|---|---|---|
Labour | Stephen Burton | 1767 | 17.1 | 7.8 | |
Labour | Lynn Jeffries | 1642 | 15.9 | 6.8 | |
Labour | Dafydd Williams | 1540 | 14.9 | 6.9 | |
Liberal Democrat | Andrew Waller | 1401 | 13.6 | -1.5 | |
Liberal Democrat | Stephen Galloway | 1397 | 13.5 | -2.4 | |
Liberal Democrat | Mark Waudby | 1152 | 11.2 | -4.8 | |
Conservative | Andrew Brooks | 561 | 5.4 | 0.6 | |
Green | Alison Webb | 343 | 3.3 | -1.3 | |
Green | Jonathan Tyler | 260 | 2.5 | 2.5 | |
Green | Daniella Webb | 253 | 2.5 | 2.5 | |
Turnout | 10316 | 38.0 | 3.0 | ||
Labour gain from Liberal Democrat | Swing | 4.6 | |||
Labour gain from Liberal Democrat | Swing | 5.9 | |||
Party | Candidate | Votes | % | ± | |
---|---|---|---|---|---|
Conservative | George Barton | 970 | 56.2 | 17.2 | |
Liberal Democrat | Christian Vassie | 457 | 26.5 | -21.4 | |
Labour | Susan Watson | 234 | 13.6 | 4.5 | |
Green | Tracy Lynn Shippey | 65 | 3.8 | -0.4 | |
Turnout | 1726 | 53.6 | 2.5 | ||
Conservative gain from Liberal Democrat | Swing | 19.3 | |||
Aberdeen City Council represents the Aberdeen City council area of Scotland.
Birmingham City Council is the local government body responsible for the governance of the City of Birmingham in England, which has been a metropolitan district since 1974. It is the most populated local council in the United Kingdom with, following a reorganisation of boundaries in June 2004, 120 Birmingham City councillors representing over one million people, in 40 wards. This means that Birmingham is technically the largest city in the United Kingdom. The council headquarters are at the Council House in the city centre. The council is responsible for running nearly all local services, with the exception of those run by joint boards. The provision of certain services has in recent years been devolved to several council constituencies, which each have a constituency committee made up of councillors from that district.
The Metropolitan Borough of Wirral is a metropolitan borough of Merseyside, in North West England. It has a population of 321,238, and encompasses 60 square miles (160 km2) of the northern part of the Wirral Peninsula. Major settlements include Birkenhead, Wallasey, Bebington, Heswall, Hoylake and West Kirby. The city of Liverpool over the Mersey, faces the northeastern side of Wirral. Bordering is the River Mersey to the east, the Irish Sea to the north and the River Dee to the west; the borough of Cheshire West and Chester occupies the remainder of the Wirral Peninsula and borders the borough of Wirral to the south. The borough of Wirral has greater proportions of rural areas than the Liverpool part of Merseyside.
Liverpool City Council is the governing body for the city of Liverpool in Merseyside, England. It consists of 90 councillors, three for each of the city's 30 wards.
The English Democrats is an English nationalist political party in England.
Oxford City Council provides local government for the city of Oxford in England.
Cornwall Council is the unitary authority for the county of Cornwall in the United Kingdom, not including the Isles of Scilly, which has its own council. The council, and its predecessor Cornwall County Council, has a tradition of large groups of independent councillors, having been controlled by independents in the 1970s and 1980s. Since the 2013 elections, it is run by an Independent-Liberal Democrat coalition.
Brent London Borough Council in London, England is elected every four years. Since the last boundary changes in 2002, 63 councillors have been elected from 21 wards.
(Kingston upon) Hull City Council is the governing body for the unitary authority and city of Kingston upon Hull. It was created in 1972 as the successor to the Corporation of Hull, which was also known as Hull Corporation and founded in 1440 by Royal charter.
The city of Bristol, England, is a unitary authority, represented by four MPs representing seats wholly within the city boundaries. As well as these, Filton and Bradley Stoke covers the northern urban fringe in South Gloucestershire and the north eastern urban fringe is in the Kingswood constituency. The overall trend of both local and national representation became left of centre, favouring the Labour Party and Liberal Democrats during the latter 20th century, but there was a shift to the right in the 2010 general election. The city has a tradition of local activism, with environmental issues and sustainable transport being prominent issues in the city.
The 2007 Harlow District Council election took place on 3 May 2007 to elect members of Harlow District Council in Essex, England. One third of the council was up for election and the council stayed under no overall control.
The 2011 St Albans City and District Council election took place on 5 May 2011 to elect members of St Albans District Council in Hertfordshire, England. One third of the council was up for election and the Liberal Democrats lost overall control of the council to no overall control.
The 2011 Pendle Borough Council election took place on 5 May 2011 to elect members of Pendle Borough Council in Lancashire, England. One third of the council was up for election and the council stayed under no overall control.
The 2011 West Berkshire Council election took place on 5 May 2011 to elect members of West Berkshire Council in Berkshire, England. The whole council was up for election and the Conservative party stayed in overall control of the council.
The 2014 Brent London Borough Council election took place on 22 May 2014 to elect members of Brent London Borough Council in London, England. The whole council was up for election and the Labour Party stayed in overall control of the council.
The 2015 City of York Council election took place on 7 May 2015 to elect members of City of York Council in England. The whole council was up for election. Turnout was substantially up across the city due to the election being held on the same day as the general election and other local elections in England.
Prenton is a Wirral Metropolitan Borough Council Ward in the Birkenhead Parliamentary constituency.
The 2018 City of Bradford Metropolitan District Council took place on 3 May 2018 to elect members of Bradford District Council in England. This was on the same day as other local elections. One councillor was elected in each ward for a four-year term so the councillors elected in 2018 last stood for election in 2014. Each ward is represented by three councillors, the election of which is staggered, so only one third of the councillors were elected in this election. Before the election there was a Labour majority and afterwards Labour had increased their majority.
Elections to City of York Council will be held on 2 May 2019, as part of the United Kingdom local elections in 2019. In 2015, the City of York Council election saw heavy losses for the then-ruling Labour Party, losing more than 40% of the 26 seats won at the previous election in 2011. The Conservatives, Liberal Democrats and Greens all made gains and two Independent councillors were also elected. Following talks between the political groups after the election, the Conservatives and Liberal Democrats agreed to run the Council as a joint administration.