Darwen | |
---|---|
Former county constituency for the House of Commons | |
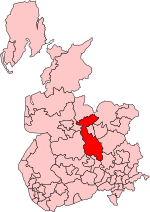
1885–1983 | |
Seats | one |
Created from | North East Lancashire |
Replaced by | Rossendale & Darwen, Blackburn, Bolton North East and Ribble Valley [1] |
Darwen was a county constituency in Lancashire, centred on the town of Darwen. It returned one Member of Parliament to the House of Commons of the Parliament of the United Kingdom from 1885 until it was abolished for the 1983 general election.
During the 1920s, the constituency was a fiercely contested marginal between the Liberal and Conservative Parties, with the sitting MP defeated at each election. At the 1924 general election, it saw a 92.7% turnout, a record for an English constituency. Following the defeat of Liberal leader Sir Herbert Samuel in 1935, the seat became a safe Conservative seat for the remainder of its existence.
It was largely replaced by the new Rossendale & Darwen constituency.
1885–1918: The Boroughs of Over Darwen and Blackburn, the Sessional Divisions of Darwen and Walton-le-Dale, and parts of the Sessional Divisions of Blackburn and Clitheroe.
1918–1950: The Borough of Darwen, the Urban District of Turton, and the Rural District of Blackburn.
1950–1955: The Borough of Darwen, the Urban Districts of Turton and Withnell, and the Rural District of Blackburn. Withnell Urban District was added from the pre-1950 Chorley constituency.
1955–1983: The St. Andrew's, St. Francis's and St. Mark's wards of the County Borough of Blackburn, the Borough of Darwen, the Urban District of Turton, and the Rural District of Blackburn.
Party | Candidate | Votes | % | ±% | |
---|---|---|---|---|---|
Conservative | James Gascoyne-Cecil | 5,878 | 50.0 | ||
Liberal | John Gerald Potter | 5,873 | 50.0 | ||
Majority | 5 | 0.0 | |||
Turnout | 11,751 | 93.0 | |||
Registered electors | 12,629 | ||||
Conservative win (new seat) |
Party | Candidate | Votes | % | ±% | |
---|---|---|---|---|---|
Conservative | James Gascoyne-Cecil | 6,085 | 53.2 | +3.2 | |
Liberal | John Slagg [4] | 5,359 | 46.8 | −3.2 | |
Majority | 726 | 6.4 | +6.4 | ||
Turnout | 11,444 | 90.6 | −2.4 | ||
Registered electors | 12,629 | ||||
Conservative hold | Swing | +3.2 |
Party | Candidate | Votes | % | ±% | |
---|---|---|---|---|---|
Liberal | Charles Huntington | 6,637 | 50.8 | +4.0 | |
Conservative | James Gascoyne-Cecil | 6,423 | 49.2 | −4.0 | |
Majority | 214 | 1.6 | N/A | ||
Turnout | 13,060 | 94.3 | +3.7 | ||
Registered electors | 13,844 | ||||
Liberal gain from Conservative | Swing | +4.0 |
Party | Candidate | Votes | % | ±% | |
---|---|---|---|---|---|
Conservative | John Rutherford | 7,058 | 53.2 | +4.0 | |
Liberal | Charles Huntington | 6,217 | 46.8 | −4.0 | |
Majority | 841 | 6.4 | N/A | ||
Turnout | 13,275 | 93.4 | −0.9 | ||
Registered electors | 14,220 | ||||
Conservative gain from Liberal | Swing | +4.0 |
Party | Candidate | Votes | % | ±% | |
---|---|---|---|---|---|
Conservative | John Rutherford | 7,228 | 51.7 | −1.5 | |
Liberal | Charles Huntington | 6,758 | 48.3 | +1.5 | |
Majority | 470 | 3.4 | −3.0 | ||
Turnout | 13,986 | 91.4 | −2.0 | ||
Registered electors | 15,308 | ||||
Conservative hold | Swing | −1.5 |
Party | Candidate | Votes | % | ±% | |
---|---|---|---|---|---|
Conservative | John Rutherford | 7,792 | 50.1 | −1.6 | |
Liberal | Frederick Hindle | 7,767 | 49.9 | +1.6 | |
Majority | 25 | 0.2 | −3.2 | ||
Turnout | 15,559 | 94.0 | +2.6 | ||
Registered electors | 16,544 | ||||
Conservative hold | Swing | -1.6 |
Party | Candidate | Votes | % | ±% | |
---|---|---|---|---|---|
Liberal | Frederick Hindle | 8,639 | 50.6 | +0.7 | |
Conservative | John Rutherford | 8,428 | 49.4 | −0.7 | |
Majority | 211 | 1.2 | N/A | ||
Turnout | 17,067 | 96.2 | +2.2 | ||
Registered electors | 17,734 | ||||
Liberal gain from Conservative | Swing | +0.7 |
Party | Candidate | Votes | % | ±% | |
---|---|---|---|---|---|
Conservative | John Rutherford | 8,384 | 50.6 | +1.2 | |
Liberal | Frederick Hindle | 8,169 | 49.4 | −1.2 | |
Majority | 215 | 1.2 | N/A | ||
Turnout | 16,553 | 93.3 | −2.9 | ||
Registered electors | 17,734 | ||||
Conservative gain from Liberal | Swing | +1.2 |
General Election 1914–15:
Another General Election was required to take place before the end of 1915. The political parties had been making preparations for an election to take place and by the July 1914, the following candidates had been selected;
Party | Candidate | Votes | % | ±% | |
---|---|---|---|---|---|
C | Unionist | John Rutherford | 9,014 | 40.5 | −10.1 |
Liberal | Frederick Hindle | 8,031 | 36.1 | −13.3 | |
Labour | John McGurk | 5,211 | 23.4 | New | |
Majority | 983 | 4.4 | +3.2 | ||
Turnout | 22,256 | 71.3 | −22.0 | ||
Registered electors | 31,203 | ||||
Unionist hold | Swing | +1.6 | |||
Cindicates candidate endorsed by the coalition government. |
Party | Candidate | Votes | % | ±% | |
---|---|---|---|---|---|
Unionist | Frank Sanderson | 12,218 | 42.6 | +2.1 | |
Liberal | Frederick Hindle | 11,944 | 41.6 | +5.5 | |
Labour | John McGurk | 4,528 | 15.8 | −7.6 | |
Majority | 274 | 1.0 | −3.4 | ||
Turnout | 28,690 | 91.4 | +20.1 | ||
Registered electors | 31,379 | ||||
Unionist hold | Swing | −1.7 |
Party | Candidate | Votes | % | ±% | |
---|---|---|---|---|---|
Liberal | Frederick Hindle | 14,242 | 48.8 | +7.2 | |
Unionist | Frank Sanderson | 11,432 | 39.1 | −3.5 | |
Labour | George Thompson | 3,527 | 12.1 | −3.7 | |
Majority | 2,810 | 9.7 | N/A | ||
Turnout | 29,201 | 90.6 | −0.8 | ||
Registered electors | 32,220 | ||||
Liberal gain from Unionist | Swing | +5.4 |
Party | Candidate | Votes | % | ±% | |
---|---|---|---|---|---|
Unionist | Frank Sanderson | 13,017 | 43.0 | +3.9 | |
Liberal | Frederick Hindle | 12,082 | 39.9 | −8.9 | |
Labour | Thomas Ramsden | 5,188 | 17.1 | +5.0 | |
Majority | 935 | 3.1 | N/A | ||
Turnout | 30,287 | 92.7 | +2.1 | ||
Registered electors | 32,671 | ||||
Unionist gain from Liberal | Swing | +6.4 |
Party | Candidate | Votes | % | ±% | |
---|---|---|---|---|---|
Liberal | Herbert Samuel | 15,714 | 40.9 | +1.0 | |
Unionist | Frank Sanderson | 15,252 | 39.6 | −3.4 | |
Labour | Thomas Ramsden | 7,504 | 19.5 | +2.4 | |
Majority | 462 | 1.3 | N/A | ||
Turnout | 38,470 | 92.3 | −0.4 | ||
Registered electors | 41,664 | ||||
Liberal gain from Unionist | Swing | +2.2 |
Party | Candidate | Votes | % | ±% | |
---|---|---|---|---|---|
Liberal | Herbert Samuel | 18,923 | 48.85 | ||
Conservative | Alan Graham | 14,636 | 37.78 | ||
Labour | Charles Rothwell | 5,184 | 13.38 | ||
Majority | 4,287 | 11.07 | |||
Turnout | 38,743 | 92.18 | |||
Liberal hold | Swing |
Party | Candidate | Votes | % | ±% | |
---|---|---|---|---|---|
Conservative | Stuart Russell | 15,292 | 41.11 | ||
Liberal | Herbert Samuel | 14,135 | 37.99 | ||
Labour | Frances Kerby | 7,778 | 20.90 | ||
Majority | 1,157 | 3.13 | |||
Turnout | 37,212 | 89.91 | |||
Conservative gain from Liberal | Swing |
A General election was due to take place before the end of 1940, but was postponed due to the Second World War. By 1939, the following candidates had been selected to contest this constituency;
Party | Candidate | Votes | % | ±% | |
---|---|---|---|---|---|
Conservative | Stanley Prescott | 8,869 | 50.2 | +9.1 | |
Independent Liberal | Honor Balfour | 8,799 | 49.8 | New | |
Majority | 70 | 0.4 | −2.7 | ||
Turnout | 17,668 | 45.0 | −43.9 | ||
Conservative hold | Swing |
Party | Candidate | Votes | % | ±% | |
---|---|---|---|---|---|
Conservative | Stanley Prescott | 13,623 | 41.43 | ||
Labour | Ronald Haines | 11,282 | 34.31 | ||
Liberal | Honor Balfour | 7,979 | 24.26 | ||
Majority | 2,341 | 7.12 | |||
Turnout | 32,884 | 82.68 | |||
Conservative hold | Swing |
Party | Candidate | Votes | % | ±% | |
---|---|---|---|---|---|
Conservative | Stanley Prescott | 17,903 | 48.5 | +7.1 | |
Labour | Ronald Haines | 13,334 | 36.1 | +1.8 | |
Liberal | James Booth | 5,656 | 15.3 | −9.0 | |
Majority | 4,569 | 12.4 | +5.3 | ||
Turnout | 36,893 | 89.6 | +6.9 | ||
Conservative hold | Swing |
Party | Candidate | Votes | % | ±% | |
---|---|---|---|---|---|
Conservative | Charles Fletcher-Cooke | 17,785 | 48.6 | +0.1 | |
Labour | Ronald Haines | 14,605 | 39.9 | +3.8 | |
Liberal | Roy Francis Leslie | 4,236 | 11.6 | −3.7 | |
Majority | 3,180 | 8.7 | −3.7 | ||
Turnout | 36,626 | 88.6 | −1.0 | ||
Conservative hold | Swing |
Party | Candidate | Votes | % | ±% | |
---|---|---|---|---|---|
Conservative | Charles Fletcher-Cooke | 26,729 | 58.7 | +10.1 | |
Labour | Ronald Haines | 18,813 | 41.3 | +1.4 | |
Majority | 7,916 | 17.4 | +8.7 | ||
Turnout | 45,542 | 82.3 | −6.3 | ||
Conservative hold | Swing |
Party | Candidate | Votes | % | ±% | |
---|---|---|---|---|---|
Conservative | Charles Fletcher-Cooke | 27,483 | 59.0 | +0.3 | |
Labour | Trevor Park | 19,141 | 41.0 | −1.3 | |
Majority | 8,342 | 18.0 | +0.6 | ||
Turnout | 46,624 | 84.1 | +1.8 | ||
Conservative hold | Swing |
Party | Candidate | Votes | % | ±% | |
---|---|---|---|---|---|
Conservative | Charles Fletcher-Cooke | 20,343 | 41.9 | −17.1 | |
Labour | Bob Cryer | 15,559 | 32.0 | −9.0 | |
Liberal | Stephen C. Holt | 12,641 | 26.0 | New | |
Majority | 4,784 | 9.9 | −8.0 | ||
Turnout | 48,543 | 83.7 | −0.4 | ||
Conservative hold | Swing |
Party | Candidate | Votes | % | ±% | |
---|---|---|---|---|---|
Conservative | Charles Fletcher-Cooke | 20,598 | 42.2 | +0.3 | |
Labour | Brian Whittam | 18,863 | 38.6 | +6.6 | |
Liberal | Stephen C. Holt | 9,339 | 19.1 | −6.9 | |
Majority | 1,735 | 3.6 | −6.3 | ||
Turnout | 48,800 | 82.6 | −1.1 | ||
Conservative hold | Swing |
Party | Candidate | Votes | % | ±% | |
---|---|---|---|---|---|
Conservative | Charles Fletcher-Cooke | 26,728 | 52.4 | +10.2 | |
Labour | Brian Whittam | 17,634 | 34.6 | −4.0 | |
Liberal | Alan Cooper | 6,663 | 13.1 | −6.0 | |
Majority | 9,094 | 17.8 | +14.2 | ||
Turnout | 51,025 | 76.6 | −6.0 | ||
Conservative hold | Swing |
Party | Candidate | Votes | % | ±% | |
---|---|---|---|---|---|
Conservative | Charles Fletcher-Cooke | 25,495 | 44.9 | −7.5 | |
Labour | Dale Campbell-Savours | 16,185 | 28.5 | −6.1 | |
Liberal | Alan Cooper | 15,060 | 26.5 | +13.4 | |
Majority | 9,310 | 16.4 | −1.4 | ||
Turnout | 56,740 | 81.0 | +4.4 | ||
Conservative hold | Swing |
Party | Candidate | Votes | % | ±% | |
---|---|---|---|---|---|
Conservative | Charles Fletcher-Cooke | 23,577 | 43.6 | −1.3 | |
Labour | Dale Campbell-Savours | 17,926 | 33.2 | +4.7 | |
Liberal | Alan Cooper | 12,572 | 23.3 | −3.2 | |
Majority | 5,651 | 10.4 | −6.0 | ||
Turnout | 54,075 | 76.6 | −4.4 | ||
Conservative hold | Swing |
Party | Candidate | Votes | % | ±% | |
---|---|---|---|---|---|
Conservative | Charles Fletcher-Cooke | 30,789 | 52.6 | +9.0 | |
Labour | Louise Ellman | 17,763 | 30.4 | −2.8 | |
Liberal | Alan Cooper | 9,928 | 17.0 | −6.3 | |
Majority | 13,026 | 22.3 | +11.9 | ||
Turnout | 58,480 | 78.0 | +1.4 | ||
Conservative hold | Swing |
Chorley is a constituency in Lancashire represented in the House of Commons of the UK Parliament since 1997 by Lindsay Hoyle. Hoyle was originally elected for the Labour Party, but in 2019 became the Speaker, making him unaffiliated.
Blackburn is a constituency in Lancashire, England, which is represented in the House of Commons of the UK Parliament by independent politician Adnan Hussain. From 2015 to 2024 it was represented by Kate Hollern of the Labour Party and, from 1979 to 2015, by Jack Straw who served under the Labour leaders of Neil Kinnock and John Smith and the Labour governments of Tony Blair and Gordon Brown.
Epsom was a borough constituency represented in the House of Commons of the Parliament of the United Kingdom. It elected one Member of Parliament (MP) by the first past the post system of election. From its creation in 1885 until its abolition in 1974, it was won by eight Conservatives. The winner took less than 50% of the votes in its contested elections once, in 1945, receiving 49.9% of the vote in a three-party contest. Six elections, the last being a by-election in 1912, were uncontested.
East Grinstead was a parliamentary constituency in the Kingdom of England, the Kingdom of Great Britain, and the United Kingdom. It first existed as a Parliamentary borough from 1307, returning two Members of Parliament to the House of Commons elected by the bloc vote system. The borough was disfranchised under the Reform Act 1832, but the name was revived at the 1885 election when the Redistribution of Seats Act created a new single-member county division of the same name.
Accrington was a parliamentary constituency of the House of Commons of the Parliament of the United Kingdom from 1885 to 1983. It elected one Member of Parliament (MP) by the first-past-the-post system of election.
Crewe was a constituency of the House of Commons of the Parliament of the United Kingdom from 1885 to 1983. It elected one Member of Parliament (MP) by the first past the post system of election.
Ilkeston is a former United Kingdom Parliamentary constituency. It was a constituency of the House of Commons of the Parliament of the United Kingdom. It was represented by one Member of Parliament. In 1983 it was abolished, together with South East Derbyshire, when the Derbyshire county constituencies were redrawn - the constituencies of Amber Valley and Erewash were created and the constituency of South Derbyshire was re-created.
Rossendale was a parliamentary constituency in the Lancashire, England. Created in 1885, it elected one Member of Parliament (MP) to the House of Commons of the Parliament of the United Kingdom, elected by the first-past-the-post voting system. When created it comprised the districts of Rawtenstall, Bacup, and Haslingden; Ramsbottom district was added to the constituency in 1950.
Oswestry was a United Kingdom Parliamentary constituency. It was a constituency of the House of Commons of the Parliament of the United Kingdom from 1885 to 1983, when it was renamed North Shropshire. It elected one Member of Parliament (MP) by the first past the post method of election.
Tiverton was a constituency located in Tiverton in east Devon, formerly represented in the House of Commons of the Parliament of the United Kingdom. Enfranchised as a parliamentary borough in 1615 and first represented in 1621, it elected two Members of Parliament (MPs) by the first past the post system of election until 1885. The name was then transferred to a county constituency electing one MP.
Knutsford was a county constituency in Cheshire which returned one Member of Parliament (MP) to the House of Commons of the Parliament of the United Kingdom from 1885 until it was abolished for the 1983 general election.
Isle of Thanet was a county constituency which returned one Member of Parliament (MP) to the House of Commons of the Parliament of the United Kingdom from 1885, until it was abolished for the February 1974 general election.
Faversham was a parliamentary constituency centred on the town of Faversham in Kent which returned one Member of Parliament (MP) to the House of Commons of the Parliament of the United Kingdom.
Camborne was a county constituency in Cornwall which returned one Member of Parliament to the House of Commons of the Parliament of the United Kingdom. It was created for the 1885 general election, and abolished for the 1950 general election, when it was largely replaced by the new Falmouth and Camborne.
Torquay was a county constituency in Devon, South West England, which returned one Member of Parliament to the House of Commons of the Parliament of the United Kingdom.
Howdenshire was a county constituency in Yorkshire which returned one Member of Parliament (MP) to the House of Commons of the Parliament of the United Kingdom, elected by the first past the post voting system.
Louth was a county constituency in Lincolnshire which returned one Member of Parliament (MP) to the House of Commons of the Parliament of the United Kingdom from 1885 until it was abolished for the 1983 general election.
Lowestoft is a parliamentary constituency centred on the town of Lowestoft in Suffolk. It returns one Member of Parliament (MP) to the House of Commons of the Parliament of the United Kingdom, elected by the first past the post voting system.
Woodbridge was a county constituency centred on the town of Woodbridge in Suffolk. It returned one Member of Parliament (MP) to the House of Commons of the Parliament of the United Kingdom.
East Dorset is a former United Kingdom Parliamentary constituency. It was formally known as the Eastern Division of Dorset. It was a constituency of the House of Commons of the Parliament of the United Kingdom. It was represented by one Knight of the Shire.