Electoral results for the district of Ringwood

Last updated

This is a list of electoral results for the Electoral district of Ringwood in Victorian state elections.

Contents

Members for Ringwood

First incarnation (1958–1992)
MemberPartyTerm
  Jim Manson Liberal 19581973
  Norman Lacy Liberal 19731976
  Peter McArthur Liberal 19761982
  Kay Setches Labor 19821992
Second incarnation (2014–present)
MemberPartyTerm
  Dee Ryall Liberal 20142018
  Dustin Halse Labor 20182022
  Will Fowles Labor 2022–Present

Election results

Elections in the 2020s

2022 Victorian state election: Ringwood [1]
PartyCandidateVotes%±%
Labor Will Fowles 17,85139.0−3.3
Liberal Cynthia Watson15,46733.8−9.9
Greens Reuben Steen7,10515.5+2.1
Democratic Labour Gary Ryan1,6843.7+3.7
Family First Richard Griffith-Jones1,3963.1+3.1
Animal Justice Nick Rowe1,2122.6+2.2
Freedom Robyn M. Siemer1,0382.3+2.3
Total formal votes4575396.5+1.5
Informal votes1,6763.5−1.5
Turnout 4742991.1−0.2
Two-party-preferred result
Labor Will Fowles 26,32257.5+4.3
Liberal Cynthia Watson19,43142.5−4.3
Labor hold Swing +4.3

Elections in the 2010s

2018 Victorian state election: Ringwood [2]
PartyCandidateVotes%±%
Liberal Dee Ryall 15,88344.21−3.90
Labor Dustin Halse 15,12142.08+9.60
Greens Robert Humphreys4,92613.71+2.95
Total formal votes35,93094.83−0.83
Informal votes1,9585.17+0.83
Turnout 37,88891.74−2.03
Two-party-preferred result
Labor Dustin Halse 18,97852.82+7.89
Liberal Dee Ryall 16,95247.18−7.89
Labor gain from Liberal Swing +7.89
2014 Victorian state election: Ringwood [3]
PartyCandidateVotes%±%
Liberal Dee Ryall 17,44048.1−1.6
Labor Tony Clark11,77732.5+0.7
Greens Brendan Powell3,90310.8−1.1
Independent Michael Challinger1,4404.0+4.0
Christians Karen Dobby1,1313.1+3.1
People Power Victoria Steve Raskovy2870.8+0.8
Country Alliance Brian Dungey2790.8+0.8
Total formal votes36,25795.7−0.6
Informal votes1,6434.3+0.6
Turnout 37,90093.8−1.1
Two-party-preferred result
Liberal Dee Ryall 19,91955.1−1.2
Labor Tony Clark16,25044.9+1.2
Liberal hold Swing −1.2

Elections in the 1980s

1988 Victorian state election: Ringwood
PartyCandidateVotes%±%
Labor Kay Setches 13,20346.9−5.8
Liberal Bruce Camfield12,38344.0−3.3
Democrats Sid Spindler 1,2704.5+4.5
Call to Australia Mark Ansell7832.8+2.8
Independent James Cockell5151.8+1.8
Total formal votes28,15497.1−0.8
Informal votes8422.9+0.8
Turnout 28,99692.9−0.9
Two-party-preferred result
Labor Kay Setches 14,35851.7−1.0
Liberal Bruce Camfield13,60648.3+1.0
Labor hold Swing -1.0
1985 Victorian state election: Ringwood
PartyCandidateVotes%±%
Labor Kay Setches 14,46652.7+5.5
Liberal Michael Dobson12,98647.3+6.8
Total formal votes27,45297.9
Informal votes5932.1
Turnout 28,04593.9
Labor hold Swing +0.1
1982 Victorian state election: Ringwood
PartyCandidateVotes%±%
Labor Kay Setches 13,65946.3+5.4
Liberal Peter McArthur 12,12341.1−6.7
Democrats Michael Nardella2,0917.1−3.1
Independent Robin Gardini6942.4+2.4
Democratic Labor John Garratt6552.2+2.2
Independent Wilfrid Thiele2710.9+0.9
Total formal votes29,49397.8+0.2
Informal votes6692.2−0.2
Turnout 30,16294.5+0.4
Two-party-preferred result
Labor Kay Setches 15,36052.1+6.2
Liberal Peter McArthur 14,13347.9−6.2
Labor gain from Liberal Swing +6.2

Elections in the 1970s

1979 Victorian state election: Ringwood
PartyCandidateVotes%±%
Liberal Peter McArthur 13,36447.8−11.2
Labor Robert Wallace11,43540.9−0.1
Democrats Max Capon2,84110.2+10.2
Australia Wilfid Thiele3321.2+1.2
Total formal votes27,97297.6+0.1
Informal votes6832.4−0.1
Turnout 28,65594.1+0.9
Two-party-preferred result
Liberal Peter McArthur 15,14154.1−4.9
Labor Robert Wallace12,83145.9+4.9
Liberal hold Swing -4.9
1976 Victorian state election: Ringwood
PartyCandidateVotes%±%
Liberal Peter McArthur 15,28859.0+9.7
Labor Robert Wallace10,63741.0+1.4
Total formal votes25,92597.5
Informal votes6732.5
Turnout 26,59893.2
Liberal hold Swing +2.4
1973 Victorian state election: Ringwood
PartyCandidateVotes%±%
Liberal Norman Lacy 18,96551.0+3.7
Labor Peter Fuller13,73936.9−4.7
Australia Dulcie Bethune2,6497.1+7.1
Democratic Labor Antonio De Sousa1,8405.0−6.2
Total formal votes37,19398.2+0.4
Informal votes6871.8−0.4
Turnout 37,88093.0−2.2
Two-party-preferred result
Liberal Norman Lacy 21,58958.1+1.3
Labor Peter Fuller15,60441.9−1.3
Liberal hold Swing +1.3
1970 Victorian state election: Ringwood
PartyCandidateVotes%±%
Liberal Jim Manson 13,84847.3−3.1
Labor Beatrice Rosindell12,16641.6+6.6
Democratic Labor Edmund Sablovs3,26811.2−3.4
Total formal votes29,28297.8+0.2
Informal votes6662.2−0.2
Turnout 29,94895.2+0.8
Two-party-preferred result
Liberal Jim Manson 16,62656.8−6.0
Labor Beatrice Rosindell12,65643.2+6.0
Liberal hold Swing -6.0

Elections in the 1960s

1967 Victorian state election: Ringwood
PartyCandidateVotes%±%
Liberal Jim Manson 12,37450.3−2.6
Labor Norma Sweetman8,61435.0+1.4
Democratic Labor Graeme Madigan3,58614.6+1.1
Total formal votes24,57497.6
Informal votes6072.4
Turnout 25,18194.4
Two-party-preferred result
Liberal Jim Manson 15,42162.8−1.7
Labor Norma Sweetman9,15337.2+1.7
Liberal hold Swing -1.7
1964 Victorian state election: Ringwood
PartyCandidateVotes%±%
Liberal and Country Jim Manson 19,35050.3+2.7
Labor Graham Walsh13,58035.3−1.7
Democratic Labor Kevin Adamson5,51214.3−1.1
Total formal votes38,44298.5+0.1
Informal votes5761.5−0.1
Turnout 39,01895.2−0.8
Two-party-preferred result
Liberal and Country Jim Manson 24,13662.5+1.0
Labor Graham Walsh14,30637.5−1.0
Liberal and Country hold Swing +1.0
1961 Victorian state election: Ringwood
PartyCandidateVotes%±%
Liberal and Country Jim Manson 15,88247.6−2.0
Labor David Ould12,34637.0−2.3
Democratic Labor William Johnson5,13415.4+4.3
Total formal votes33,36298.4−0.3
Informal votes5481.6+0.3
Turnout 33,91096.0+1.3
Two-party-preferred result
Liberal and Country Jim Manson 20,53061.5+2.3
Labor David Ould12,83238.5−2.3
Liberal and Country hold Swing +2.3

Elections in the 1950s

1958 Victorian state election: Ringwood
PartyCandidateVotes%±%
Liberal and Country Jim Manson 13,02149.6
Labor William Webber10,31639.3
Democratic Labor Bruce Burne2,91711.1
Total formal votes26,24498.7
Informal votes3511.3
Turnout 26,59594.7
Two-party-preferred result
Liberal and Country Jim Manson 15,55159.2
Labor William Webber10,70340.8
Liberal and Country hold Swing

Related Research Articles

<span class="mw-page-title-main">North-Eastern Metropolitan Region</span> Electoral region of the Victorian Legislative Council

North-Eastern Metropolitan Region, previously Eastern Metropolitan Region between 2006 and 2022, is one of the eight electoral regions of Victoria, Australia, which elects five members to the Victorian Legislative Council by proportional representation. The region was created in 2006 following the 2005 reform of the Victorian Legislative Council. The region was renamed to its current name since the 2022 state election.

This is a list of electoral results for the Electoral district of Cranbourne in Victorian state elections.

This is a list of electoral results for the Electoral district of Melbourne in Victorian state elections.

This is a list of electoral results for the Electoral district of Morwell in Victorian state elections.

This is a list of electoral results for the district of Mulgrave in Victorian state elections.

This is a list of electoral results for the district of Narracan in Victorian state elections.

This is a list of electoral results for the Electoral district of Narre Warren North in Victorian state elections.

This is a list of electoral results for the Electoral district of Niddrie in Victorian state elections.

This is a list of electoral results for the Electoral district of Northcote in Victorian state elections.

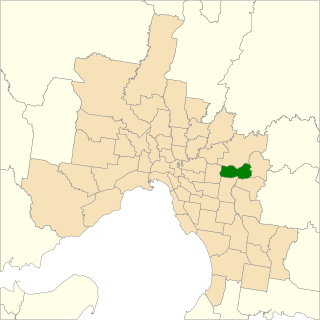
This is a list of electoral results for the Electoral district of Oakleigh in Victorian state elections.

This is a list of electoral results for the Electoral district of Polwarth in Victorian state elections.

This is a list of electoral results for the Electoral district of Sandringham in Victorian state elections.

This is a list of electoral results for the Electoral district of South-West Coast in Victorian state elections.

This is a list of electoral results for the Electoral district of Warrandyte in Victorian state elections.

<span class="mw-page-title-main">Electoral district of Ringwood (Victoria)</span> State electoral district of Victoria, Australia

The electoral district of Ringwood is an electoral district of the Victorian Legislative Assembly, located in the east of Melbourne. It was first proclaimed in 1958 and was abolished in 1992. Some of Ringwood was included in the new electoral district of Bayswater that year. Kay Setches, who was at the time the last member for Ringwood, contested and lost Bayswater at the 1992 election.

This is a list of electoral results for the Electoral district of Rowville in Victorian state elections.

This is a list of electoral results for the Electoral district of St Albans in Victorian state elections.

This is a list of electoral results for the Electoral district of Sunbury in Victorian state elections.

This is a list of electoral results for the Electoral district of Sydenham in Victorian state elections.

This is a list of electoral district results for the Victorian 2014 election for the Legislative Assembly.

References

  1. Ringwood District results, Victorian Electoral Commission. Retrieved 1 December 2022.
  2. State Election 2018: Ringwood District, VEC.
  3. State Election 2014: Ringwood District Archived 9 April 2020 at the Wayback Machine , VEC.