This is a list of electoral results for the Electoral district of Ivanhoe in Victorian state elections.
Member | Party | Term | |
---|---|---|---|
Robert Gardner | Independent | 1945–1947 | |
Rupert Curnow | Liberal | 1947–1950 | |
Frank Block | Liberal | 1951–1952 | |
Michael Lucy | Labor | 1952–1955 | |
Labor (Anti-Communist) | |||
Vernon Christie | Liberal | 1955–1973 | |
Bruce Skeggs | Liberal | 1973–1982 | |
Tony Sheehan | Labor | 1982–1985 | |
Vin Heffernan | Liberal | 1985–1996 | |
Craig Langdon | Labor | 1996–2010 | |
Anthony Carbines | Labor | 2010–present |
Party | Candidate | Votes | % | ±% | |
---|---|---|---|---|---|
Labor | Anthony Carbines | 17,333 | 42.7 | −3.7 | |
Liberal | Bernadette Khoury | 12,566 | 31.0 | −1.4 | |
Greens | Emily Bieber | 7,808 | 19.2 | +4.5 | |
Family First | Sarah Hayward | 1,216 | 3.0 | +3.0 | |
Animal Justice | Sonja Ristevski | 937 | 2.3 | +2.3 | |
Independent | Craig Langdon | 739 | 1.8 | –3.1 | |
Total formal votes | 34,509 | 96.3 | +1.1 | ||
Informal votes | 1,178 | 3.7 | −1.1 | ||
Turnout | 42,135 | 89.7 | |||
Two-party-preferred result | |||||
Labor | Anthony Carbines | 25,746 | 63.0 | +0.7 | |
Liberal | Bernadette Khoury | 15,123 | 37.0 | −0.7 | |
Labor hold | Swing | +0.7 | |||
Party | Candidate | Votes | % | ±% | |
---|---|---|---|---|---|
Labor | Anthony Carbines | 18,800 | 46.45 | +10.49 | |
Liberal | Monica Clark | 13,084 | 32.33 | −7.70 | |
Greens | Andrew Conley | 5,962 | 14.73 | −0.91 | |
Independent | Craig Langdon | 1,969 | 4.86 | +0.02 | |
Democratic Labour | Philip Jenkins | 660 | 1.63 | +1.63 | |
Total formal votes | 40,475 | 95.22 | −0.19 | ||
Informal votes | 2,030 | 4.78 | +0.19 | ||
Turnout | 42,505 | 90.87 | −1.98 | ||
Two-party-preferred result | |||||
Labor | Anthony Carbines | 25,244 | 62.37 | +8.96 | |
Liberal | Monica Clark | 15,231 | 37.63 | −8.96 | |
Labor hold | Swing | +8.96 | |||
Party | Candidate | Votes | % | ±% | |
---|---|---|---|---|---|
Liberal | Carl Ziebell | 15,730 | 40.0 | −2.0 | |
Labor | Anthony Carbines | 14,133 | 36.0 | +0.1 | |
Greens | Paul Kennedy | 6,147 | 15.6 | −1.8 | |
Independent | Craig Langdon | 1,905 | 4.8 | +4.8 | |
Christians | Gurmender Grewal | 558 | 1.4 | +1.4 | |
Family First | Jesse Boer | 474 | 1.2 | +0.9 | |
Independent | Abdirizak Mohamed | 355 | 0.9 | +0.9 | |
Total formal votes | 39,302 | 95.4 | −0.1 | ||
Informal votes | 1,890 | 4.6 | +0.1 | ||
Turnout | 41,192 | 92.8 | −1.4 | ||
Two-party-preferred result | |||||
Labor | Anthony Carbines | 20,991 | 53.4 | +1.6 | |
Liberal | Carl Ziebell | 18,311 | 46.6 | −1.6 | |
Labor hold | Swing | +1.6 | |||
Party | Candidate | Votes | % | ±% | |
---|---|---|---|---|---|
Liberal | Carl Ziebell | 14,413 | 41.98 | +10.17 | |
Labor | Anthony Carbines | 12,140 | 35.36 | −6.43 | |
Greens | Paul Kennedy | 6,240 | 18.18 | +3.69 | |
Democratic Labor | Stephen Smith | 1,185 | 3.45 | +3.45 | |
Independent | Gerrit Schorel-Hlavka | 351 | 1.02 | +1.02 | |
Total formal votes | 34,329 | 95.51 | +0.05 | ||
Informal votes | 1,613 | 4.49 | −0.05 | ||
Turnout | 35,942 | 92.68 | −0.21 | ||
Two-party-preferred result | |||||
Labor | Anthony Carbines | 17,755 | 51.68 | −7.19 | |
Liberal | Carl Ziebell | 16,599 | 48.32 | +7.19 | |
Labor hold | Swing | -7.19 | |||
Party | Candidate | Votes | % | ±% | |
---|---|---|---|---|---|
Labor | Craig Langdon | 13,772 | 41.8 | −10.3 | |
Liberal | Maxwell Gratton | 10,481 | 31.8 | −2.5 | |
Greens | Marisa Palmer | 4,776 | 14.5 | +2.4 | |
Independent | Jenny Mulholland | 3,186 | 9.7 | +9.7 | |
Family First | Kevin Tan | 737 | 2.2 | +2.2 | |
Total formal votes | 32,952 | 95.5 | −1.1 | ||
Informal votes | 1,567 | 4.5 | +1.1 | ||
Turnout | 34,519 | 92.9 | |||
Two-party-preferred result | |||||
Labor | Craig Langdon | 19,918 | 60.4 | −2.1 | |
Liberal | Maxwell Gratton | 13,034 | 39.6 | +2.1 | |
Labor hold | Swing | -2.1 | |||
Party | Candidate | Votes | % | ±% | |
---|---|---|---|---|---|
Labor | Craig Langdon | 17,490 | 52.1 | +2.2 | |
Liberal | Peter Nolan | 11,498 | 34.3 | −9.0 | |
Greens | Glen Doreian | 4,067 | 12.1 | +7.0 | |
Independent | Anna Morton | 265 | 0.8 | +0.8 | |
Independent | Martin Appleby | 187 | 0.6 | +0.6 | |
Independent | Gary Schorel-Hlavka | 57 | 0.2 | +0.2 | |
Total formal votes | 33,564 | 96.6 | −0.7 | ||
Informal votes | 1,192 | 3.4 | +0.7 | ||
Turnout | 34,756 | 93.2 | |||
Two-party-preferred result | |||||
Labor | Craig Langdon | 20,972 | 62.5 | +7.7 | |
Liberal | Peter Nolan | 12,586 | 37.5 | −7.7 | |
Labor hold | Swing | +7.7 | |||
Party | Candidate | Votes | % | ±% | |
---|---|---|---|---|---|
Labor | Craig Langdon | 15,079 | 50.1 | +0.8 | |
Liberal | Don McLean | 12,788 | 42.5 | −5.0 | |
Greens | Robyn Roberts | 1,737 | 5.8 | +5.8 | |
Hope | Lee-Anne Poynton | 358 | 1.2 | +1.2 | |
Natural Law | Lawrence Clarke | 132 | 0.4 | −2.8 | |
Total formal votes | 30,094 | 97.2 | −0.7 | ||
Informal votes | 858 | 2.8 | +0.7 | ||
Turnout | 30,952 | 93.2 | |||
Two-party-preferred result | |||||
Labor | Craig Langdon | 16,679 | 55.4 | +3.8 | |
Liberal | Don McLean | 13,413 | 44.6 | −3.8 | |
Labor hold | Swing | +3.8 | |||
Party | Candidate | Votes | % | ±% | |
---|---|---|---|---|---|
Labor | Craig Langdon | 14,965 | 49.3 | +8.7 | |
Liberal | Vin Heffernan | 14,399 | 47.5 | −3.4 | |
Natural Law | Stephen Griffith | 969 | 3.2 | −1.2 | |
Total formal votes | 30,333 | 97.9 | +1.5 | ||
Informal votes | 648 | 2.1 | −1.5 | ||
Turnout | 30,981 | 94.2 | |||
Two-party-preferred result | |||||
Labor | Craig Langdon | 15,623 | 51.6 | +5.9 | |
Liberal | Vin Heffernan | 14,667 | 48.4 | −5.9 | |
Labor gain from Liberal | Swing | +5.9 | |||
Party | Candidate | Votes | % | ±% | |
---|---|---|---|---|---|
Liberal | Vin Heffernan | 15,318 | 50.9 | +6.3 | |
Labor | Chris Watson | 12,226 | 40.6 | −9.3 | |
Natural Law | Steve Griffith | 1,315 | 4.4 | +4.4 | |
Independent | K.H. Schuller | 858 | 2.8 | +2.8 | |
Independent | Steriani Vassis | 406 | 1.3 | +1.3 | |
Total formal votes | 30,123 | 96.4 | +0.1 | ||
Informal votes | 1,138 | 3.6 | −0.1 | ||
Turnout | 31,261 | 95.4 | |||
Two-party-preferred result | |||||
Liberal | Vin Heffernan | 16,330 | 54.3 | +8.2 | |
Labor | Chris Watson | 13,743 | 45.7 | −8.2 | |
Liberal gain from Labor | Swing | +8.2 | |||
Party | Candidate | Votes | % | ±% | |
---|---|---|---|---|---|
Liberal | Vin Heffernan | 13,931 | 50.33 | −1.30 | |
Labor | Patricia Moynihan | 11,671 | 42.16 | −6.21 | |
Democrats | Howard McCallum | 2,079 | 7.51 | +7.51 | |
Total formal votes | 27,681 | 97.26 | −0.48 | ||
Informal votes | 780 | 2.74 | +0.48 | ||
Turnout | 28,461 | 92.94 | −0.61 | ||
Two-party-preferred result | |||||
Liberal | Vin Heffernan | 14,505 | 52.40 | +0.77 | |
Labor | Patricia Moynihan | 13,176 | 47.60 | −0.77 | |
Liberal hold | Swing | +0.77 | |||
Party | Candidate | Votes | % | ±% | |
---|---|---|---|---|---|
Liberal | Vin Heffernan | 14,665 | 51.6 | +6.4 | |
Labor | Tony Sheehan | 13,740 | 48.4 | +0.1 | |
Total formal votes | 28,405 | 97.7 | |||
Informal votes | 657 | 2.3 | |||
Turnout | 29,062 | 93.6 | |||
Liberal gain from Labor | Swing | +2.7 | |||
Party | Candidate | Votes | % | ±% | |
---|---|---|---|---|---|
Labor | Tony Sheehan | 13,492 | 47.2 | +6.8 | |
Liberal | Bruce Skeggs | 13,426 | 47.0 | −1.3 | |
Democrats | Harold Shepherd | 1,677 | 5.9 | −5.4 | |
Total formal votes | 28,595 | 98.1 | +0.5 | ||
Informal votes | 561 | 1.9 | −0.5 | ||
Turnout | 29,156 | 94.5 | +0.6 | ||
Two-party-preferred result | |||||
Labor | Tony Sheehan | 14,449 | 50.5 | +3.9 | |
Liberal | Bruce Skeggs | 14,144 | 49.5 | −3.9 | |
Labor gain from Liberal | Swing | +3.9 | |||
Party | Candidate | Votes | % | ±% | |
---|---|---|---|---|---|
Liberal | Bruce Skeggs | 13,483 | 48.3 | −5.7 | |
Labor | Tony Sheehan | 11,279 | 40.4 | +2.3 | |
Democrats | Mario Piraino | 3,146 | 11.3 | +11.3 | |
Total formal votes | 27,908 | 97.6 | −0.5 | ||
Informal votes | 689 | 2.4 | +0.5 | ||
Turnout | 28,597 | 93.9 | +1.3 | ||
Two-party-preferred result | |||||
Liberal | Bruce Skeggs | 14,902 | 53.4 | −7.7 | |
Labor | Tony Sheehan | 13,006 | 46.6 | +7.7 | |
Liberal hold | Swing | -7.7 | |||
Party | Candidate | Votes | % | ±% | |
---|---|---|---|---|---|
Liberal | Bruce Skeggs | 15,153 | 54.0 | +7.2 | |
Labor | John Lelleton | 10,691 | 38.1 | −0.5 | |
Democratic Labor | Margaret Rush | 2,196 | 7.8 | −0.3 | |
Total formal votes | 28,040 | 98.1 | |||
Informal votes | 544 | 1.9 | |||
Turnout | 28,584 | 92.6 | |||
Two-party-preferred result | |||||
Liberal | Bruce Skeggs | 17,129 | 61.1 | +6.2 | |
Labor | John Lelleton | 10,911 | 38.9 | −6.2 | |
Liberal hold | Swing | -6.2 | |||
Party | Candidate | Votes | % | ±% | |
---|---|---|---|---|---|
Labor | John Daley | 11,401 | 43.6 | −0.4 | |
Liberal | Bruce Skeggs | 11,095 | 42.4 | +0.5 | |
Democratic Labor | Kevin Barry | 2,127 | 8.1 | −6.0 | |
Australia | Patricia Robinson | 1,518 | 5.8 | +5.8 | |
Total formal votes | 26,141 | 97.0 | −0.4 | ||
Informal votes | 799 | 3.0 | +0.4 | ||
Turnout | 26,940 | 93.6 | −0.3 | ||
Two-party-preferred result | |||||
Liberal | Bruce Skeggs | 13,158 | 50.3 | −4.3 | |
Labor | John Daley | 12,983 | 49.7 | +4.3 | |
Liberal hold | Swing | -4.3 | |||
Party | Candidate | Votes | % | ±% | |
---|---|---|---|---|---|
Labor | Thomas Rich | 10,718 | 44.0 | +3.9 | |
Liberal | Vernon Christie | 10,211 | 41.9 | −1.2 | |
Democratic Labor | Michael Lucy | 3,444 | 14.1 | 0.0 | |
Total formal votes | 24,373 | 97.4 | −0.1 | ||
Informal votes | 658 | 2.6 | +0.1 | ||
Turnout | 25,031 | 93.9 | −0.3 | ||
Two-party-preferred result | |||||
Liberal | Vernon Christie | 13,312 | 54.6 | −2.6 | |
Labor | Thomas Rich | 11,061 | 45.4 | +2.6 | |
Liberal hold | Swing | -2.6 | |||
Party | Candidate | Votes | % | ±% | |
---|---|---|---|---|---|
Liberal | Vernon Christie | 10,254 | 43.1 | +0.7 | |
Labor | Thomas Rich | 9,545 | 40.1 | −0.9 | |
Democratic Labor | Cyril Cummins | 3,365 | 14.1 | −2.5 | |
Independent | Bruce Graham | 642 | 2.7 | +2.7 | |
Total formal votes | 23,806 | 97.5 | |||
Informal votes | 604 | 2.5 | |||
Turnout | 24,410 | 94.2 | |||
Two-party-preferred result | |||||
Liberal | Vernon Christie | 13,604 | 57.2 | +0.6 | |
Labor | Thomas Rich | 10,202 | 42.8 | −0.6 | |
Liberal hold | Swing | +0.6 | |||
Party | Candidate | Votes | % | ±% | |
---|---|---|---|---|---|
Liberal and Country | Vernon Christie | 10,492 | 47.9 | −0.1 | |
Labor | William Kelly | 8,235 | 37.6 | +0.7 | |
Democratic Labor | Cyril Cummins | 3,192 | 14.6 | −0.5 | |
Total formal votes | 21,919 | 98.3 | +0.2 | ||
Informal votes | 383 | 1.7 | −0.2 | ||
Turnout | 22,302 | 94.1 | −0.2 | ||
Two-party-preferred result | |||||
Liberal and Country | Vernon Christie | 13,467 | 61.4 | −0.2 | |
Labor | William Kelly | 8,452 | 38.6 | +0.2 | |
Liberal and Country hold | Swing | -0.2 | |||
Party | Candidate | Votes | % | ±% | |
---|---|---|---|---|---|
Liberal and Country | Vernon Christie | 10,492 | 48.0 | −0.2 | |
Labor | Norman Rothfield | 8,070 | 36.9 | −1.1 | |
Democratic Labor | Cyril Cummins | 3,298 | 15.1 | +1.3 | |
Total formal votes | 21,860 | 98.1 | −0.6 | ||
Informal votes | 413 | 1.9 | +0.6 | ||
Turnout | 22,273 | 94.3 | +0.6 | ||
Two-party-preferred result | |||||
Liberal and Country | Vernon Christie | 13,475 | 61.6 | +1.2 | |
Labor | Norman Rothfield | 8,385 | 38.4 | −1.2 | |
Liberal and Country hold | Swing | +1.2 | |||
Party | Candidate | Votes | % | ±% | |
---|---|---|---|---|---|
Liberal and Country | Vernon Christie | 10,547 | 48.2 | ||
Labor | David Walker | 8,305 | 38.0 | ||
Democratic Labor | Cyril Cummins | 3,021 | 13.8 | ||
Total formal votes | 21,873 | 98.7 | |||
Informal votes | 289 | 1.3 | |||
Turnout | 22,162 | 93.7 | |||
Two-party-preferred result | |||||
Liberal and Country | Vernon Christie | 13,210 | 60.4 | ||
Labor | David Walker | 8,663 | 39.6 | ||
Liberal and Country hold | Swing | ||||
Party | Candidate | Votes | % | ±% | |
---|---|---|---|---|---|
Liberal and Country | Vernon Christie | 9,014 | 50.4 | ||
Labor | David Walker | 6,420 | 35.9 | ||
Labor (A-C) | John O'Dwyer | 2,447 | 13.7 | ||
Total formal votes | 17,881 | 98.7 | |||
Informal votes | 237 | 1.3 | |||
Turnout | 18,118 | 94.0 | |||
Two-party-preferred result | |||||
Liberal and Country | Vernon Christie | 11,093 | 62.0 | ||
Labor | David Walker | 6,788 | 38.0 | ||
Liberal and Country gain from Labor | Swing | ||||
Party | Candidate | Votes | % | ±% | |
---|---|---|---|---|---|
Labor | Michael Lucy | 14,800 | 44.0 | +2.4 | |
Independent | Reginald Leonard | 9,058 | 26.9 | +26.9 | |
Liberal and Country | Frank Block | 8,424 | 25.0 | −33.4 | |
Independent | Harcourt Bell | 1,372 | 4.1 | +4.1 | |
Total formal votes | 33,654 | 98.2 | −1.1 | ||
Informal votes | 606 | 1.8 | +1.1 | ||
Turnout | 34,260 | 94.8 | +0.7 | ||
Two-party-preferred result | |||||
Labor | Michael Lucy | 18,069 | 53.5 | +11.9 | |
Liberal and Country | Frank Block | 15,585 | 46.5 | −11.9 | |
Labor gain from Liberal and Country | Swing | +11.9 | |||
Party | Candidate | Votes | % | ±% | |
---|---|---|---|---|---|
Labor | Michael Lucy | 10,144 | 35.6 | −6.0 | |
Liberal and Country | Frank Block | 9,952 | 34.9 | −23.5 | |
Independent | Reginald Leonard | 8,400 | 29.5 | +29.5 | |
Total formal votes | 28,496 | 98.7 | −0.6 | ||
Informal votes | 361 | 1.3 | +0.6 | ||
Turnout | 28,857 | 89.4 | −4.7 | ||
Two-party-preferred result | |||||
Liberal and Country | Frank Block | 15,835 | 55.6 | −2.8 | |
Labor | Michael Lucy | 12,661 | 44.4 | +2.8 | |
Liberal and Country hold | Swing | -2.8 | |||
Party | Candidate | Votes | % | ±% | |
---|---|---|---|---|---|
Liberal and Country | Rupert Curnow | 16,850 | 58.4 | −3.3 | |
Labor | David Walker | 11,997 | 41.6 | +41.6 | |
Total formal votes | 28,847 | 99.3 | +0.5 | ||
Informal votes | 209 | 0.7 | −0.5 | ||
Turnout | 29,056 | 94.1 | +1.0 | ||
Liberal and Country hold | Swing | N/A | |||
Party | Candidate | Votes | % | ±% | |
---|---|---|---|---|---|
Liberal | Rupert Curnow | 14,971 | 61.7 | +12.7 | |
Independent | Robert Gardner | 8,613 | 35.5 | −15.5 | |
Independent Liberal | Leighton Weber | 677 | 2.8 | +2.8 | |
Total formal votes | 24,261 | 98.8 | +0.9 | ||
Informal votes | 283 | 1.2 | −0.9 | ||
Turnout | 24,544 | 93.1 | +6.1 | ||
Liberal gain from Independent | Swing | N/A | |||
Party | Candidate | Votes | % | ±% | |
---|---|---|---|---|---|
Independent | Robert Gardner | 10,162 | 51.0 | ||
Liberal | Maxwell Dunn | 9,756 | 49.0 | ||
Total formal votes | 19,918 | 97.9 | |||
Informal votes | 419 | 2.1 | |||
Turnout | 20,337 | 87.0 | |||
Independent gain from Liberal | Swing | ||||
The Division of Jagajaga is an Australian Electoral Division in the state of Victoria. It is located in the north-eastern suburbs of Melbourne, and lies north of the Yarra River. It covers an area of approximately 104 square kilometres and comprises the suburbs of Bellfield, Briar Hill, Diamond Creek, Eaglemont, Greensborough, Heidelberg, Heidelberg Heights, Heidelberg West, Ivanhoe, Ivanhoe East, Lower Plenty, Montmorency, Plenty, Rosanna, St Helena, Viewbank, Yallambie, Watsonia and Watsonia North; and parts of Bundoora, Eltham, Eltham North, Hurstbridge, Macleod, Wattle Glen and Yarrambat.
North-Eastern Metropolitan Region, previously Eastern Metropolitan Region between 2006 and 2022, is one of the eight electoral regions of Victoria, Australia, which elects five members to the Victorian Legislative Council by proportional representation. The region was created in 2006 following the 2005 reform of the Victorian Legislative Council. The region was renamed to its current name since the 2022 state election.
The electoral district of Ivanhoe is an electoral district of the Victorian Legislative Assembly. It is located in the north-eastern suburbs of Melbourne and includes the suburbs of Heidelberg, Heidelberg Heights, Heidelberg West, Bellfield, Ivanhoe, Ivanhoe East, Eaglemont, Rosanna, Viewbank, Yallambie and Macleod.
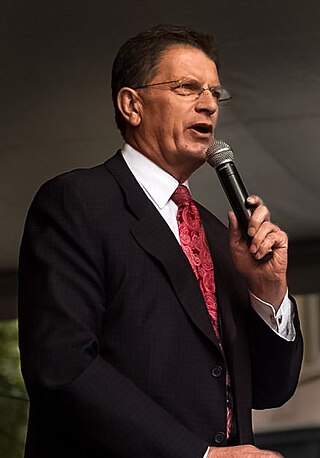
The 2010 Victorian state election, held on Saturday, 27 November 2010, was for the 57th Parliament of Victoria. The election was to elect all 88 members of the Legislative Assembly and all 40 members of the Legislative Council. The incumbent centre-left Labor Party government, led by John Brumby, was defeated by the centre-right Liberal/National Coalition opposition, led by Ted Baillieu. The election gave the Coalition a one-seat majority in both houses of parliament.
This is a list of electoral results for the Electoral district of Cranbourne in Victorian state elections.
This is a list of electoral results for the district of Lara in Victorian state elections.
This is a list of electoral results for the Electoral district of Morwell in Victorian state elections.
This is a list of electoral results for the district of Mulgrave in Victorian state elections.
This is a list of electoral results for the district of Narracan in Victorian state elections.
This is a list of electoral results for the Electoral district of Narre Warren North in Victorian state elections.
This is a list of electoral results for the Electoral district of Nepean in Victorian state elections.
This is a list of electoral results for the Electoral district of Niddrie in Victorian state elections.
This is a list of electoral results for the Electoral district of Northcote in Victorian state elections.
This is a list of electoral results for the Electoral district of Oakleigh in Victorian state elections.
This is a list of electoral results for the Electoral district of Sandringham in Victorian state elections.
This is a list of electoral results for the Electoral district of Tarneit in Victorian state elections.
This is a list of electoral results for the Electoral district of Warrandyte in Victorian state elections.
This is a list of electoral results for the district of Yan Yean in Victorian state elections.
The electoral district of Murray Plains is an electoral district of the Victorian Legislative Assembly in Australia. It was created in the redistribution of electoral boundaries in 2013, and came into effect at the 2014 state election.
This is a list of electoral district results for the 2022 Victorian state election for the Legislative Assembly.