This is a list of electoral results for the Electoral district of Monbulk in Victorian state elections.
Member | Party | Term | |
---|---|---|---|
Bill Borthwick | Liberal | 1967–1982 | |
Neil Pope | Labor | 1982–1992 | |
Steve McArthur | Liberal | 1992–2002 | |
James Merlino | Labor | 2002–2022 | |
Daniela De Martino | Labor | 2022–present | |
Party | Candidate | Votes | % | ±% | |
---|---|---|---|---|---|
Labor | Daniela De Martino | 15,071 | 36.1 | −6.0 | |
Liberal | Gareth Ward | 12,327 | 29.5 | −8.1 | |
Greens | Michael Ormsby | 6,255 | 15.0 | −1.2 | |
Independent | Johanna Skelton | 2,229 | 5.3 | +5.3 | |
Independent | Craig Cole | 2,069 | 5.0 | +5.0 | |
Animal Justice | Leah Folloni | 1,739 | 4.2 | +4.0 | |
Family First | David Higgins | 1,197 | 2.9 | +2.9 | |
Freedom | Veronica Barnes | 910 | 2.2 | +2.2 | |
Total formal votes | 41,797 | 95.3 | +0.4 | ||
Informal votes | 2,063 | 4.7 | −0.4 | ||
Turnout | 43,860 | 90.4 | |||
Two-party-preferred result | |||||
Labor | Daniela De Martino | 24,056 | 57.6 | +0.5 | |
Liberal | Gareth Ward | 17,741 | 42.4 | –0.5 | |
Labor hold | Swing | –0.5 | |||
Party | Candidate | Votes | % | ±% | |
---|---|---|---|---|---|
Labor | James Merlino | 15,912 | 41.89 | +4.35 | |
Liberal | John Schurink | 13,823 | 36.39 | −3.73 | |
Greens | Liz Hicks | 5,826 | 15.34 | +1.94 | |
Democratic Labour | Joshua Norman | 1,251 | 3.29 | +2.14 | |
Independent | Jordan Crook | 1,176 | 3.10 | +2.18 | |
Total formal votes | 37,988 | 95.15 | +0.31 | ||
Informal votes | 1,938 | 4.85 | −0.31 | ||
Turnout | 39,926 | 92.16 | −2.32 | ||
Two-party-preferred result | |||||
Labor | James Merlino | 22,266 | 58.61 | +3.65 | |
Liberal | John Schurink | 15,722 | 41.39 | −3.65 | |
Labor hold | Swing | +3.65 | |||
Party | Candidate | Votes | % | ±% | |
---|---|---|---|---|---|
Liberal | Mark Verschuur | 15,063 | 40.1 | −4.6 | |
Labor | James Merlino | 14,096 | 37.5 | +3.4 | |
Greens | Michael Clarke | 5,029 | 13.4 | −1.6 | |
Animal Justice | Jennifer McAdam | 1,079 | 2.9 | +2.9 | |
Family First | Amelia Mason | 786 | 2.1 | −0.0 | |
Democratic Labour | Ron Prendergast | 433 | 1.2 | −0.4 | |
Rise Up Australia | Ana Rojas | 427 | 1.1 | +1.1 | |
Independent | Jordan Crook | 342 | 0.9 | +0.9 | |
Country Alliance | Craig Jenkin | 293 | 0.8 | −0.2 | |
Total formal votes | 37,548 | 94.8 | −0.7 | ||
Informal votes | 2,044 | 5.2 | +0.7 | ||
Turnout | 39,592 | 94.5 | −1.6 | ||
Two-party-preferred result | |||||
Labor | James Merlino | 20,643 | 55.0 | +6.1 | |
Liberal | Mark Verschuur | 16,905 | 45.0 | −6.1 | |
Labor notional gain from Liberal | Swing | +6.1 | |||
Party | Candidate | Votes | % | ±% | |
---|---|---|---|---|---|
Liberal | Matt Mills | 14,506 | 42.55 | +5.16 | |
Labor | James Merlino | 12,318 | 36.14 | −4.47 | |
Greens | Jo Tenner | 5,244 | 15.38 | −0.78 | |
Democratic Labor | Elizabeth Coyne | 618 | 1.81 | +1.81 | |
Family First | Rajeeva Gunasekera | 610 | 1.79 | −2.37 | |
Country Alliance | Simon Picknell | 528 | 1.55 | +1.55 | |
Independent | Lawrence Mobsby | 264 | 0.77 | +0.77 | |
Total formal votes | 34,088 | 95.56 | −0.29 | ||
Informal votes | 1,582 | 4.44 | +0.29 | ||
Turnout | 35,670 | 94.15 | +0.18 | ||
Two-party-preferred result | |||||
Labor | James Merlino | 17,762 | 52.08 | −4.45 | |
Liberal | Matt Mills | 16,345 | 47.92 | +4.45 | |
Labor hold | Swing | -4.45 | |||
Party | Candidate | Votes | % | ±% | |
---|---|---|---|---|---|
Labor | James Merlino | 13,263 | 40.6 | −3.0 | |
Liberal | Clive Larkman | 12,212 | 37.4 | −0.0 | |
Greens | Robert Stephen | 5,278 | 16.2 | +0.4 | |
Family First | Carl Huybers | 1,359 | 4.2 | +4.2 | |
People Power | Joanne Stride | 547 | 1.7 | +1.7 | |
Total formal votes | 32,659 | 95.8 | −1.3 | ||
Informal votes | 1,415 | 4.2 | +1.3 | ||
Turnout | 34,074 | 94.0 | |||
Two-party-preferred result | |||||
Labor | James Merlino | 18,511 | 56.7 | −1.6 | |
Liberal | Clive Larkman | 14,148 | 43.3 | +1.6 | |
Labor hold | Swing | -1.6 | |||
Party | Candidate | Votes | % | ±% | |
---|---|---|---|---|---|
Labor | James Merlino | 14,303 | 43.6 | +3.0 | |
Liberal | Steve McArthur | 12,285 | 37.4 | −11.6 | |
Greens | Craig Smith | 5,182 | 15.8 | +8.8 | |
Democrats | Tony Holland | 537 | 1.6 | +1.6 | |
Christian Democrats | Wolf Voigt | 532 | 1.6 | +0.4 | |
Total formal votes | 32,839 | 97.1 | −0.2 | ||
Informal votes | 974 | 2.9 | +0.2 | ||
Turnout | 33,813 | 93.6 | |||
Two-party-preferred result | |||||
Labor | James Merlino | 19,132 | 58.3 | +10.7 | |
Liberal | Steve McArthur | 13,707 | 41.7 | −10.7 | |
Labor gain from Liberal | Swing | +10.7 | |||
Party | Candidate | Votes | % | ±% | |
---|---|---|---|---|---|
Liberal | Steve McArthur | 15,206 | 49.8 | −2.7 | |
Labor | Leslie Wood | 12,266 | 40.2 | +2.0 | |
Greens | Robyn Holtham | 1,928 | 6.3 | +6.3 | |
Democratic Labor | Frank Feltham | 443 | 1.5 | +1.5 | |
Christian Democrats | Wolf Voigt | 414 | 1.4 | +1.4 | |
Natural Law | Lorna Scurfield | 258 | 0.8 | −0.5 | |
Total formal votes | 30,515 | 97.2 | −0.8 | ||
Informal votes | 870 | 2.8 | +0.8 | ||
Turnout | 31,385 | 93.3 | |||
Two-party-preferred result | |||||
Liberal | Steve McArthur | 16,241 | 53.2 | −2.0 | |
Labor | Leslie Wood | 14,306 | 46.8 | +2.0 | |
Liberal hold | Swing | -2.0 | |||
Party | Candidate | Votes | % | ±% | |
---|---|---|---|---|---|
Liberal | Steve McArthur | 15,684 | 52.5 | +1.7 | |
Labor | Philip Staindl | 11,390 | 38.2 | +2.0 | |
Independent | Louis Delacretaz | 2,024 | 6.8 | +6.8 | |
Natural Law | Jennifer Brain | 390 | 1.3 | −0.6 | |
Independent | Terry Lonergan | 358 | 1.2 | +1.2 | |
Total formal votes | 29,846 | 98.1 | +1.1 | ||
Informal votes | 586 | 1.9 | −1.1 | ||
Turnout | 30,432 | 94.5 | |||
Two-party-preferred result | |||||
Liberal | Steve McArthur | 16,442 | 55.2 | −0.1 | |
Labor | Philip Staindl | 13,325 | 44.8 | +0.1 | |
Liberal hold | Swing | -0.1 | |||
Party | Candidate | Votes | % | ±% | |
---|---|---|---|---|---|
Liberal | Steve McArthur | 14,584 | 50.8 | +8.4 | |
Labor | Neil Pope | 10,368 | 36.1 | −16.0 | |
Independent | Jenny Saulwick | 1,646 | 5.7 | +5.7 | |
Democrats | John McLaren | 1,568 | 5.5 | +5.2 | |
Natural Law | Bill Watson | 542 | 1.9 | +1.9 | |
Total formal votes | 28,708 | 96.9 | −0.3 | ||
Informal votes | 907 | 3.1 | +0.3 | ||
Turnout | 29,615 | 95.6 | |||
Two-party-preferred result | |||||
Liberal | Steve McArthur | 15,814 | 55.3 | +9.6 | |
Labor | Neil Pope | 12,771 | 44.7 | −9.6 | |
Liberal gain from Labor | Swing | +9.6 | |||
Party | Candidate | Votes | % | ±% | |
---|---|---|---|---|---|
Labor | Neil Pope | 14,384 | 51.89 | −1.82 | |
Liberal | Nola Vulling | 12,167 | 43.89 | −2.40 | |
Call to Australia | Christopher Shirreff | 1,168 | 4.21 | +4.21 | |
Total formal votes | 27,719 | 97.26 | −0.50 | ||
Informal votes | 781 | 2.74 | +0.50 | ||
Turnout | 28,500 | 92.77 | +0.14 | ||
Two-party-preferred result | |||||
Labor | Neil Pope | 14,840 | 53.54 | −0.17 | |
Liberal | Nola Vulling | 12,879 | 46.46 | +0.17 | |
Labor hold | Swing | -0.17 | |||
Party | Candidate | Votes | % | ±% | |
---|---|---|---|---|---|
Labor | Neil Pope | 14,239 | 53.7 | +12.3 | |
Liberal | Raymond Yates | 12,270 | 46.3 | +7.1 | |
Total formal votes | 26,509 | 97.8 | |||
Informal votes | 608 | 2.2 | |||
Turnout | 27,117 | 92.6 | |||
Labor hold | Swing | +0.9 | |||
Party | Candidate | Votes | % | ±% | |
---|---|---|---|---|---|
Labor | Neil Pope | 12,477 | 41.8 | 0.0 | |
Liberal | Bill Borthwick | 11,727 | 39.3 | −7.0 | |
Independent | Bert Wainer | 2,892 | 9.7 | +9.7 | |
Democrats | Milton Blake | 2,001 | 6.7 | −4.1 | |
Independent | Jean Langworthy | 737 | 2.5 | +2.5 | |
Total formal votes | 29,834 | 97.5 | 0.0 | ||
Informal votes | 748 | 2.5 | 0.0 | ||
Turnout | 30,582 | 93.4 | +1.0 | ||
Two-party-preferred result | |||||
Labor | Neil Pope | 15,809 | 53.0 | +5.2 | |
Liberal | Bill Borthwick | 14,025 | 47.0 | −5.2 | |
Labor gain from Liberal | Swing | +5.2 | |||
Party | Candidate | Votes | % | ±% | |
---|---|---|---|---|---|
Liberal | Bill Borthwick | 12,619 | 46.3 | −10.3 | |
Labor | Francesco Cafarella | 11,400 | 41.8 | −1.6 | |
Democrats | Malcolm Matheson | 2,938 | 10.8 | +10.8 | |
Australia | Ian Wood | 301 | 1.1 | +1.1 | |
Total formal votes | 27,258 | 97.5 | −0.3 | ||
Informal votes | 693 | 2.5 | +0.3 | ||
Turnout | 27,951 | 92.4 | +0.9 | ||
Two-party-preferred result | |||||
Liberal | Bill Borthwick | 14,224 | 52.2 | −4.4 | |
Labor | Francesco Cafarella | 13,034 | 47.8 | +4.4 | |
Liberal hold | Swing | -4.4 | |||
Party | Candidate | Votes | % | ±% | |
---|---|---|---|---|---|
Liberal | Bill Borthwick | 13,978 | 56.6 | +5.0 | |
Labor | Stuart Morris | 10,704 | 43.4 | +2.7 | |
Total formal votes | 24,682 | 97.8 | |||
Informal votes | 561 | 2.2 | |||
Turnout | 25,243 | 91.5 | |||
Liberal hold | Swing | +0.1 | |||
Party | Candidate | Votes | % | ±% | |
---|---|---|---|---|---|
Liberal | Bill Borthwick | 17,494 | 51.7 | +4.4 | |
Labor | Vernon Allison | 13,690 | 40.5 | −1.4 | |
Australia | David Barford | 1,431 | 4.2 | +4.2 | |
Democratic Labor | Franciscus Hallewas | 1,215 | 3.6 | −7.2 | |
Total formal votes | 33,830 | 97.7 | +0.6 | ||
Informal votes | 788 | 2.3 | −0.6 | ||
Turnout | 34,618 | 92.2 | −1.9 | ||
Two-party-preferred result | |||||
Liberal | Bill Borthwick | 19,099 | 56.5 | −0.2 | |
Labor | Vernon Allison | 14,731 | 43.5 | +0.2 | |
Liberal hold | Swing | -0.2 | |||
Party | Candidate | Votes | % | ±% | |
---|---|---|---|---|---|
Liberal | Bill Borthwick | 12,582 | 47.3 | −3.6 | |
Labor | James Simmonds | 11,151 | 41.9 | +5.6 | |
Democratic Labor | George Noone | 2,865 | 10.8 | −0.8 | |
Total formal votes | 26,598 | 97.1 | +0.3 | ||
Informal votes | 791 | 2.9 | −0.3 | ||
Turnout | 27,389 | 94.1 | +0.4 | ||
Two-party-preferred result | |||||
Liberal | Bill Borthwick | 15,079 | 56.7 | −4.6 | |
Labor | James Simmonds | 11,519 | 43.3 | +4.6 | |
Liberal hold | Swing | -4.6 | |||
Party | Candidate | Votes | % | ±% | |
---|---|---|---|---|---|
Liberal | Bill Borthwick | 11,621 | 50.9 | −2.6 | |
Labor | Margaret Howells | 8,290 | 36.3 | +0.8 | |
Democratic Labor | Noel Clarke | 2,642 | 11.6 | +0.5 | |
Independent | Ronald Pike | 290 | 1.3 | +1.3 | |
Total formal votes | 22,843 | 96.8 | |||
Informal votes | 750 | 3.2 | |||
Turnout | 23,593 | 93.7 | |||
Two-party-preferred result | |||||
Liberal | Bill Borthwick | 14,012 | 61.3 | −1.6 | |
Labor | Margaret Howells | 8,831 | 38.7 | +1.6 | |
Liberal hold | Swing | -1.6 | |||
The electoral district of Gembrook was an electoral district of the Victorian Legislative Assembly. It was situated on the edge of metropolitan Melbourne. Included within its boundaries were Emerald, Cockatoo, Gembrook, Beaconsfield, and sizeable parts of Berwick and Pakenham. The district formerly extended north to Yarra Valley communities such as Warburton and Launching Place prior to the seat's redistribution at the 2014 election.
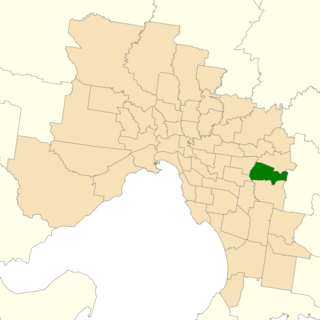
The electoral district of Ferntree Gully was an electorate of the Victorian Legislative Assembly. It was created in 2002 as a replacement for the abolished electorate of Knox.
Eastern Victoria Region is one of the eight electoral regions of Victoria, Australia, which elects five members to the Victorian Legislative Council by proportional representation. The region was created in 2006 following the 2005 reform of the Victorian Legislative Council.
This is a list of electoral results for the Electoral district of Cranbourne in Victorian state elections.
This is a list of electoral results for the Electoral district of Melbourne in Victorian state elections.
This is a list of electoral results for the Electoral district of Mordialloc in Victorian state elections.
This is a list of electoral results for the Electoral district of Morwell in Victorian state elections.
This is a list of electoral results for the district of Mulgrave in Victorian state elections.
This is a list of electoral results for the district of Narracan in Victorian state elections.
This is a list of electoral results for the Electoral district of Narre Warren North in Victorian state elections.
This is a list of electoral results for the Electoral district of Niddrie in Victorian state elections.
This is a list of electoral results for the Electoral district of Northcote in Victorian state elections.
This is a list of electoral results for the Electoral district of Oakleigh in Victorian state elections.
This is a list of electoral results for the Electoral district of Polwarth in Victorian state elections.
This is a list of electoral results for the Electoral district of Sandringham in Victorian state elections.
This is a list of electoral results for the Electoral district of South-West Coast in Victorian state elections.
This is a list of electoral results for the Electoral district of Warrandyte in Victorian state elections.
This is a list of electoral results for the district of Yan Yean in Victorian state elections.
This is a list of electoral district results for the Victorian 2014 election for the Legislative Assembly.
This is a list of electoral district results for the 2018 Victorian state election for the Legislative Assembly.